Business Analysis and Interpretation of Financial Ratios Report
VerifiedAdded on 2020/06/04
|12
|1791
|475
Report
AI Summary
This report provides a detailed analysis of financial ratios and cash cycles for Boral Ltd and CSR Ltd. The analysis covers key ratios such as net profit margin, asset turnover ratio, current ratio, quick ratio, and debt-equity ratio, examining their trends and implications for each company's financial performance. The report also explores the cash cycle for both firms, evaluating their working capital management. Based on the ratio analysis, the report offers specific recommendations for each company to improve their financial performance, including restructuring capital structures, controlling indirect expenses, and optimizing asset utilization. The conclusion emphasizes the importance of regular ratio analysis and cash cycle computation for effective financial management and timely decision-making. The report includes tables with ratio calculations and provides references to relevant literature.
BUSINESS ANALYSIS AND
INTERPRETATION
INTERPRETATION
Paraphrase This Document
Need a fresh take? Get an instant paraphrase of this document with our AI Paraphraser
TABLE OF CONTENTS
INTRODUCTION...........................................................................................................................1
Ratio.................................................................................................................................................1
Cash cycle........................................................................................................................................2
Recommendation.............................................................................................................................2
CONCLUSION................................................................................................................................3
Figure 1Net profit ratio....................................................................................................................1
Figure 2Asset turnover ratio............................................................................................................2
Figure 3Current ratio.......................................................................................................................3
Figure 4Quick ratio..........................................................................................................................4
Figure 5Debt equity ratio.................................................................................................................4
Figure 6Cash cycle ratio..................................................................................................................5
INTRODUCTION
Ratio analysis and cash cycle are important approaches that are used to measure firm’s
performance. In the current report, ratio analysis of selected firms is done and comments are
given on same. Along with this, recommendations are given upon which firms can improve their
performance. In this way, entire research work is carried out.
Ratio
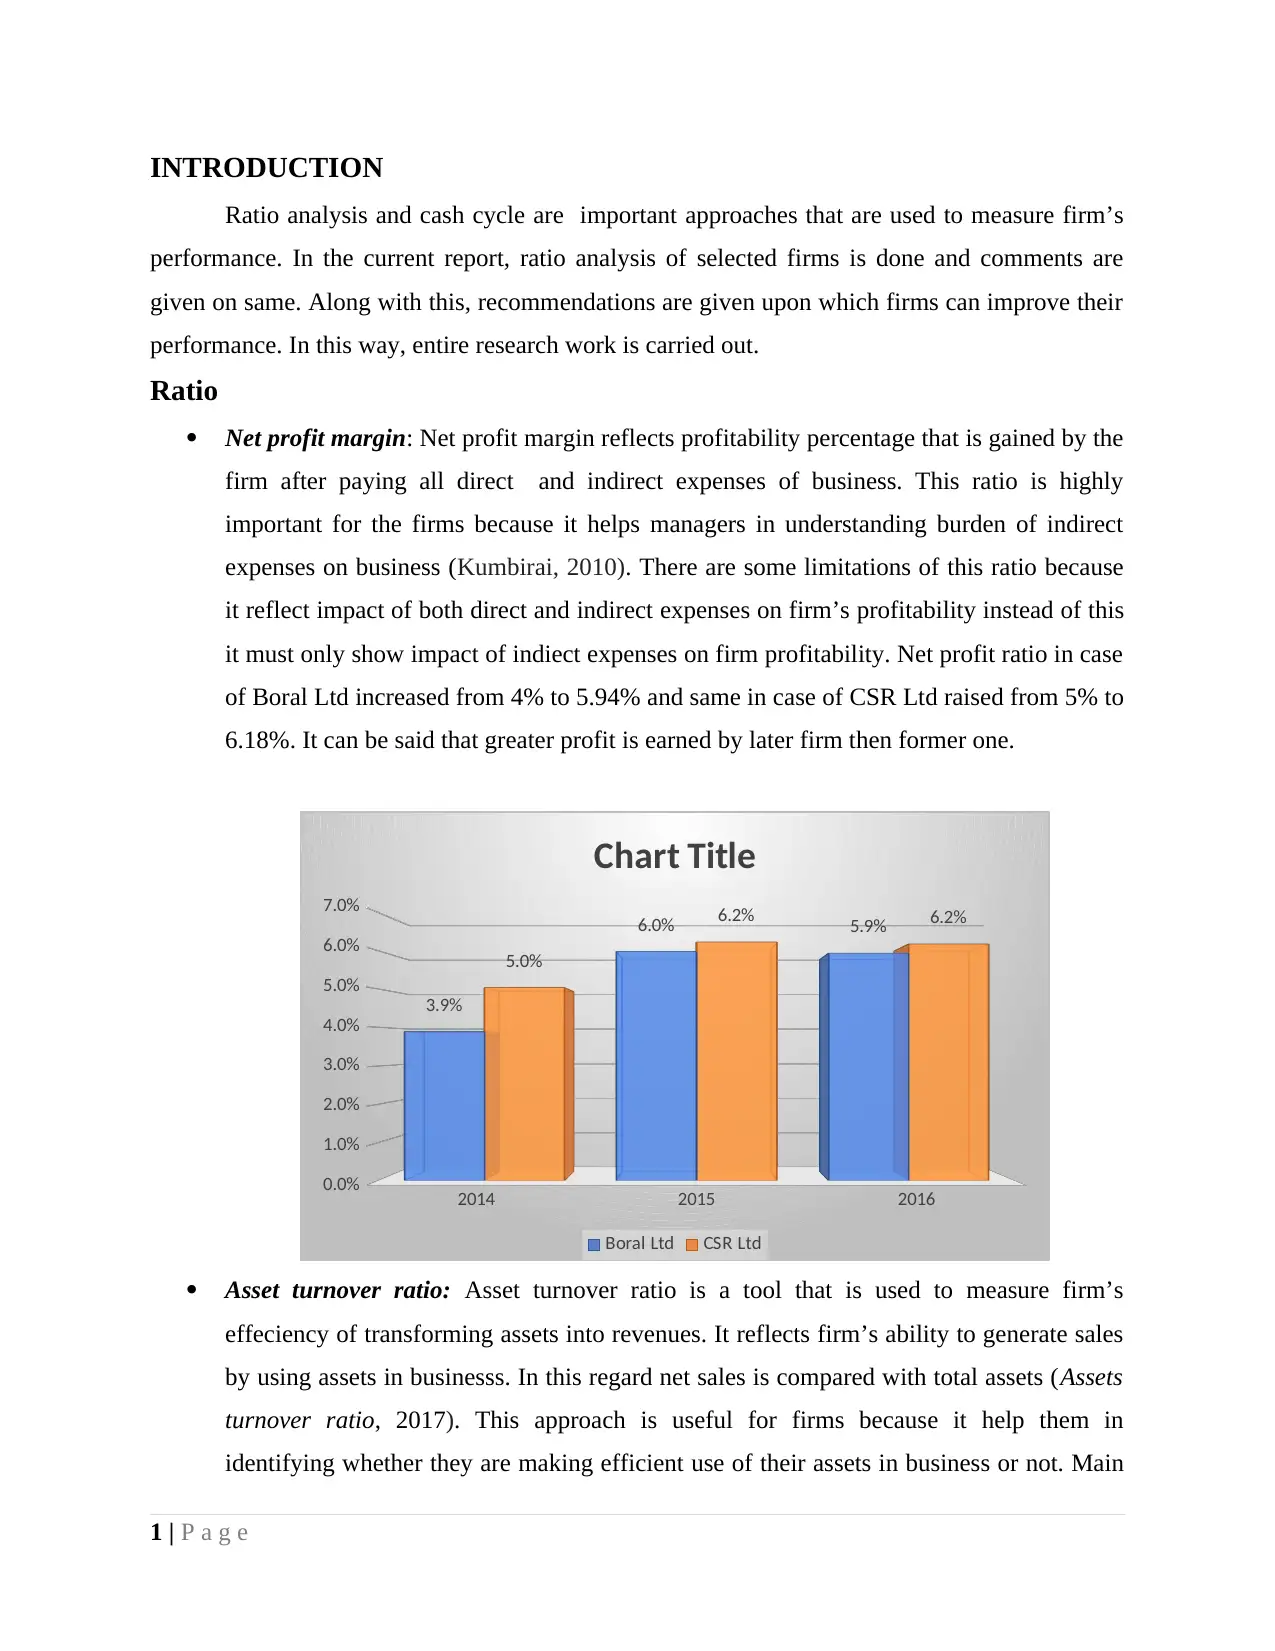
Net profit margin: Net profit margin reflects profitability percentage that is gained by the
firm after paying all direct and indirect expenses of business. This ratio is highly
important for the firms because it helps managers in understanding burden of indirect
expenses on business (Kumbirai, 2010). There are some limitations of this ratio because
it reflect impact of both direct and indirect expenses on firm’s profitability instead of this
it must only show impact of indiect expenses on firm profitability. Net profit ratio in case
of Boral Ltd increased from 4% to 5.94% and same in case of CSR Ltd raised from 5% to
6.18%. It can be said that greater profit is earned by later firm then former one.
2014 2015 2016
0.0%
1.0%
2.0%
3.0%
4.0%
5.0%
6.0%
7.0%
3.9%
6.0% 5.9%
5.0%
6.2% 6.2%
Chart Title
Boral Ltd CSR Ltd
Asset turnover ratio: Asset turnover ratio is a tool that is used to measure firm’s
effeciency of transforming assets into revenues. It reflects firm’s ability to generate sales
by using assets in businesss. In this regard net sales is compared with total assets (Assets
turnover ratio, 2017). This approach is useful for firms because it help them in
identifying whether they are making efficient use of their assets in business or not. Main
1 | P a g e
Ratio analysis and cash cycle are important approaches that are used to measure firm’s
performance. In the current report, ratio analysis of selected firms is done and comments are
given on same. Along with this, recommendations are given upon which firms can improve their
performance. In this way, entire research work is carried out.
Ratio
Net profit margin: Net profit margin reflects profitability percentage that is gained by the
firm after paying all direct and indirect expenses of business. This ratio is highly
important for the firms because it helps managers in understanding burden of indirect
expenses on business (Kumbirai, 2010). There are some limitations of this ratio because
it reflect impact of both direct and indirect expenses on firm’s profitability instead of this
it must only show impact of indiect expenses on firm profitability. Net profit ratio in case
of Boral Ltd increased from 4% to 5.94% and same in case of CSR Ltd raised from 5% to
6.18%. It can be said that greater profit is earned by later firm then former one.
2014 2015 2016
0.0%
1.0%
2.0%
3.0%
4.0%
5.0%
6.0%
7.0%
3.9%
6.0% 5.9%
5.0%
6.2% 6.2%
Chart Title
Boral Ltd CSR Ltd
Asset turnover ratio: Asset turnover ratio is a tool that is used to measure firm’s
effeciency of transforming assets into revenues. It reflects firm’s ability to generate sales
by using assets in businesss. In this regard net sales is compared with total assets (Assets
turnover ratio, 2017). This approach is useful for firms because it help them in
identifying whether they are making efficient use of their assets in business or not. Main
1 | P a g e
⊘ This is a preview!⊘
Do you want full access?
Subscribe today to unlock all pages.
Trusted by 1+ million students worldwide
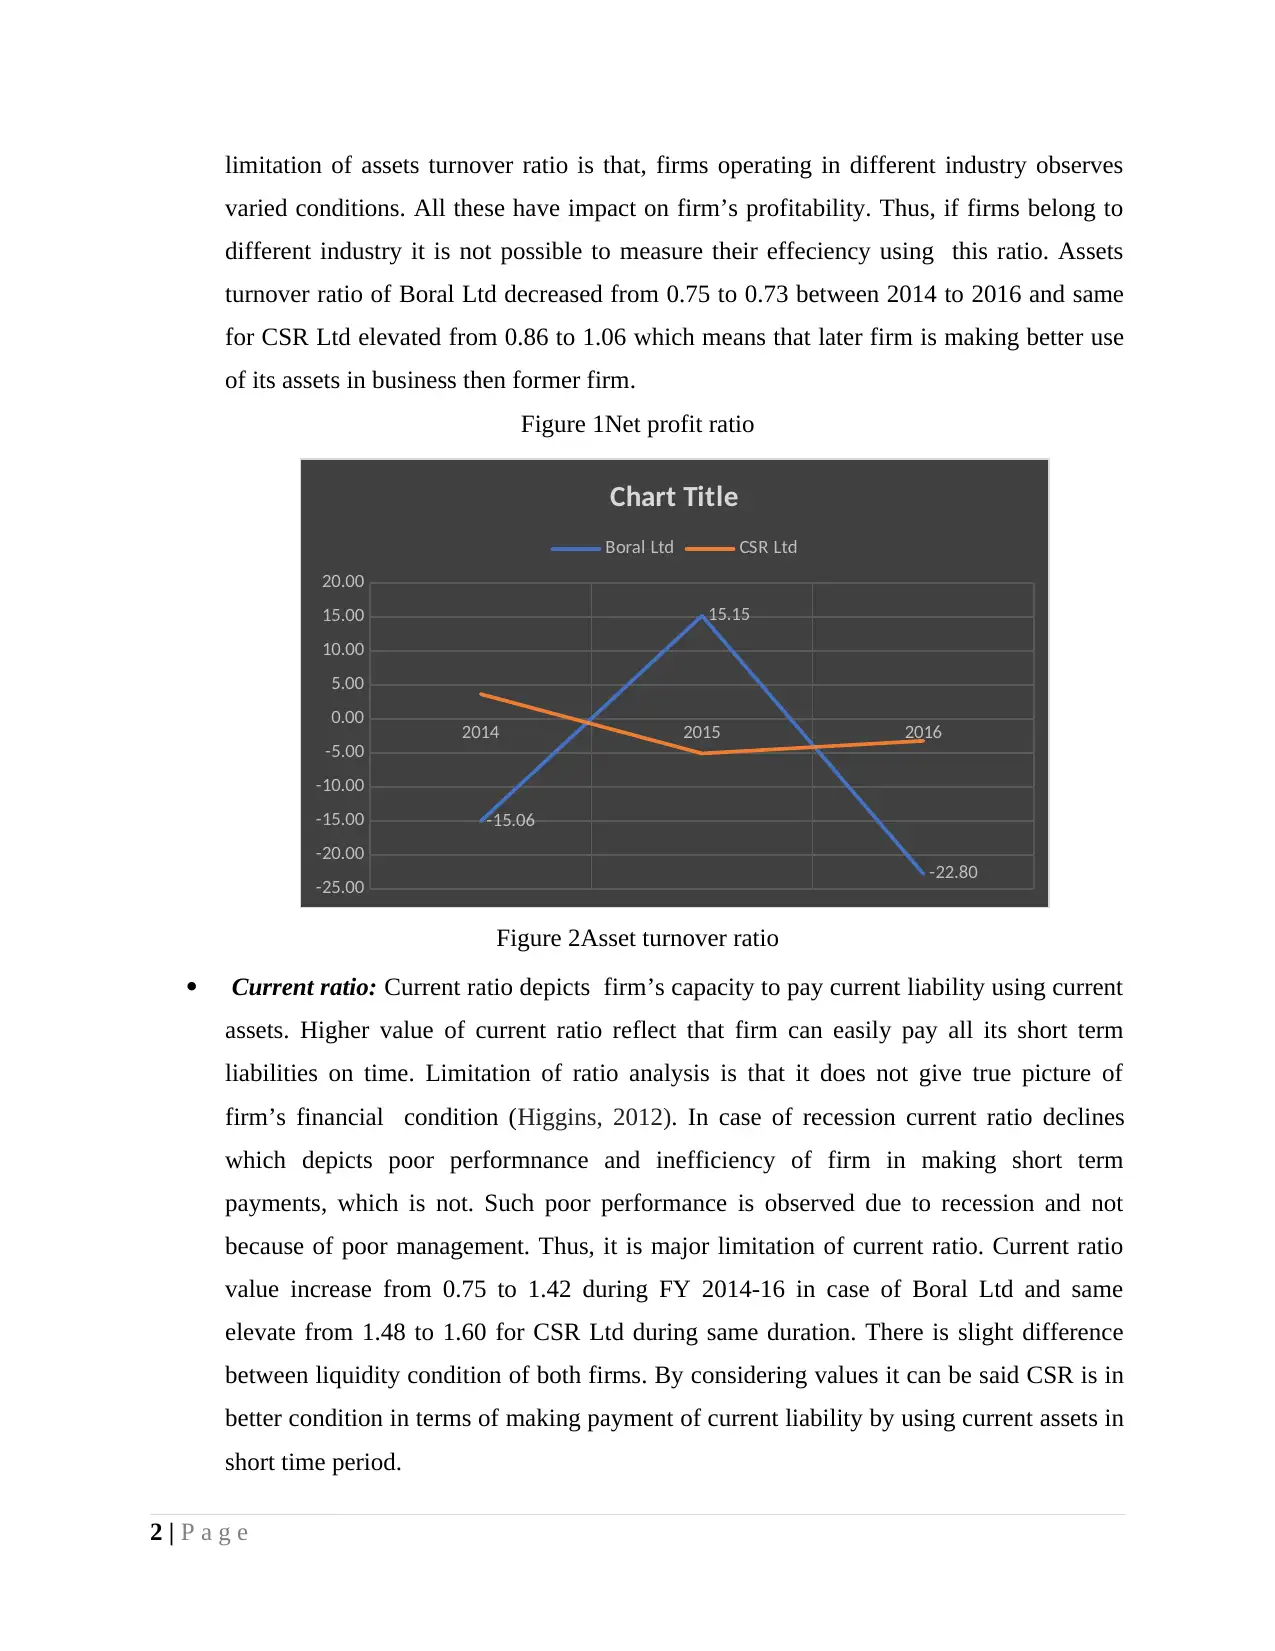
limitation of assets turnover ratio is that, firms operating in different industry observes
varied conditions. All these have impact on firm’s profitability. Thus, if firms belong to
different industry it is not possible to measure their effeciency using this ratio. Assets
turnover ratio of Boral Ltd decreased from 0.75 to 0.73 between 2014 to 2016 and same
for CSR Ltd elevated from 0.86 to 1.06 which means that later firm is making better use
of its assets in business then former firm.
Figure 1Net profit ratio
2014 2015 2016
-25.00
-20.00
-15.00
-10.00
-5.00
0.00
5.00
10.00
15.00
20.00
-15.06
15.15
-22.80
Chart Title
Boral Ltd CSR Ltd
Figure 2Asset turnover ratio
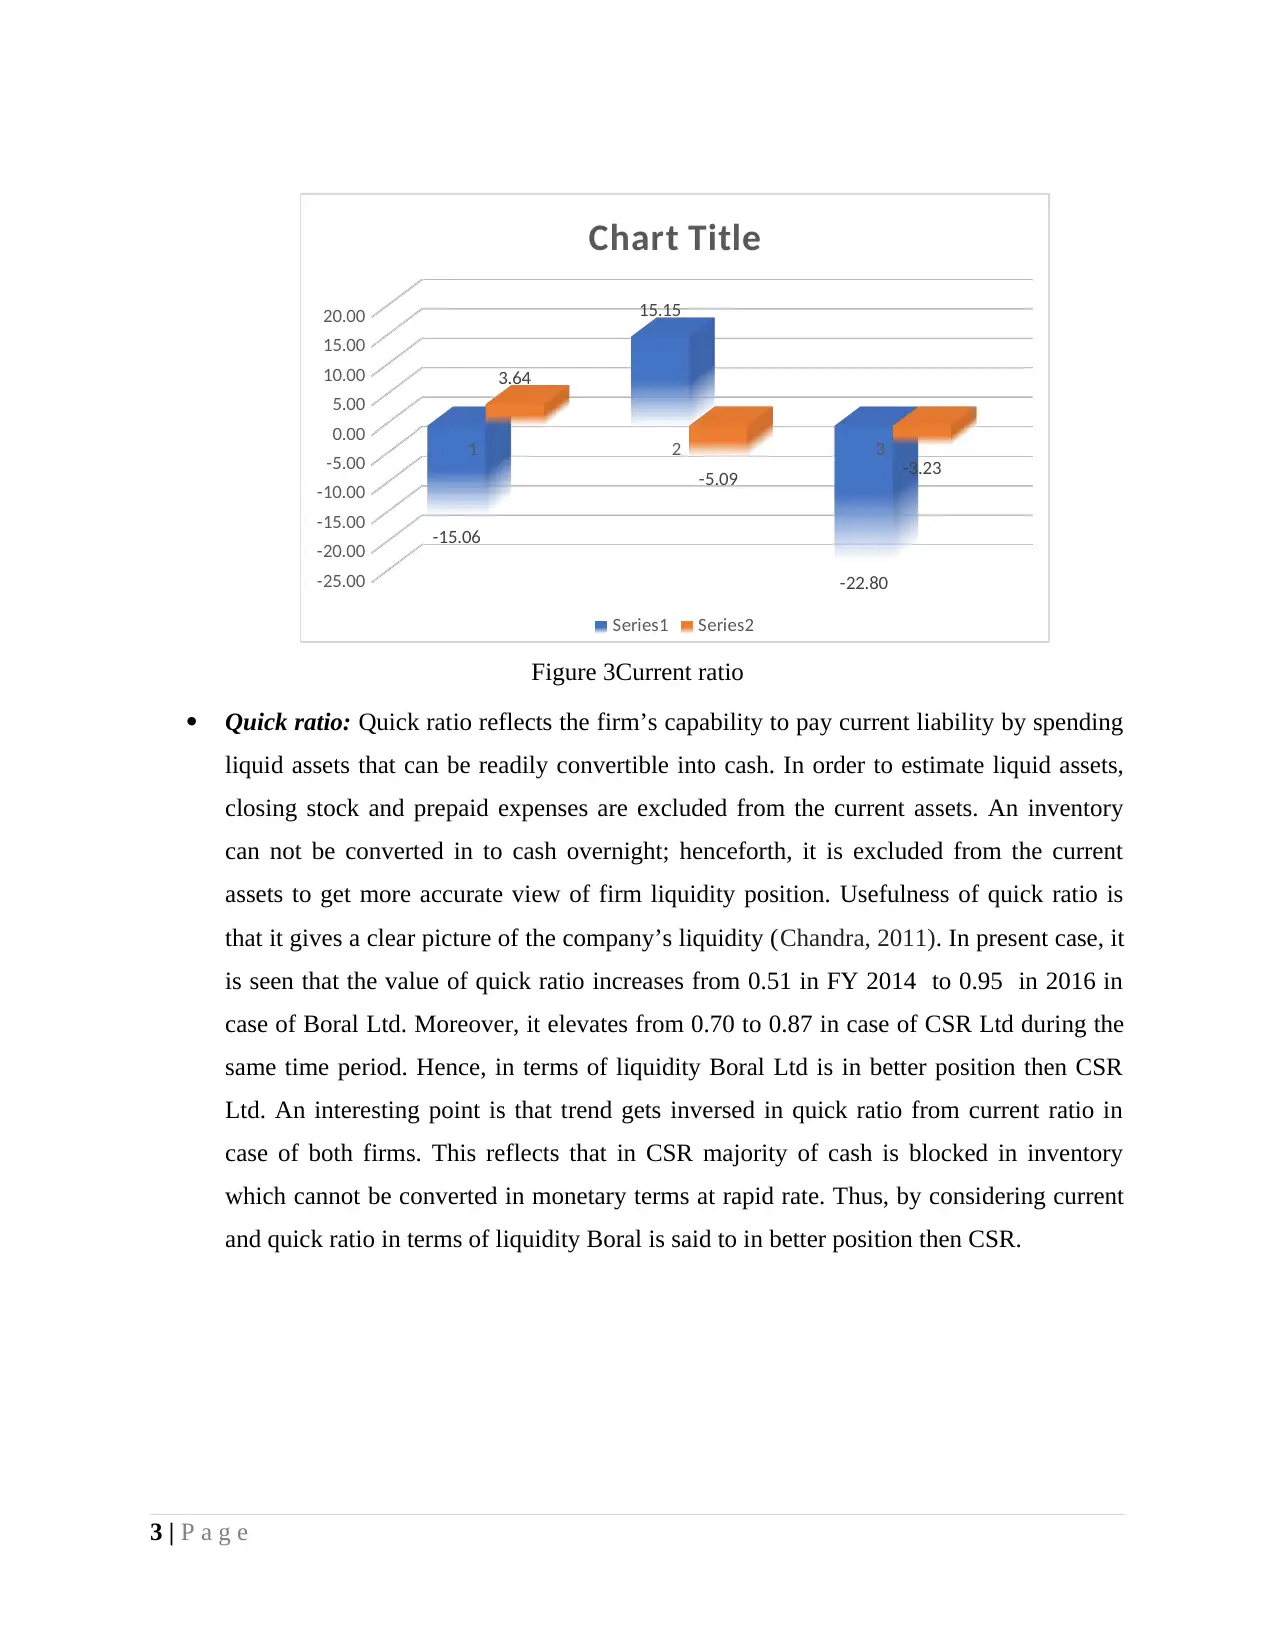
Current ratio: Current ratio depicts firm’s capacity to pay current liability using current
assets. Higher value of current ratio reflect that firm can easily pay all its short term
liabilities on time. Limitation of ratio analysis is that it does not give true picture of
firm’s financial condition (Higgins, 2012). In case of recession current ratio declines
which depicts poor performnance and inefficiency of firm in making short term
payments, which is not. Such poor performance is observed due to recession and not
because of poor management. Thus, it is major limitation of current ratio. Current ratio
value increase from 0.75 to 1.42 during FY 2014-16 in case of Boral Ltd and same
elevate from 1.48 to 1.60 for CSR Ltd during same duration. There is slight difference
between liquidity condition of both firms. By considering values it can be said CSR is in
better condition in terms of making payment of current liability by using current assets in
short time period.
2 | P a g e
varied conditions. All these have impact on firm’s profitability. Thus, if firms belong to
different industry it is not possible to measure their effeciency using this ratio. Assets
turnover ratio of Boral Ltd decreased from 0.75 to 0.73 between 2014 to 2016 and same
for CSR Ltd elevated from 0.86 to 1.06 which means that later firm is making better use
of its assets in business then former firm.
Figure 1Net profit ratio
2014 2015 2016
-25.00
-20.00
-15.00
-10.00
-5.00
0.00
5.00
10.00
15.00
20.00
-15.06
15.15
-22.80
Chart Title
Boral Ltd CSR Ltd
Figure 2Asset turnover ratio
Current ratio: Current ratio depicts firm’s capacity to pay current liability using current
assets. Higher value of current ratio reflect that firm can easily pay all its short term
liabilities on time. Limitation of ratio analysis is that it does not give true picture of
firm’s financial condition (Higgins, 2012). In case of recession current ratio declines
which depicts poor performnance and inefficiency of firm in making short term
payments, which is not. Such poor performance is observed due to recession and not
because of poor management. Thus, it is major limitation of current ratio. Current ratio
value increase from 0.75 to 1.42 during FY 2014-16 in case of Boral Ltd and same
elevate from 1.48 to 1.60 for CSR Ltd during same duration. There is slight difference
between liquidity condition of both firms. By considering values it can be said CSR is in
better condition in terms of making payment of current liability by using current assets in
short time period.
2 | P a g e
Paraphrase This Document
Need a fresh take? Get an instant paraphrase of this document with our AI Paraphraser
1 2 3
-25.00
-20.00
-15.00
-10.00
-5.00
0.00
5.00
10.00
15.00
20.00
-15.06
15.15
-22.80
3.64
-5.09 -3.23
Chart Title
Series1 Series2
Figure 3Current ratio
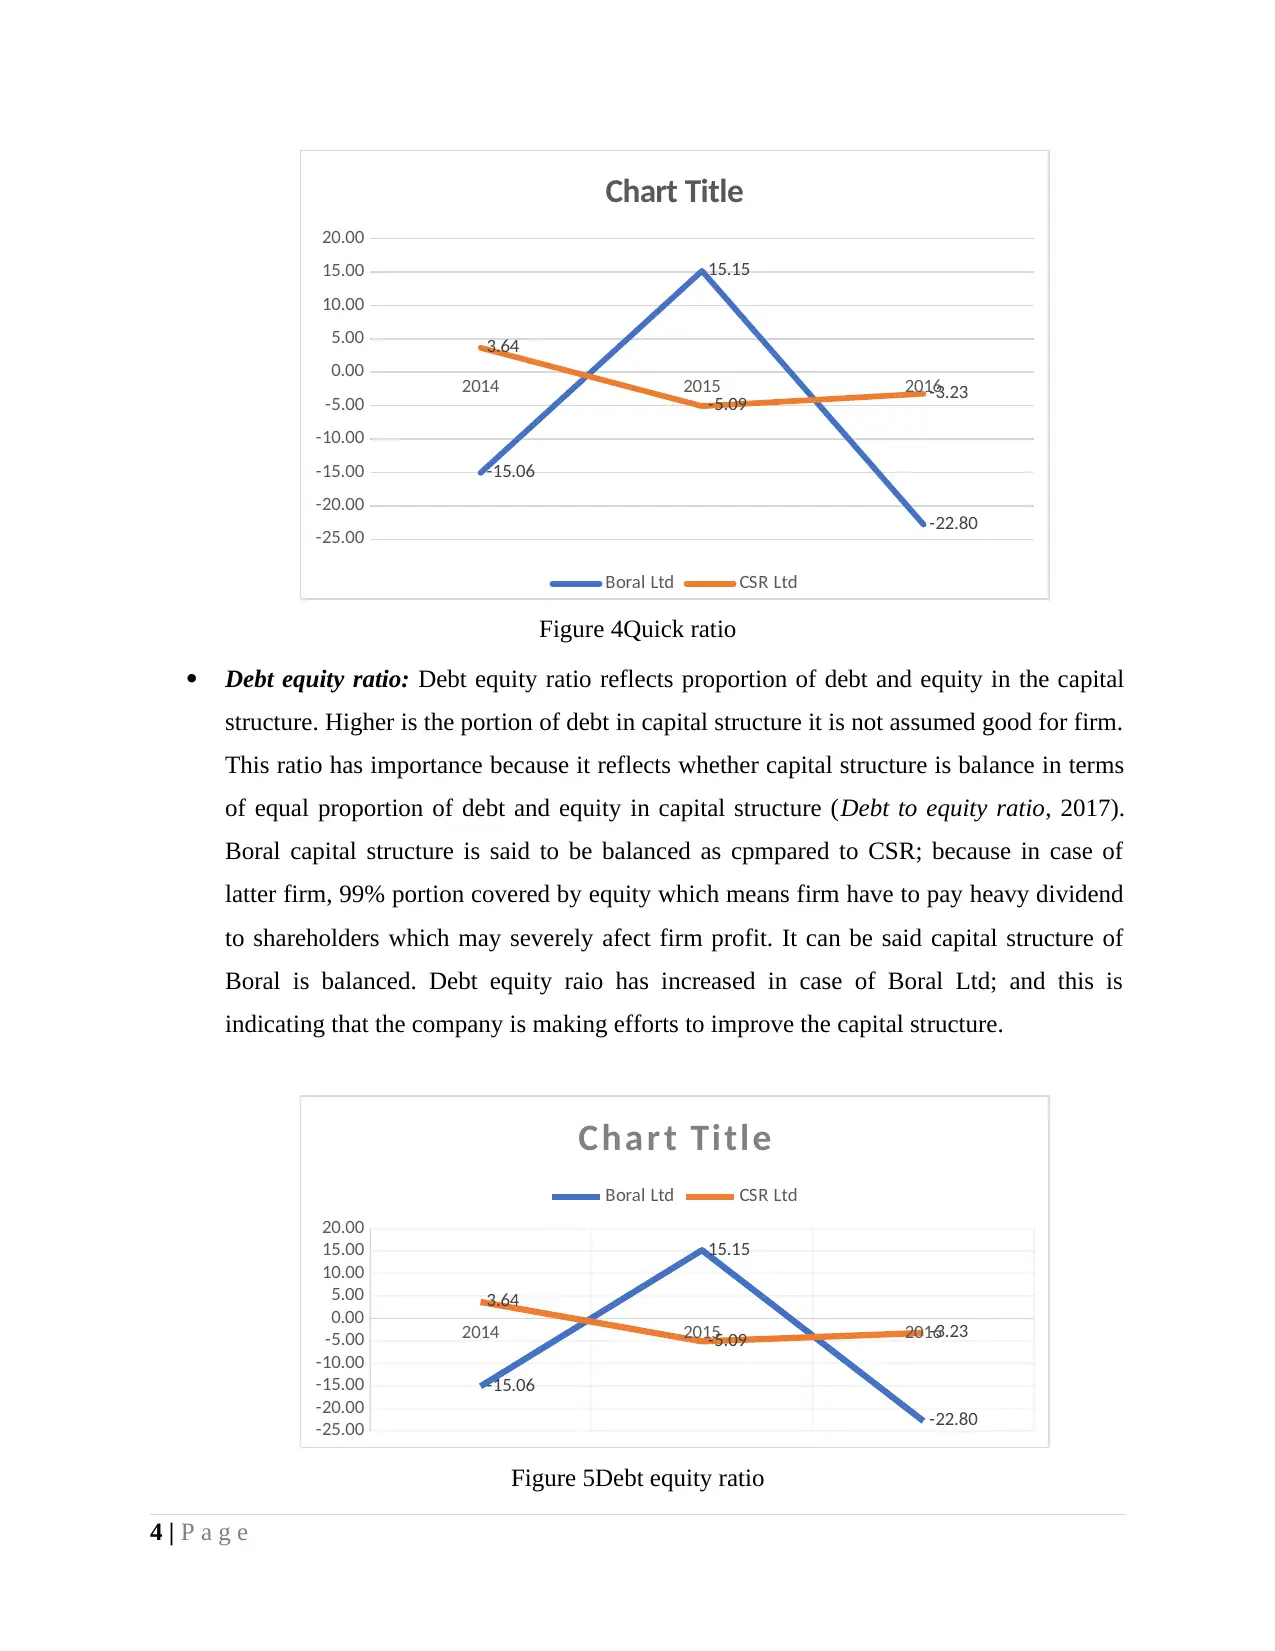
Quick ratio: Quick ratio reflects the firm’s capability to pay current liability by spending
liquid assets that can be readily convertible into cash. In order to estimate liquid assets,
closing stock and prepaid expenses are excluded from the current assets. An inventory
can not be converted in to cash overnight; henceforth, it is excluded from the current
assets to get more accurate view of firm liquidity position. Usefulness of quick ratio is
that it gives a clear picture of the company’s liquidity (Chandra, 2011). In present case, it
is seen that the value of quick ratio increases from 0.51 in FY 2014 to 0.95 in 2016 in
case of Boral Ltd. Moreover, it elevates from 0.70 to 0.87 in case of CSR Ltd during the
same time period. Hence, in terms of liquidity Boral Ltd is in better position then CSR
Ltd. An interesting point is that trend gets inversed in quick ratio from current ratio in
case of both firms. This reflects that in CSR majority of cash is blocked in inventory
which cannot be converted in monetary terms at rapid rate. Thus, by considering current
and quick ratio in terms of liquidity Boral is said to in better position then CSR.
3 | P a g e
-25.00
-20.00
-15.00
-10.00
-5.00
0.00
5.00
10.00
15.00
20.00
-15.06
15.15
-22.80
3.64
-5.09 -3.23
Chart Title
Series1 Series2
Figure 3Current ratio
Quick ratio: Quick ratio reflects the firm’s capability to pay current liability by spending
liquid assets that can be readily convertible into cash. In order to estimate liquid assets,
closing stock and prepaid expenses are excluded from the current assets. An inventory
can not be converted in to cash overnight; henceforth, it is excluded from the current
assets to get more accurate view of firm liquidity position. Usefulness of quick ratio is
that it gives a clear picture of the company’s liquidity (Chandra, 2011). In present case, it
is seen that the value of quick ratio increases from 0.51 in FY 2014 to 0.95 in 2016 in
case of Boral Ltd. Moreover, it elevates from 0.70 to 0.87 in case of CSR Ltd during the
same time period. Hence, in terms of liquidity Boral Ltd is in better position then CSR
Ltd. An interesting point is that trend gets inversed in quick ratio from current ratio in
case of both firms. This reflects that in CSR majority of cash is blocked in inventory
which cannot be converted in monetary terms at rapid rate. Thus, by considering current
and quick ratio in terms of liquidity Boral is said to in better position then CSR.
3 | P a g e
2014 2015 2016
-25.00
-20.00
-15.00
-10.00
-5.00
0.00
5.00
10.00
15.00
20.00
-15.06
15.15
-22.80
3.64
-5.09 -3.23
Chart Title
Boral Ltd CSR Ltd
Figure 4Quick ratio
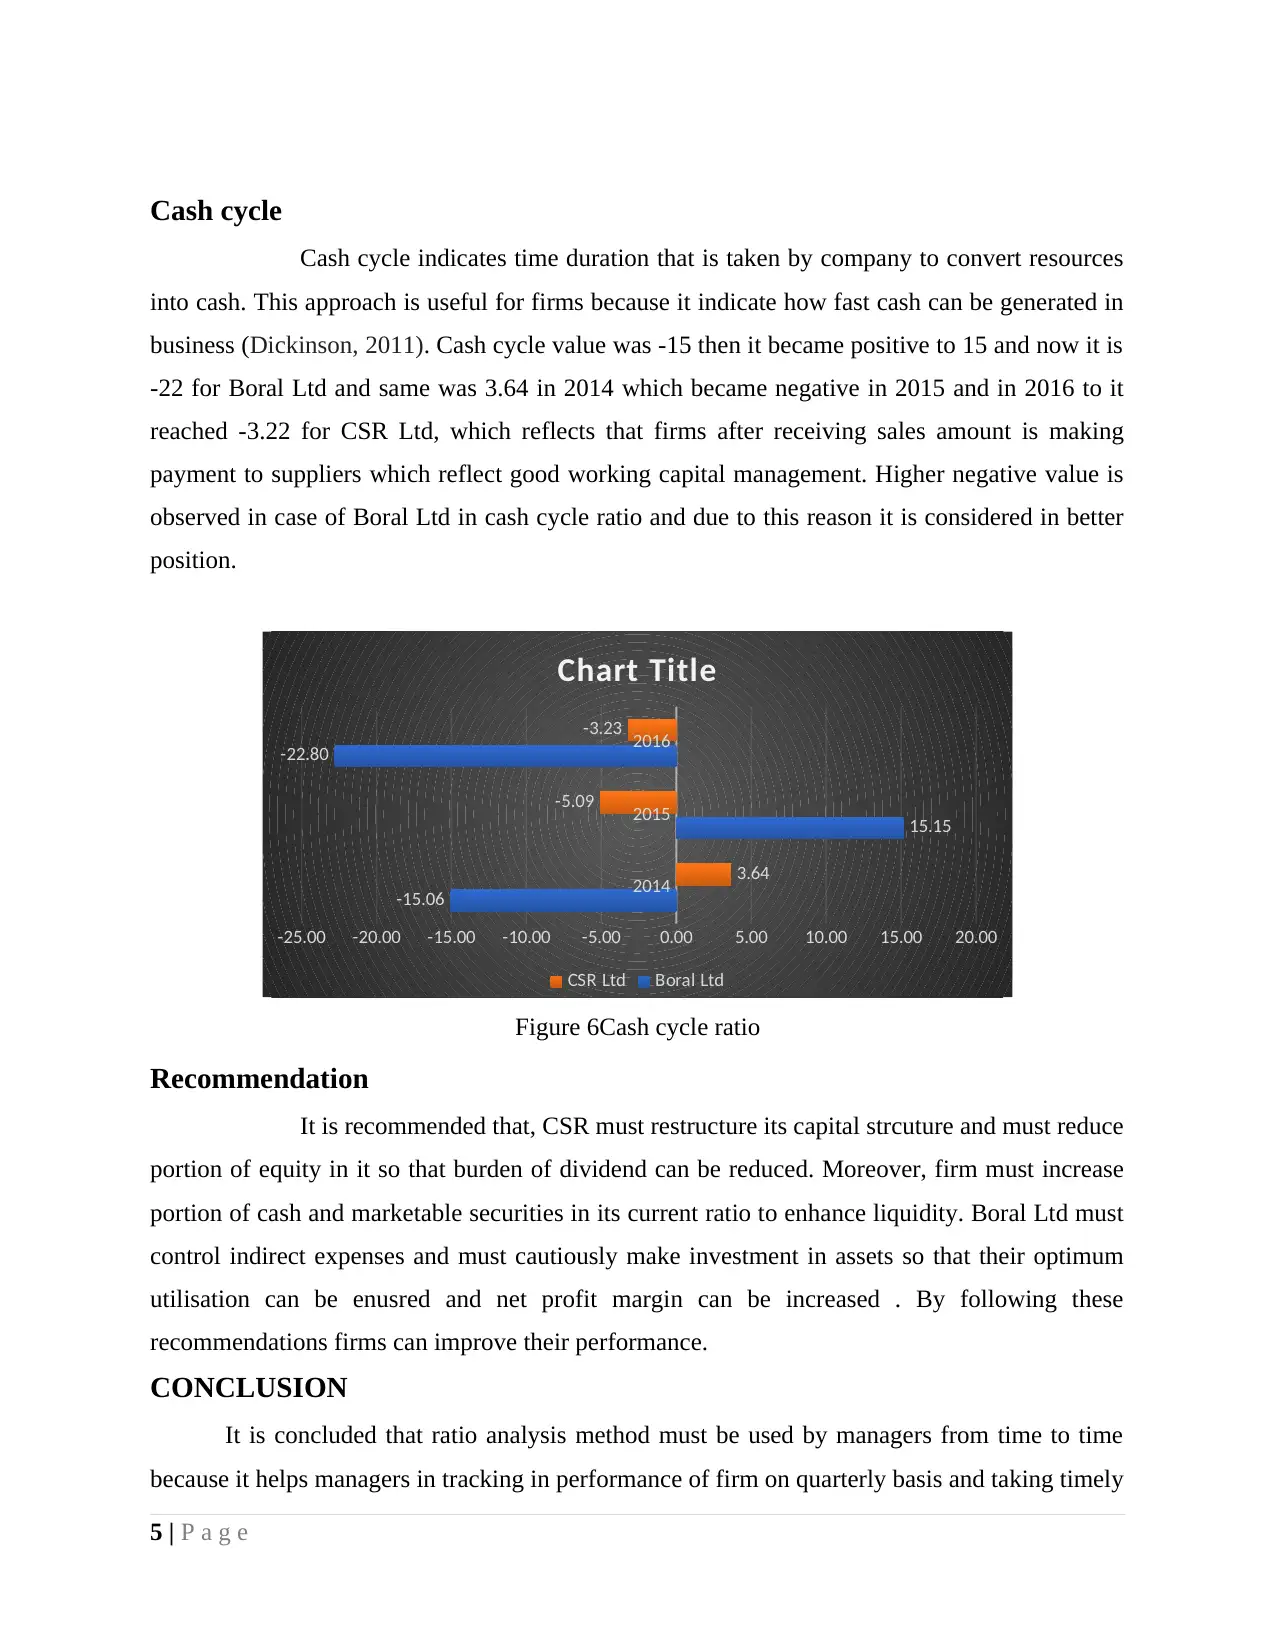
Debt equity ratio: Debt equity ratio reflects proportion of debt and equity in the capital
structure. Higher is the portion of debt in capital structure it is not assumed good for firm.
This ratio has importance because it reflects whether capital structure is balance in terms
of equal proportion of debt and equity in capital structure (Debt to equity ratio, 2017).
Boral capital structure is said to be balanced as cpmpared to CSR; because in case of
latter firm, 99% portion covered by equity which means firm have to pay heavy dividend
to shareholders which may severely afect firm profit. It can be said capital structure of
Boral is balanced. Debt equity raio has increased in case of Boral Ltd; and this is
indicating that the company is making efforts to improve the capital structure.
2014 2015 2016
-25.00
-20.00
-15.00
-10.00
-5.00
0.00
5.00
10.00
15.00
20.00
-15.06
15.15
-22.80
3.64
-5.09 -3.23
Char t Title
Boral Ltd CSR Ltd
Figure 5Debt equity ratio
4 | P a g e
-25.00
-20.00
-15.00
-10.00
-5.00
0.00
5.00
10.00
15.00
20.00
-15.06
15.15
-22.80
3.64
-5.09 -3.23
Chart Title
Boral Ltd CSR Ltd
Figure 4Quick ratio
Debt equity ratio: Debt equity ratio reflects proportion of debt and equity in the capital
structure. Higher is the portion of debt in capital structure it is not assumed good for firm.
This ratio has importance because it reflects whether capital structure is balance in terms
of equal proportion of debt and equity in capital structure (Debt to equity ratio, 2017).
Boral capital structure is said to be balanced as cpmpared to CSR; because in case of
latter firm, 99% portion covered by equity which means firm have to pay heavy dividend
to shareholders which may severely afect firm profit. It can be said capital structure of
Boral is balanced. Debt equity raio has increased in case of Boral Ltd; and this is
indicating that the company is making efforts to improve the capital structure.
2014 2015 2016
-25.00
-20.00
-15.00
-10.00
-5.00
0.00
5.00
10.00
15.00
20.00
-15.06
15.15
-22.80
3.64
-5.09 -3.23
Char t Title
Boral Ltd CSR Ltd
Figure 5Debt equity ratio
4 | P a g e
⊘ This is a preview!⊘
Do you want full access?
Subscribe today to unlock all pages.
Trusted by 1+ million students worldwide
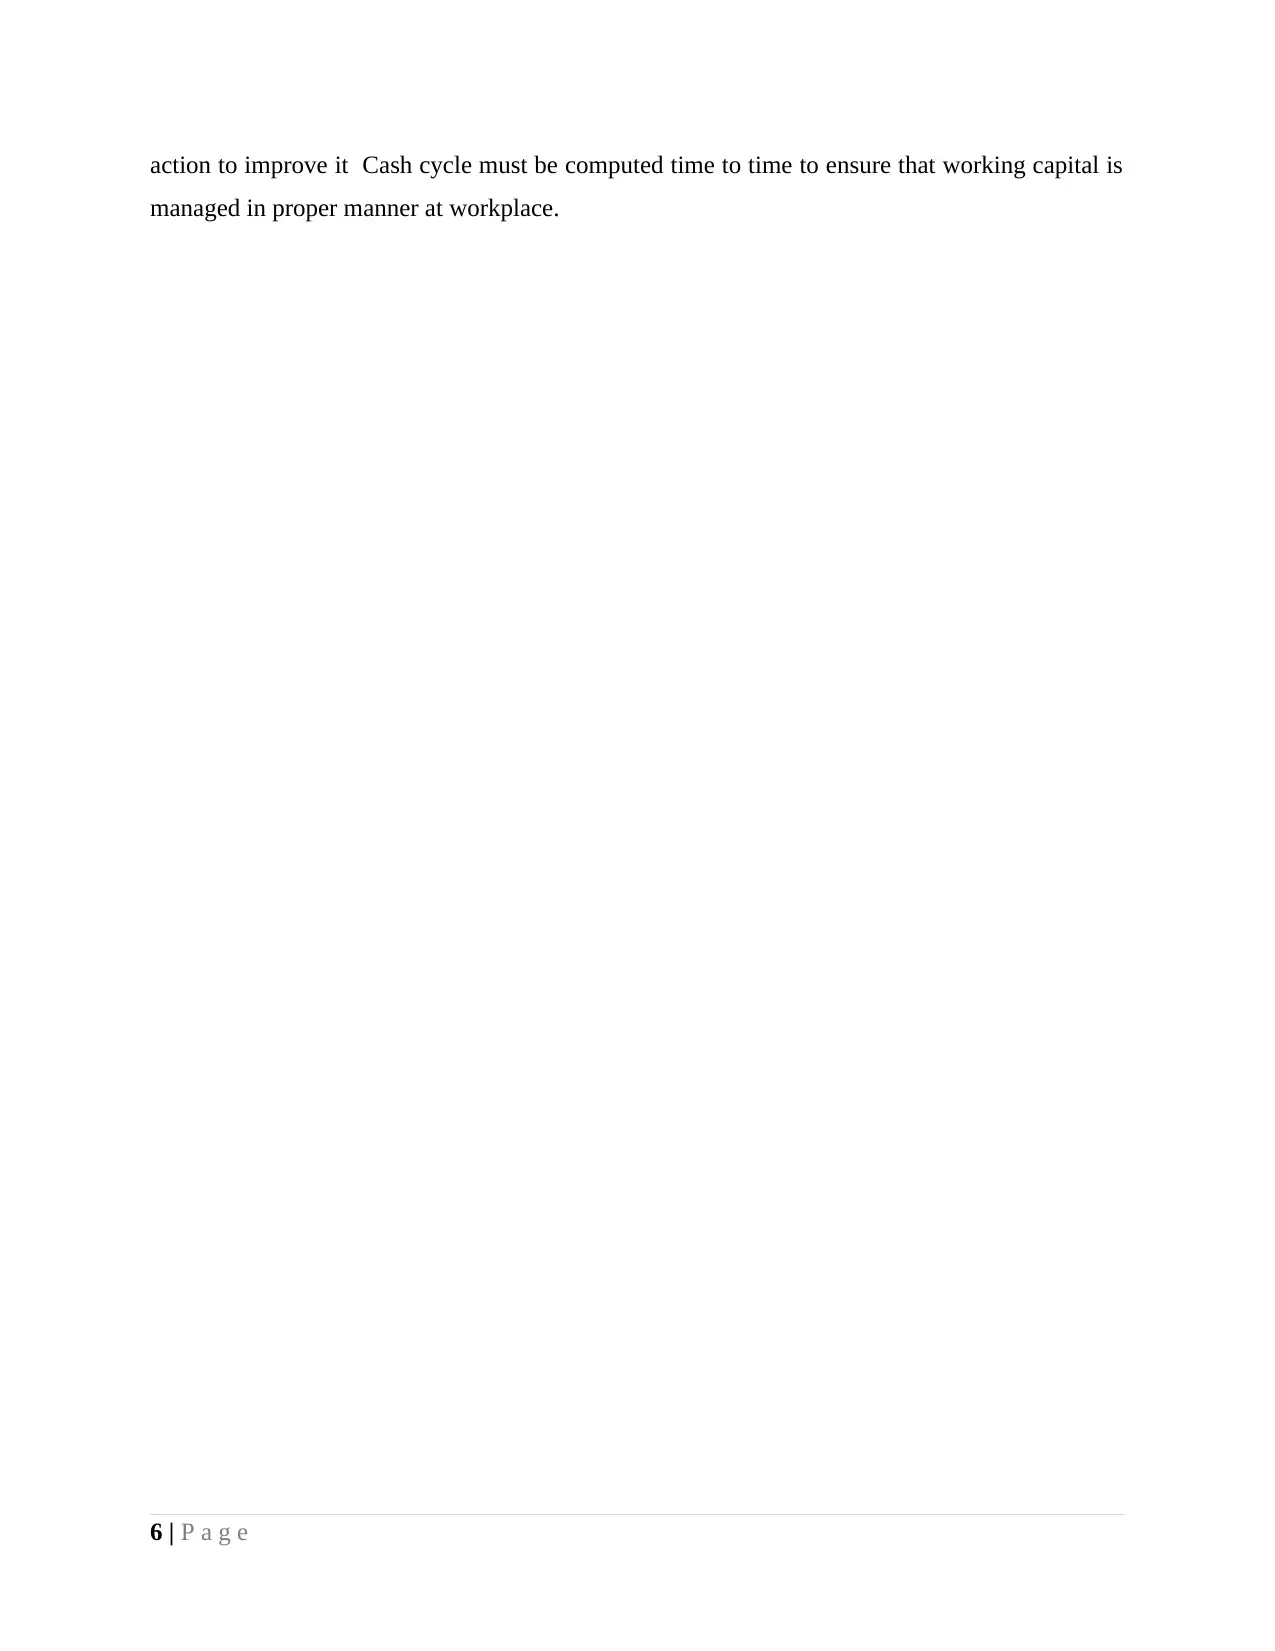
Cash cycle
Cash cycle indicates time duration that is taken by company to convert resources
into cash. This approach is useful for firms because it indicate how fast cash can be generated in
business (Dickinson, 2011). Cash cycle value was -15 then it became positive to 15 and now it is
-22 for Boral Ltd and same was 3.64 in 2014 which became negative in 2015 and in 2016 to it
reached -3.22 for CSR Ltd, which reflects that firms after receiving sales amount is making
payment to suppliers which reflect good working capital management. Higher negative value is
observed in case of Boral Ltd in cash cycle ratio and due to this reason it is considered in better
position.
2014
2015
2016
-25.00 -20.00 -15.00 -10.00 -5.00 0.00 5.00 10.00 15.00 20.00
-15.06
15.15
-22.80
3.64
-5.09
-3.23
Chart Title
CSR Ltd Boral Ltd
Figure 6Cash cycle ratio
Recommendation
It is recommended that, CSR must restructure its capital strcuture and must reduce
portion of equity in it so that burden of dividend can be reduced. Moreover, firm must increase
portion of cash and marketable securities in its current ratio to enhance liquidity. Boral Ltd must
control indirect expenses and must cautiously make investment in assets so that their optimum
utilisation can be enusred and net profit margin can be increased . By following these
recommendations firms can improve their performance.
CONCLUSION
It is concluded that ratio analysis method must be used by managers from time to time
because it helps managers in tracking in performance of firm on quarterly basis and taking timely
5 | P a g e
Paraphrase This Document
Need a fresh take? Get an instant paraphrase of this document with our AI Paraphraser
action to improve it Cash cycle must be computed time to time to ensure that working capital is
managed in proper manner at workplace.
6 | P a g e
managed in proper manner at workplace.
6 | P a g e
REFERENCES
Books and Journals
Chandra, P., 2011. Financial management. Tata McGraw-Hill Education.
Dickinson, V., 2011. Cash flow patterns as a proxy for firm life cycle. The Accounting
Review. 86(6), pp.1969-1994.
Higgins, R.C., 2012. Analysis for financial management. McGraw-Hill/Irwin.
Kumbirai, M., 2010. A financial ratio analysis of commercial bank performance in South
Africa. African Review of Economics and Finance. 2(1), pp.30-53.
Online
Assets turnover ratio, 2017. [Online]. Available through:<
http://www.myaccountingcourse.com/financial-ratios/asset-turnover-ratio>. [Accessed on
30th August 2017].
Debt to equity ratio, 2017. [Online]. Available through:<
<http://www.myaccountingcourse.com/financial-ratios/debt-to-equity-ratio>. [Accessed on
30th August 2017].
7 | P a g e
⊘ This is a preview!⊘
Do you want full access?
Subscribe today to unlock all pages.
Trusted by 1+ million students worldwide
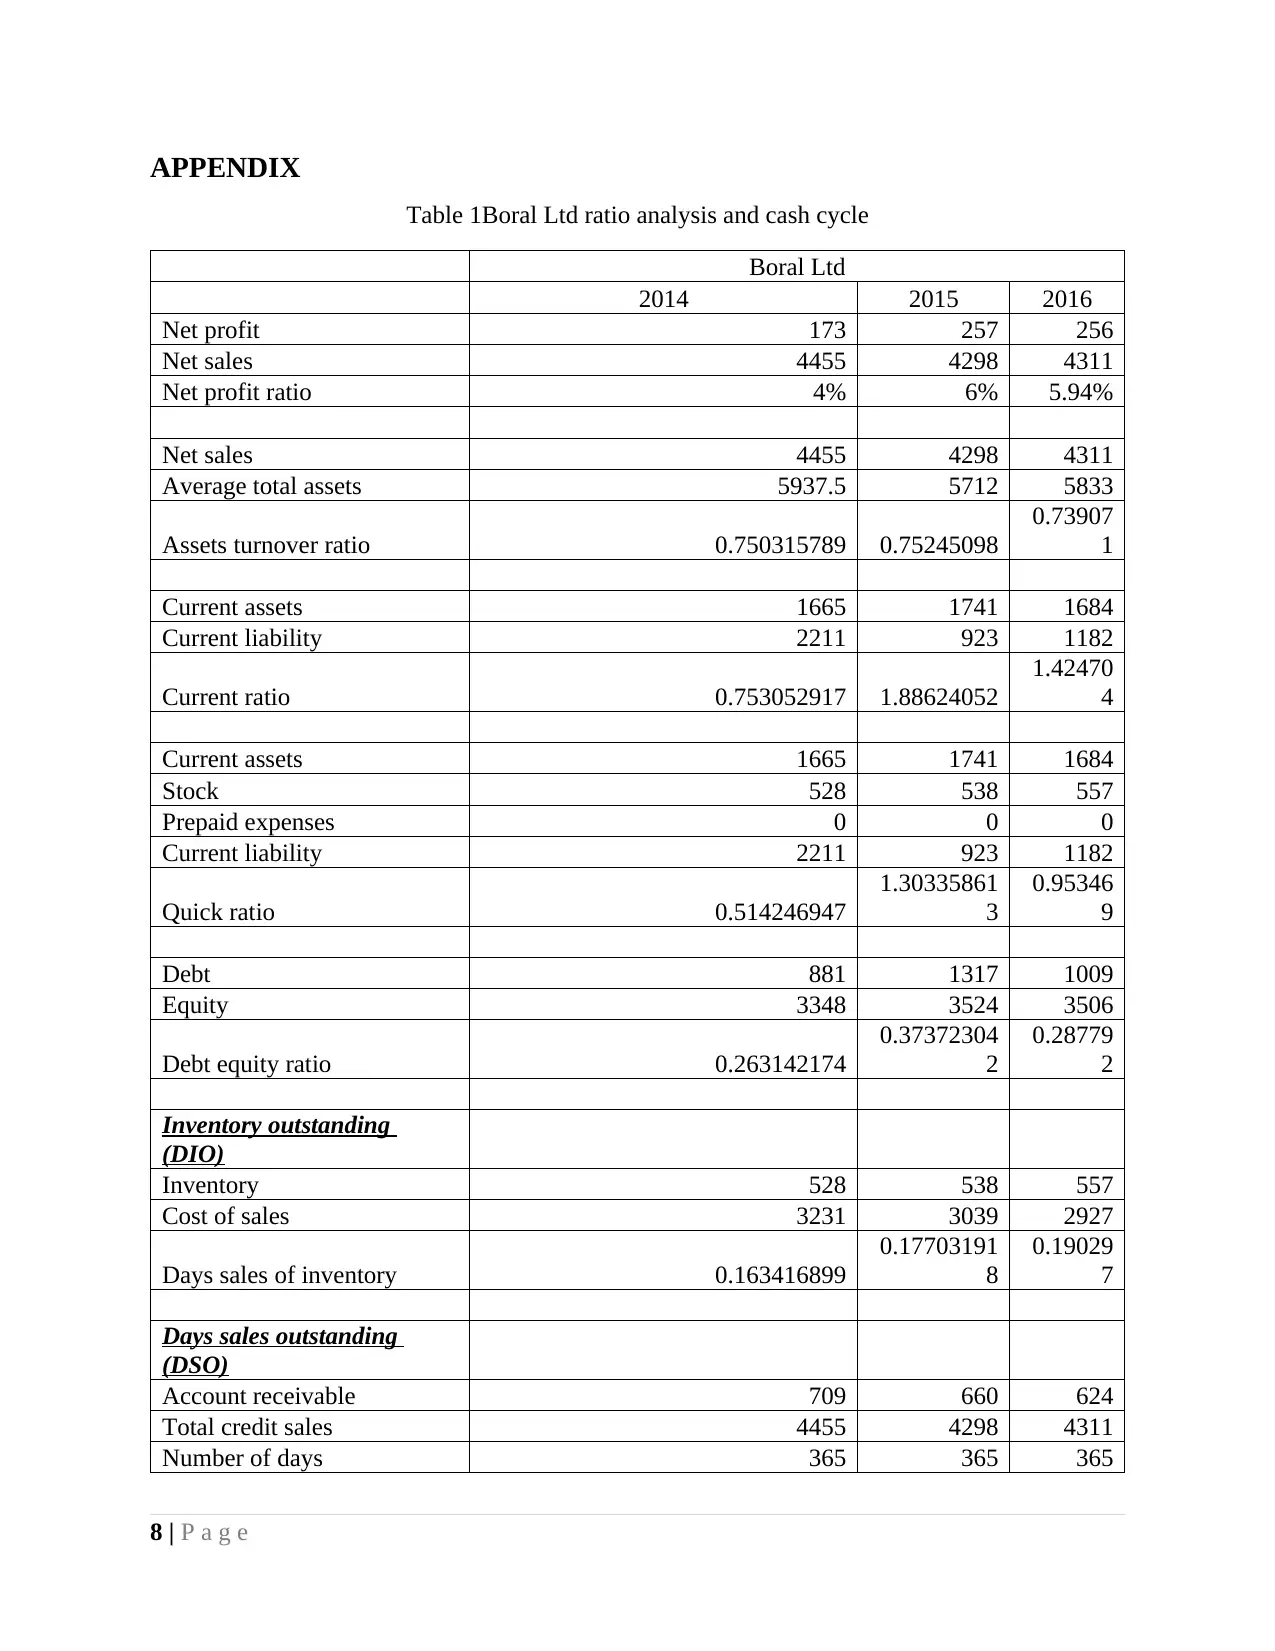
APPENDIX
Table 1Boral Ltd ratio analysis and cash cycle
Boral Ltd
2014 2015 2016
Net profit 173 257 256
Net sales 4455 4298 4311
Net profit ratio 4% 6% 5.94%
Net sales 4455 4298 4311
Average total assets 5937.5 5712 5833
Assets turnover ratio 0.750315789 0.75245098
0.73907
1
Current assets 1665 1741 1684
Current liability 2211 923 1182
Current ratio 0.753052917 1.88624052
1.42470
4
Current assets 1665 1741 1684
Stock 528 538 557
Prepaid expenses 0 0 0
Current liability 2211 923 1182
Quick ratio 0.514246947
1.30335861
3
0.95346
9
Debt 881 1317 1009
Equity 3348 3524 3506
Debt equity ratio 0.263142174
0.37372304
2
0.28779
2
Inventory outstanding
(DIO)
Inventory 528 538 557
Cost of sales 3231 3039 2927
Days sales of inventory 0.163416899
0.17703191
8
0.19029
7
Days sales outstanding
(DSO)
Account receivable 709 660 624
Total credit sales 4455 4298 4311
Number of days 365 365 365
8 | P a g e
Paraphrase This Document
Need a fresh take? Get an instant paraphrase of this document with our AI Paraphraser
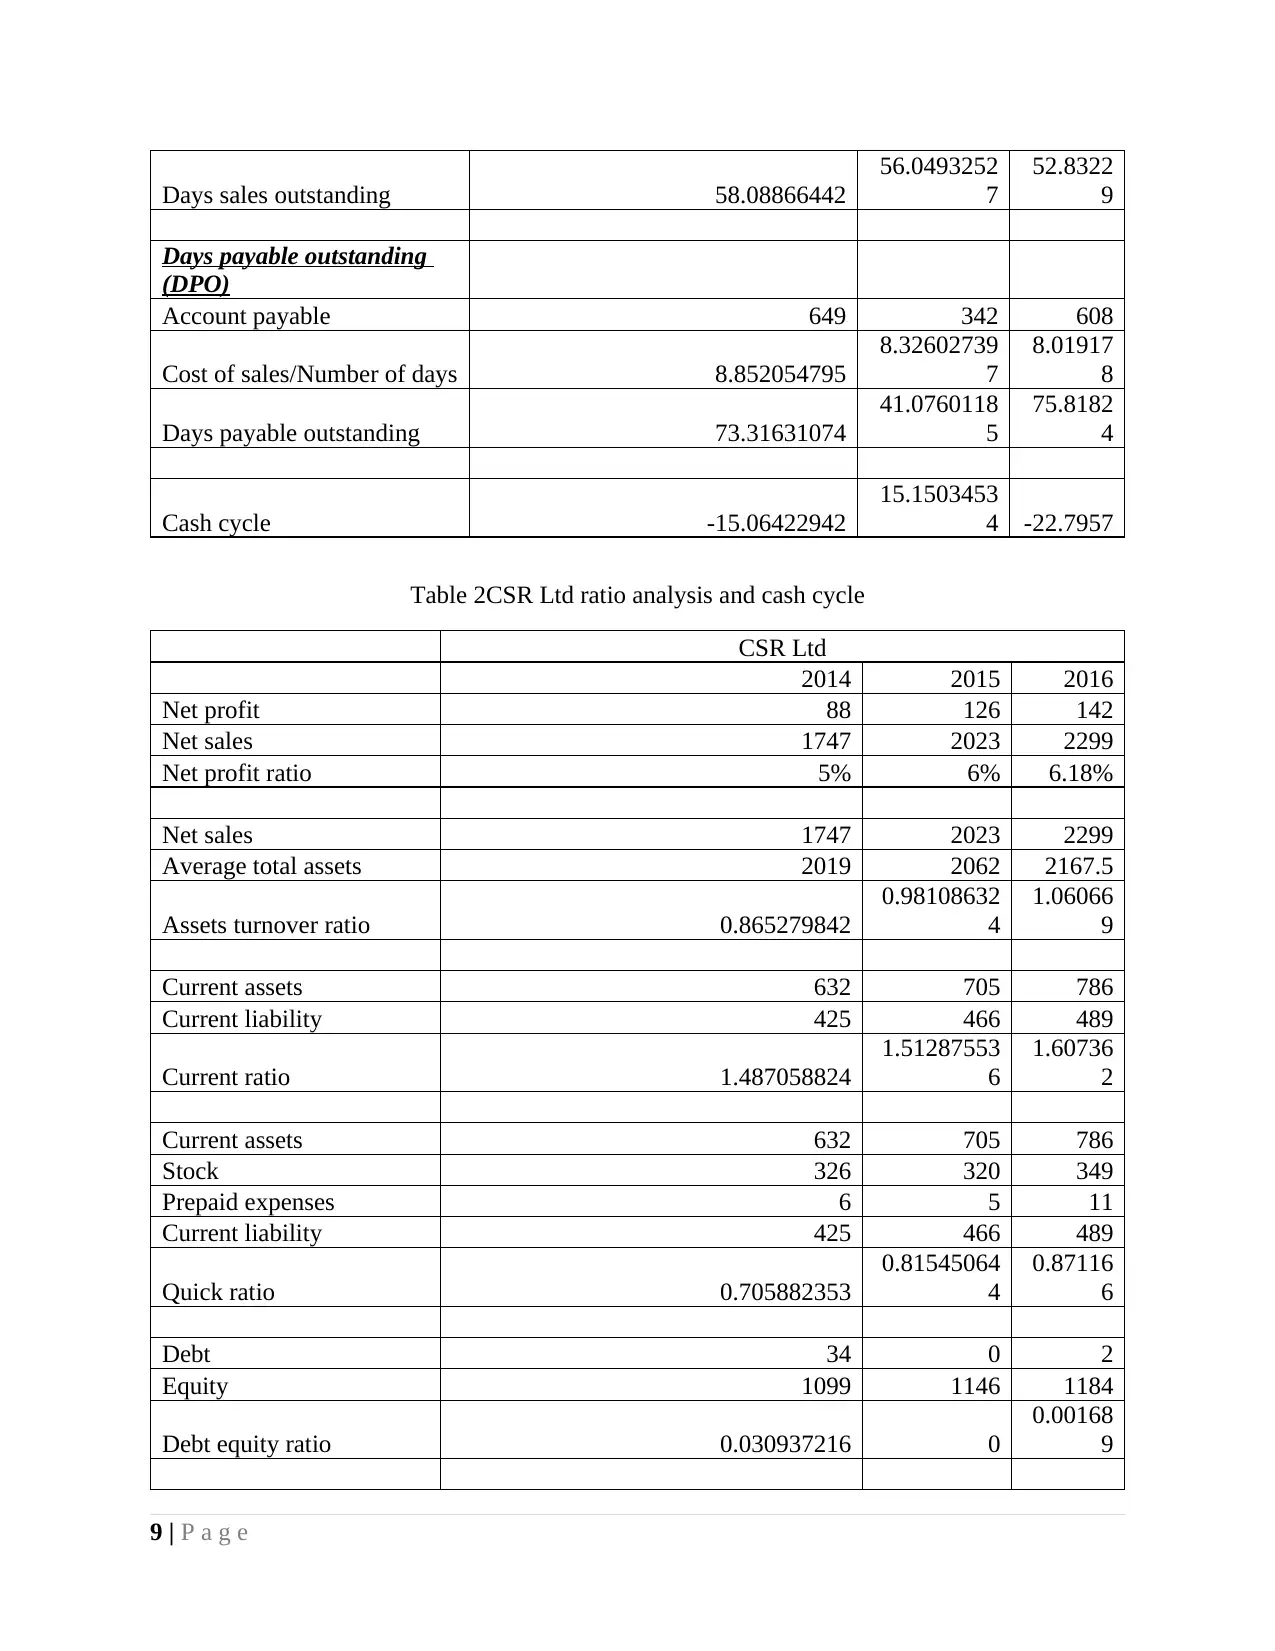
Days sales outstanding 58.08866442
56.0493252
7
52.8322
9
Days payable outstanding
(DPO)
Account payable 649 342 608
Cost of sales/Number of days 8.852054795
8.32602739
7
8.01917
8
Days payable outstanding 73.31631074
41.0760118
5
75.8182
4
Cash cycle -15.06422942
15.1503453
4 -22.7957
Table 2CSR Ltd ratio analysis and cash cycle
CSR Ltd
2014 2015 2016
Net profit 88 126 142
Net sales 1747 2023 2299
Net profit ratio 5% 6% 6.18%
Net sales 1747 2023 2299
Average total assets 2019 2062 2167.5
Assets turnover ratio 0.865279842
0.98108632
4
1.06066
9
Current assets 632 705 786
Current liability 425 466 489
Current ratio 1.487058824
1.51287553
6
1.60736
2
Current assets 632 705 786
Stock 326 320 349
Prepaid expenses 6 5 11
Current liability 425 466 489
Quick ratio 0.705882353
0.81545064
4
0.87116
6
Debt 34 0 2
Equity 1099 1146 1184
Debt equity ratio 0.030937216 0
0.00168
9
9 | P a g e
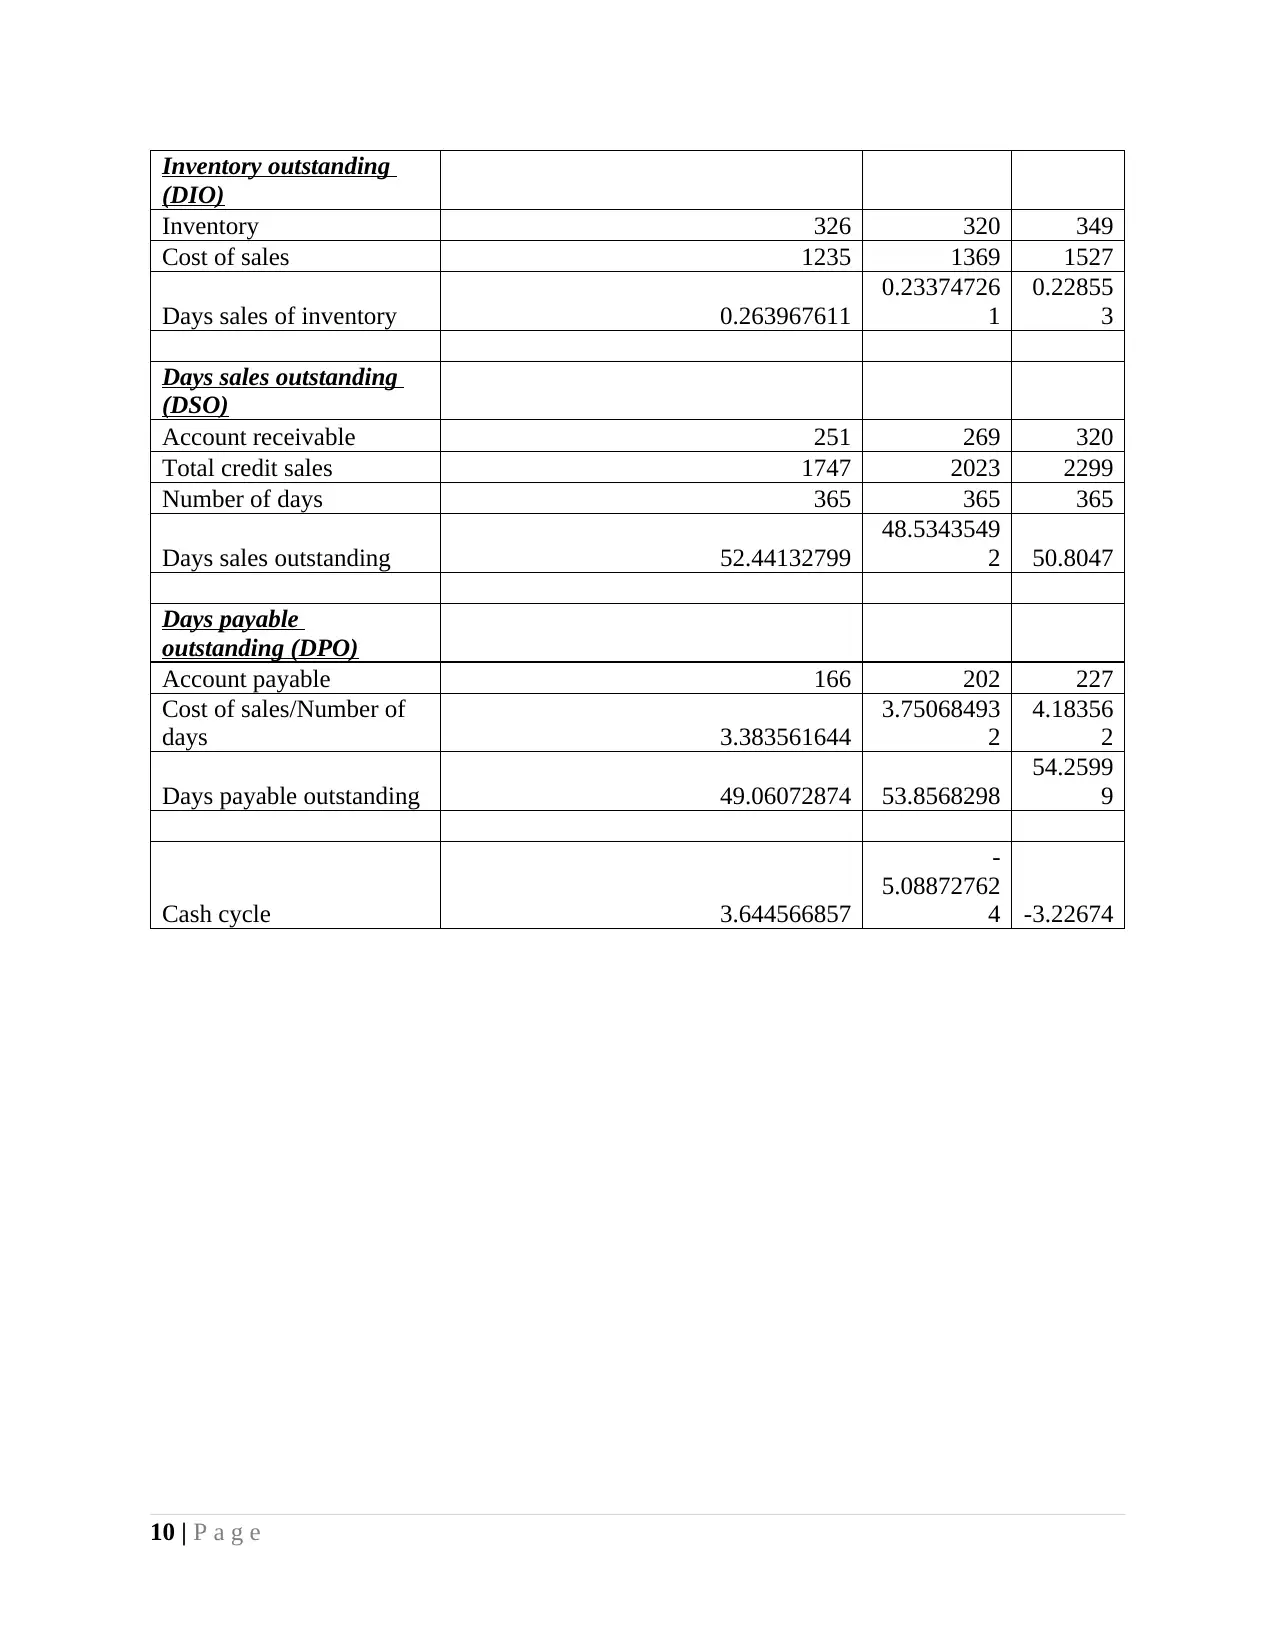
Inventory outstanding
(DIO)
Inventory 326 320 349
Cost of sales 1235 1369 1527
Days sales of inventory 0.263967611
0.23374726
1
0.22855
3
Days sales outstanding
(DSO)
Account receivable 251 269 320
Total credit sales 1747 2023 2299
Number of days 365 365 365
Days sales outstanding 52.44132799
48.5343549
2 50.8047
Days payable
outstanding (DPO)
Account payable 166 202 227
Cost of sales/Number of
days 3.383561644
3.75068493
2
4.18356
2
Days payable outstanding 49.06072874 53.8568298
54.2599
9
Cash cycle 3.644566857
-
5.08872762
4 -3.22674
10 | P a g e
⊘ This is a preview!⊘
Do you want full access?
Subscribe today to unlock all pages.
Trusted by 1+ million students worldwide
1 out of 12
Related Documents


Your All-in-One AI-Powered Toolkit for Academic Success.
+13062052269
info@desklib.com
Available 24*7 on WhatsApp / Email
![[object Object]](/_next/static/media/star-bottom.7253800d.svg)
Unlock your academic potential
Copyright © 2020–2026 A2Z Services. All Rights Reserved. Developed and managed by ZUCOL.