AC4410: In-Depth Financial Ratio Analysis of BP Plc (2014 - 2017)
VerifiedAdded on 2023/04/20
|17
|2614
|71
Report
AI Summary
This report provides a comprehensive financial analysis of BP Plc from 2014 to 2017, utilizing ratio analysis to assess the company's financial performance. It covers profitability ratios (operating profit ratio, gross profit ratio, return on capital employed), liquidity ratios (current ratio, acid test ratio), and activity ratios (trade receivables collection period, trade payables payment period, inventory turnover ratio). The analysis reveals fluctuations in BP's financial health over the years, influenced by factors like oil price changes, operational expansions, and strategic investments. The report concludes that BP experienced significant organizational changes during the analyzed period, driven by its global operations and improved crude oil production, leading to enhanced profitability for shareholders. The document is contributed by a student and available on Desklib, a platform offering study tools and resources for students.
Running head: ACCOUNTS AND FINANCE
Account and Finance
Name of the Student
Name of the University
Authors Note
Course ID
Account and Finance
Name of the Student
Name of the University
Authors Note
Course ID
Paraphrase This Document
Need a fresh take? Get an instant paraphrase of this document with our AI Paraphraser
1ACCOUNTS AND FINANCE
Table of Contents
Company Overview:..................................................................................................................2
Ratio Analysis:...........................................................................................................................2
Use of ratio analysis:..............................................................................................................2
Benefits of ratio analysis:.......................................................................................................3
Limitation of Ratio Analysis:.................................................................................................4
Profitability Ratios:....................................................................................................................4
Operating profit Ratios...........................................................................................................4
Gross Profit Ratio:..................................................................................................................4
Return on Capital Employed:.................................................................................................5
Liquidity Ratios:.........................................................................................................................5
Current Ratios:.......................................................................................................................6
Acid Test Ratio:.....................................................................................................................6
Activity ratios:............................................................................................................................6
Trade receivables collection period:......................................................................................7
Trade payables Payment Period:............................................................................................7
Inventory Turnover Ratio:......................................................................................................8
Conclusion:................................................................................................................................8
References:.................................................................................................................................9
Appendix:.................................................................................................................................10

2ACCOUNTS AND FINANCE
⊘ This is a preview!⊘
Do you want full access?
Subscribe today to unlock all pages.
Trusted by 1+ million students worldwide
3ACCOUNTS AND FINANCE
Company Overview:
BP Plc is the multinational oil company of Britain that has its headquarters in London,
England. BP is regarded as one of the seven oil and gas supermajors and regarded as world’s
sixth largest energy company in terms of the market capitalization (BP global 2018). The
company is vertically integrated that operates in all the areas of oil and gas industry that
includes the exploration and production, purifying, distributing and marketing of
petrochemicals, power production and trading.
BP has the primarily listed on the London Stock Exchange and it is regarded as the
main constituent of FTSE 100 index. The company provides its customers with the
transportation fuel, energy for light and heat, lubricants to keep moving the engines and
petrochemical products that is used to make each day items namely paints, clothes and
packaging. BP has unique partnership with the Rosneft that helps in differentiating the
business from its peers (BP global 2018). BP creates value by seeking evolution in
hydrocarbon resources or divesting them if the resource does not fit with its strategic
priorities.
The chairman of BP also addressed its shareholder by stating that the business had
posted a strong year with $3.4 bn profit is attributable to the shareholders of BP (BP global
2018). The strong profitability of company enabled giving dividends of 10 cents per ordinary
share in 2017 where shareholders can still take the dividends in the shares instead of cash.
Ratio Analysis:
Use of ratio analysis:
The financial ratio is aimed at assessing the financial performance of the business and
ascertaining the financial position of the company with the help of profitability, liquidity,
activity and leverage. The financial ratios are helpful in assessing the performance of
Paraphrase This Document
Need a fresh take? Get an instant paraphrase of this document with our AI Paraphraser
4ACCOUNTS AND FINANCE
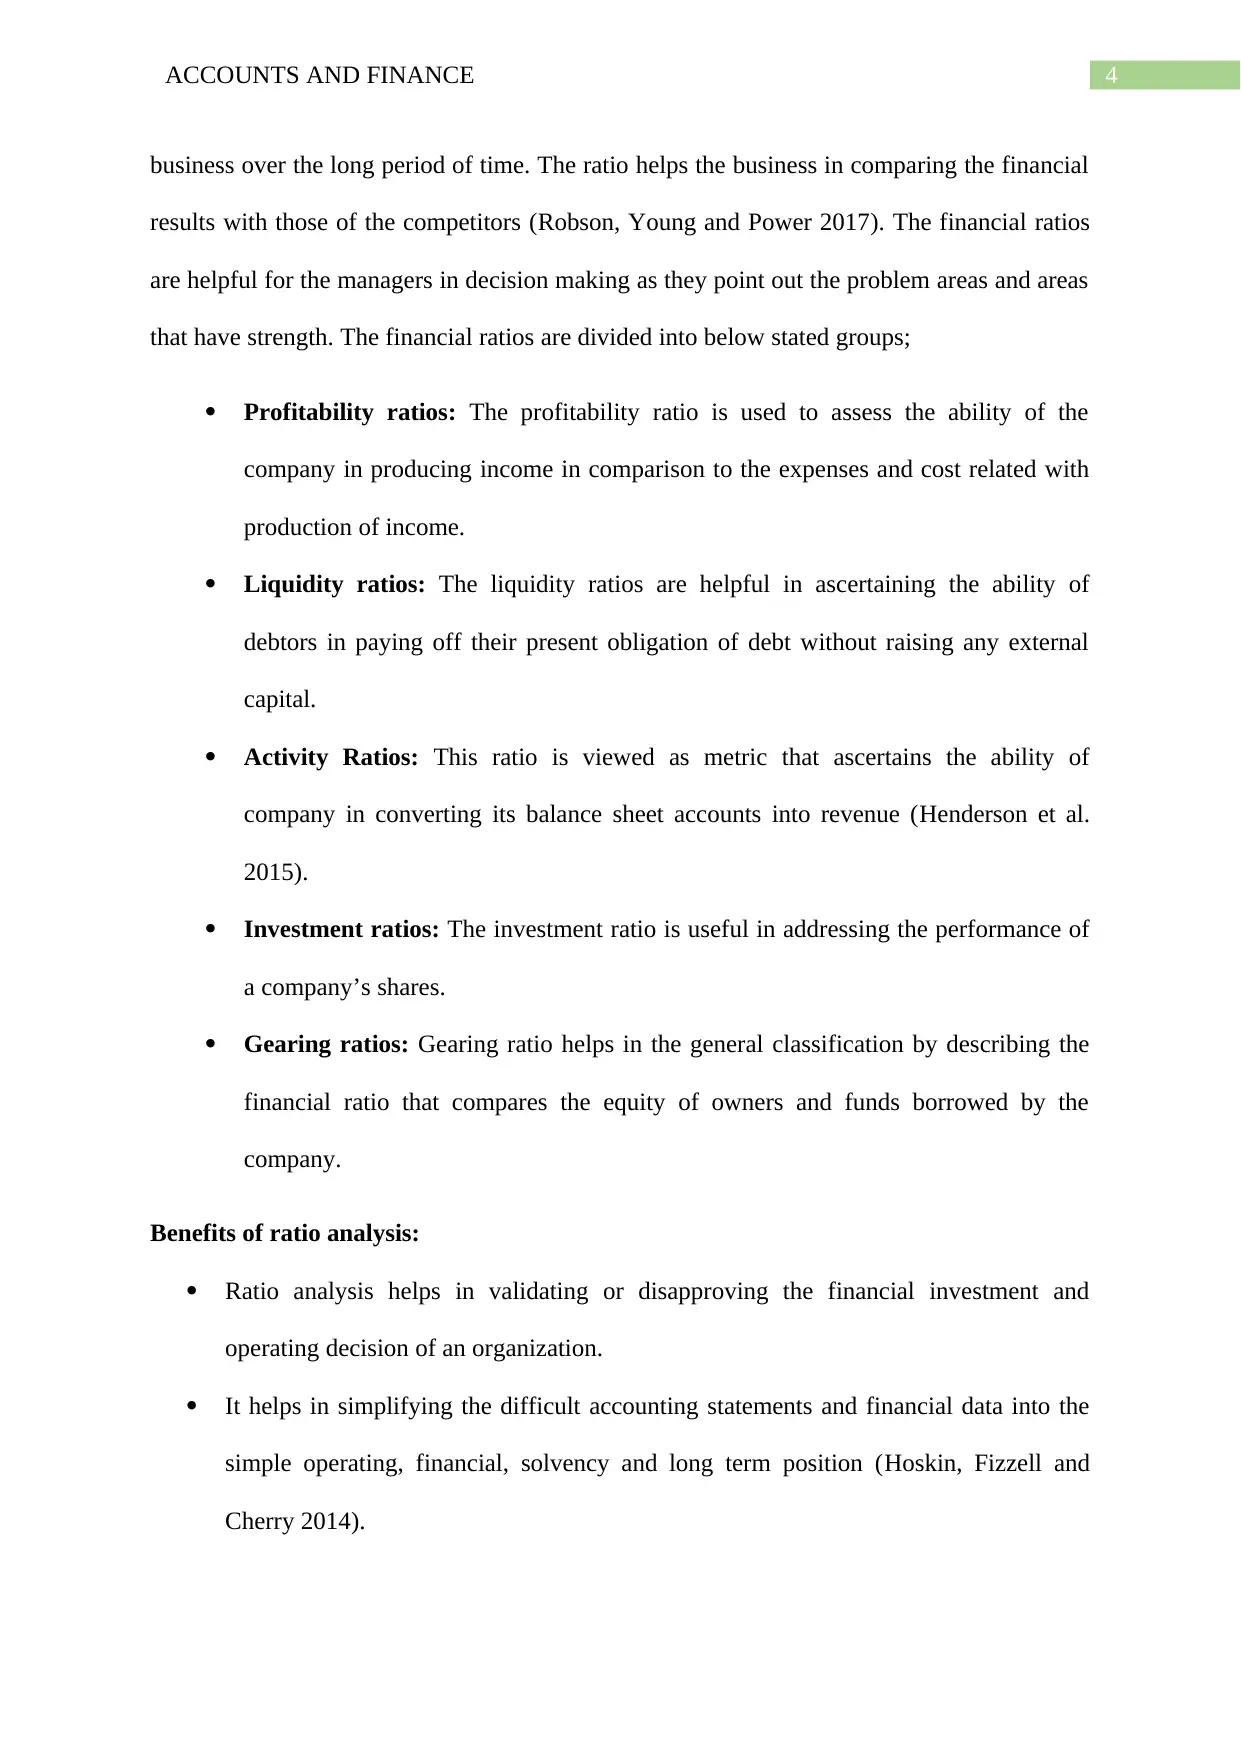
business over the long period of time. The ratio helps the business in comparing the financial
results with those of the competitors (Robson, Young and Power 2017). The financial ratios
are helpful for the managers in decision making as they point out the problem areas and areas
that have strength. The financial ratios are divided into below stated groups;
Profitability ratios: The profitability ratio is used to assess the ability of the
company in producing income in comparison to the expenses and cost related with
production of income.
Liquidity ratios: The liquidity ratios are helpful in ascertaining the ability of
debtors in paying off their present obligation of debt without raising any external
capital.
Activity Ratios: This ratio is viewed as metric that ascertains the ability of
company in converting its balance sheet accounts into revenue (Henderson et al.
2015).
Investment ratios: The investment ratio is useful in addressing the performance of
a company’s shares.
Gearing ratios: Gearing ratio helps in the general classification by describing the
financial ratio that compares the equity of owners and funds borrowed by the
company.
Benefits of ratio analysis:
Ratio analysis helps in validating or disapproving the financial investment and
operating decision of an organization.
It helps in simplifying the difficult accounting statements and financial data into the
simple operating, financial, solvency and long term position (Hoskin, Fizzell and
Cherry 2014).
5ACCOUNTS AND FINANCE
Ratio analysis is beneficial in recognizing the problems and bringing into the attention
of the management to the problem areas.
Limitation of Ratio Analysis:
Ratio analysis overlooks the changes in price level when inflation is prevalent.
Ratio analysis disregards the qualitative aspects of a company.
Different types of accounting practices can misrepresent the comparison even with the
similar company.
BP Financial Statement Analysis from 2014 to 2017:
Profitability Ratios:
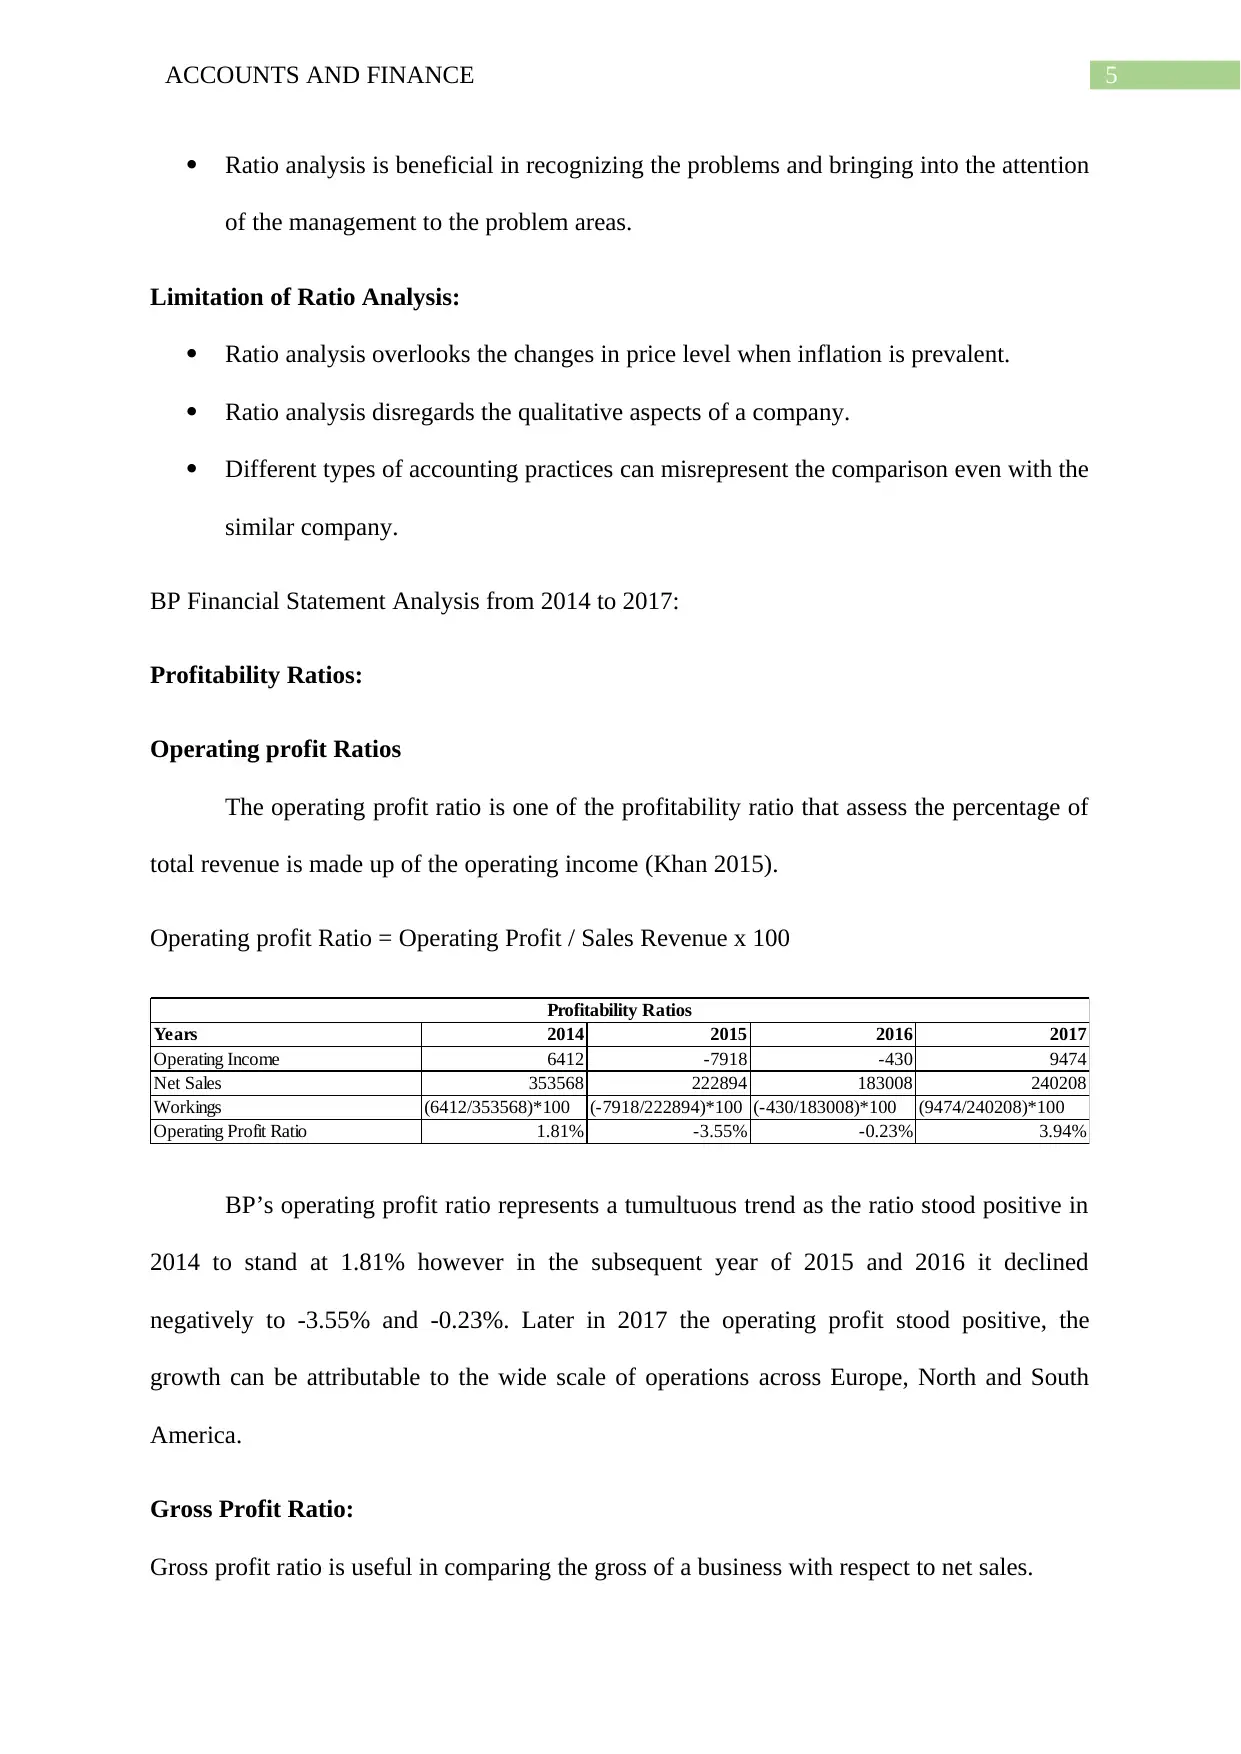
Operating profit Ratios
The operating profit ratio is one of the profitability ratio that assess the percentage of
total revenue is made up of the operating income (Khan 2015).
Operating profit Ratio = Operating Profit / Sales Revenue x 100
Years 2014 2015 2016 2017
Operating Income 6412 -7918 -430 9474
Net Sales 353568 222894 183008 240208
Workings (6412/353568)*100 (-7918/222894)*100 (-430/183008)*100 (9474/240208)*100
Operating Profit Ratio 1.81% -3.55% -0.23% 3.94%
Profitability Ratios
BP’s operating profit ratio represents a tumultuous trend as the ratio stood positive in
2014 to stand at 1.81% however in the subsequent year of 2015 and 2016 it declined
negatively to -3.55% and -0.23%. Later in 2017 the operating profit stood positive, the
growth can be attributable to the wide scale of operations across Europe, North and South
America.
Gross Profit Ratio:
Gross profit ratio is useful in comparing the gross of a business with respect to net sales.
Ratio analysis is beneficial in recognizing the problems and bringing into the attention
of the management to the problem areas.
Limitation of Ratio Analysis:
Ratio analysis overlooks the changes in price level when inflation is prevalent.
Ratio analysis disregards the qualitative aspects of a company.
Different types of accounting practices can misrepresent the comparison even with the
similar company.
BP Financial Statement Analysis from 2014 to 2017:
Profitability Ratios:
Operating profit Ratios
The operating profit ratio is one of the profitability ratio that assess the percentage of
total revenue is made up of the operating income (Khan 2015).
Operating profit Ratio = Operating Profit / Sales Revenue x 100
Years 2014 2015 2016 2017
Operating Income 6412 -7918 -430 9474
Net Sales 353568 222894 183008 240208
Workings (6412/353568)*100 (-7918/222894)*100 (-430/183008)*100 (9474/240208)*100
Operating Profit Ratio 1.81% -3.55% -0.23% 3.94%
Profitability Ratios
BP’s operating profit ratio represents a tumultuous trend as the ratio stood positive in
2014 to stand at 1.81% however in the subsequent year of 2015 and 2016 it declined
negatively to -3.55% and -0.23%. Later in 2017 the operating profit stood positive, the
growth can be attributable to the wide scale of operations across Europe, North and South
America.
Gross Profit Ratio:
Gross profit ratio is useful in comparing the gross of a business with respect to net sales.
⊘ This is a preview!⊘
Do you want full access?
Subscribe today to unlock all pages.
Trusted by 1+ million students worldwide
6ACCOUNTS AND FINANCE
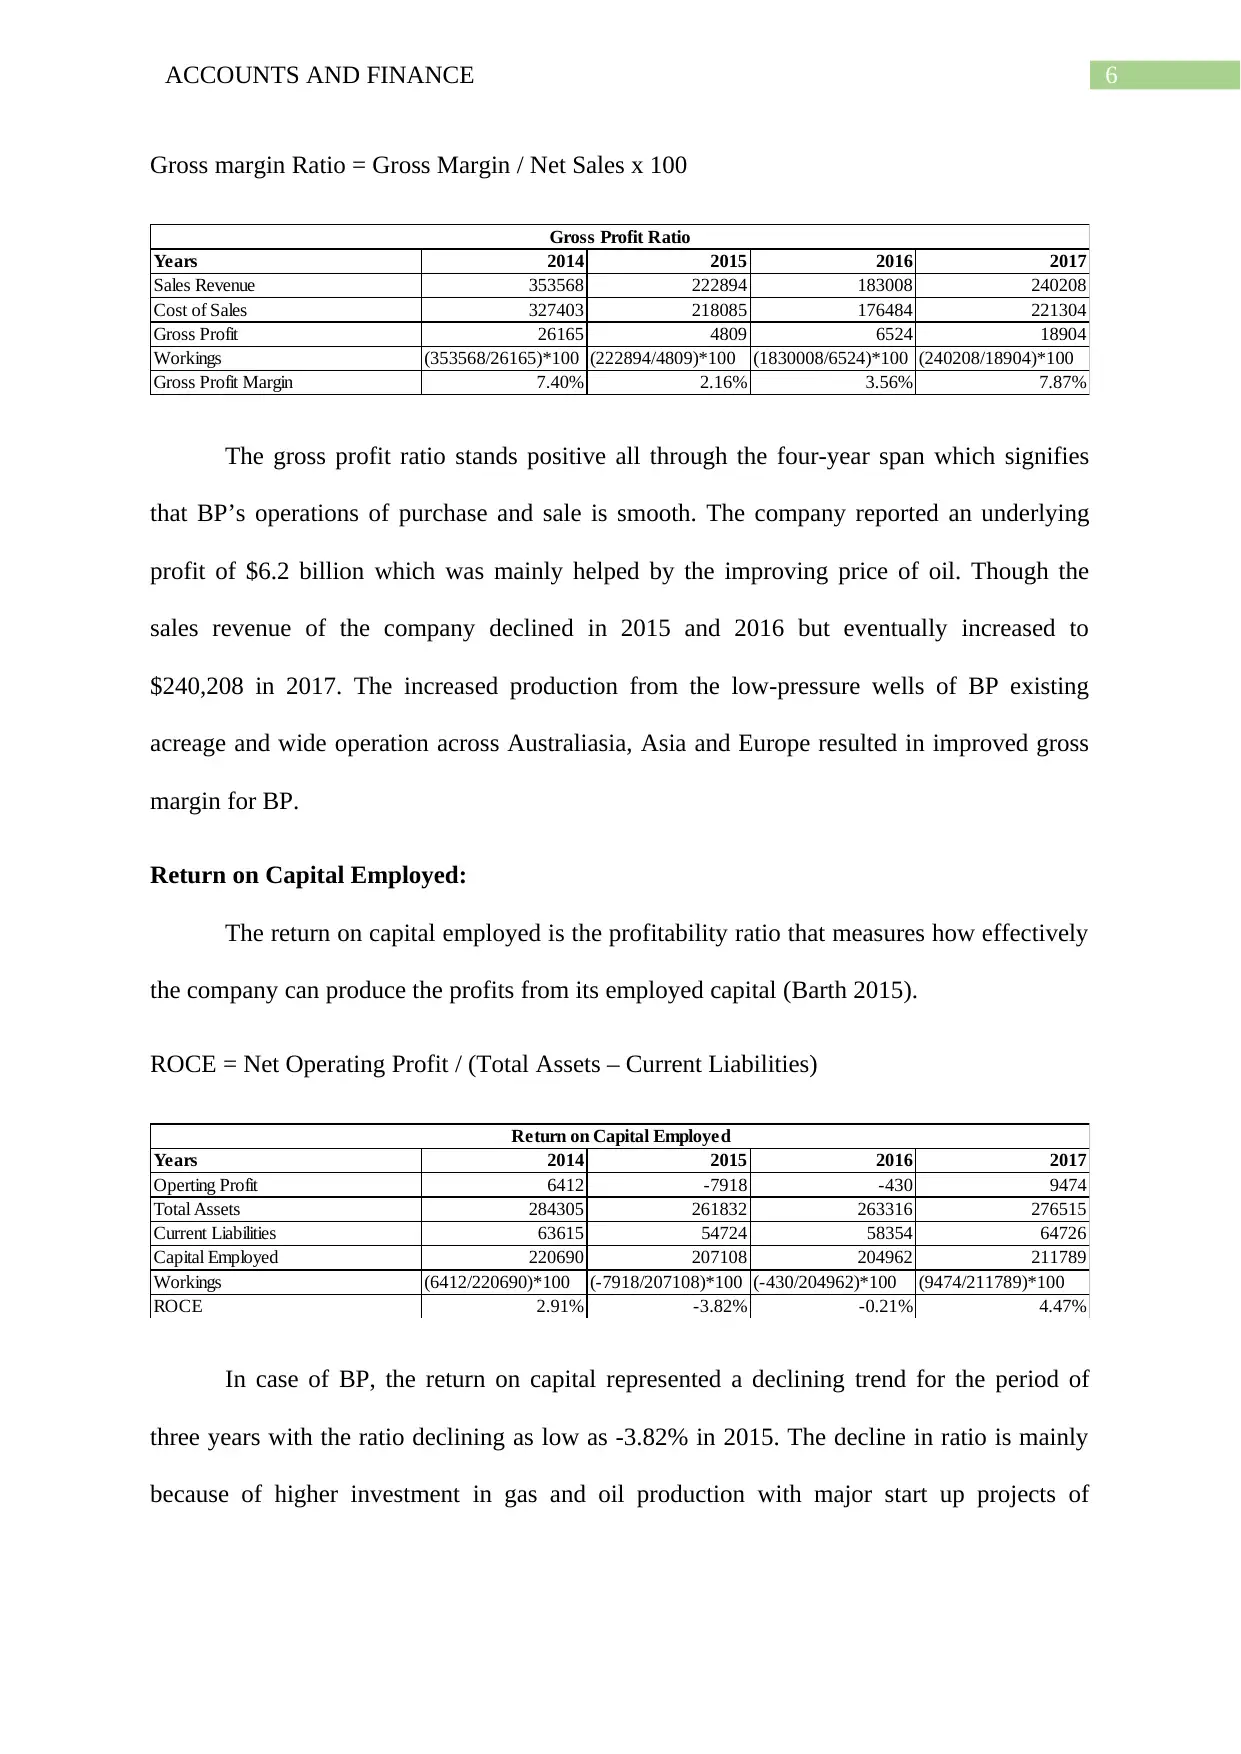
Gross margin Ratio = Gross Margin / Net Sales x 100
Years 2014 2015 2016 2017
Sales Revenue 353568 222894 183008 240208
Cost of Sales 327403 218085 176484 221304
Gross Profit 26165 4809 6524 18904
Workings (353568/26165)*100 (222894/4809)*100 (1830008/6524)*100 (240208/18904)*100
Gross Profit Margin 7.40% 2.16% 3.56% 7.87%
Gross Profit Ratio
The gross profit ratio stands positive all through the four-year span which signifies
that BP’s operations of purchase and sale is smooth. The company reported an underlying
profit of $6.2 billion which was mainly helped by the improving price of oil. Though the
sales revenue of the company declined in 2015 and 2016 but eventually increased to
$240,208 in 2017. The increased production from the low-pressure wells of BP existing
acreage and wide operation across Australiasia, Asia and Europe resulted in improved gross
margin for BP.
Return on Capital Employed:
The return on capital employed is the profitability ratio that measures how effectively
the company can produce the profits from its employed capital (Barth 2015).
ROCE = Net Operating Profit / (Total Assets – Current Liabilities)
Years 2014 2015 2016 2017
Operting Profit 6412 -7918 -430 9474
Total Assets 284305 261832 263316 276515
Current Liabilities 63615 54724 58354 64726
Capital Employed 220690 207108 204962 211789
Workings (6412/220690)*100 (-7918/207108)*100 (-430/204962)*100 (9474/211789)*100
ROCE 2.91% -3.82% -0.21% 4.47%
Return on Capital Employed
In case of BP, the return on capital represented a declining trend for the period of
three years with the ratio declining as low as -3.82% in 2015. The decline in ratio is mainly
because of higher investment in gas and oil production with major start up projects of
Paraphrase This Document
Need a fresh take? Get an instant paraphrase of this document with our AI Paraphraser
7ACCOUNTS AND FINANCE
900,000 barrels of production each day by 2021. This ultimately resulted a decline in assets
with decrease in operating profit as well.
Liquidity Ratios:
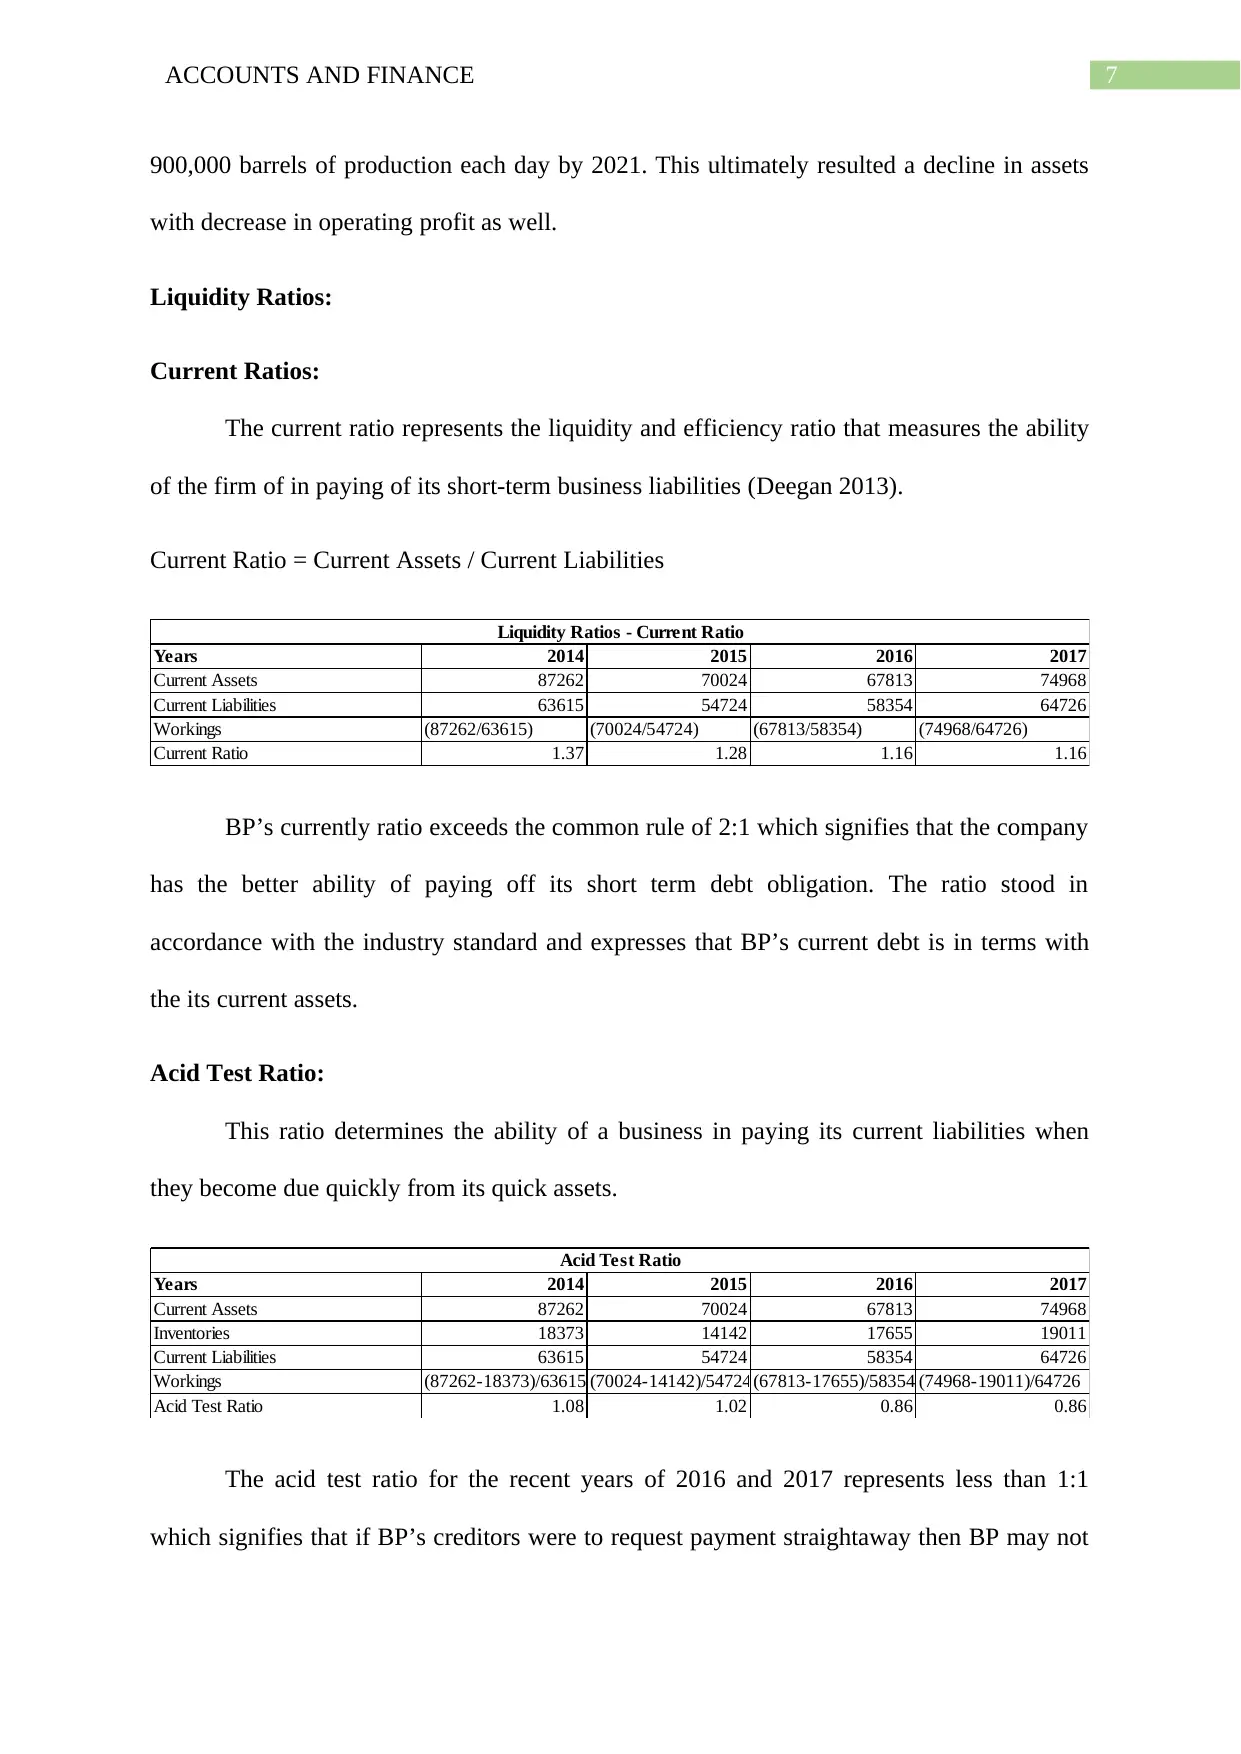
Current Ratios:
The current ratio represents the liquidity and efficiency ratio that measures the ability
of the firm of in paying of its short-term business liabilities (Deegan 2013).
Current Ratio = Current Assets / Current Liabilities
Years 2014 2015 2016 2017
Current Assets 87262 70024 67813 74968
Current Liabilities 63615 54724 58354 64726
Workings (87262/63615) (70024/54724) (67813/58354) (74968/64726)
Current Ratio 1.37 1.28 1.16 1.16
Liquidity Ratios - Current Ratio
BP’s currently ratio exceeds the common rule of 2:1 which signifies that the company
has the better ability of paying off its short term debt obligation. The ratio stood in
accordance with the industry standard and expresses that BP’s current debt is in terms with
the its current assets.
Acid Test Ratio:
This ratio determines the ability of a business in paying its current liabilities when
they become due quickly from its quick assets.
Years 2014 2015 2016 2017
Current Assets 87262 70024 67813 74968
Inventories 18373 14142 17655 19011
Current Liabilities 63615 54724 58354 64726
Workings (87262-18373)/63615 (70024-14142)/54724(67813-17655)/58354 (74968-19011)/64726
Acid Test Ratio 1.08 1.02 0.86 0.86
Acid Test Ratio
The acid test ratio for the recent years of 2016 and 2017 represents less than 1:1
which signifies that if BP’s creditors were to request payment straightaway then BP may not
900,000 barrels of production each day by 2021. This ultimately resulted a decline in assets
with decrease in operating profit as well.
Liquidity Ratios:
Current Ratios:
The current ratio represents the liquidity and efficiency ratio that measures the ability
of the firm of in paying of its short-term business liabilities (Deegan 2013).
Current Ratio = Current Assets / Current Liabilities
Years 2014 2015 2016 2017
Current Assets 87262 70024 67813 74968
Current Liabilities 63615 54724 58354 64726
Workings (87262/63615) (70024/54724) (67813/58354) (74968/64726)
Current Ratio 1.37 1.28 1.16 1.16
Liquidity Ratios - Current Ratio
BP’s currently ratio exceeds the common rule of 2:1 which signifies that the company
has the better ability of paying off its short term debt obligation. The ratio stood in
accordance with the industry standard and expresses that BP’s current debt is in terms with
the its current assets.
Acid Test Ratio:
This ratio determines the ability of a business in paying its current liabilities when
they become due quickly from its quick assets.
Years 2014 2015 2016 2017
Current Assets 87262 70024 67813 74968
Inventories 18373 14142 17655 19011
Current Liabilities 63615 54724 58354 64726
Workings (87262-18373)/63615 (70024-14142)/54724(67813-17655)/58354 (74968-19011)/64726
Acid Test Ratio 1.08 1.02 0.86 0.86
Acid Test Ratio
The acid test ratio for the recent years of 2016 and 2017 represents less than 1:1
which signifies that if BP’s creditors were to request payment straightaway then BP may not
8ACCOUNTS AND FINANCE
have the sufficient amount of fund or assets to pay cash. This signifies that a significant
portion of the BP’s current assets is reliant on the inventories.
Activity ratios:
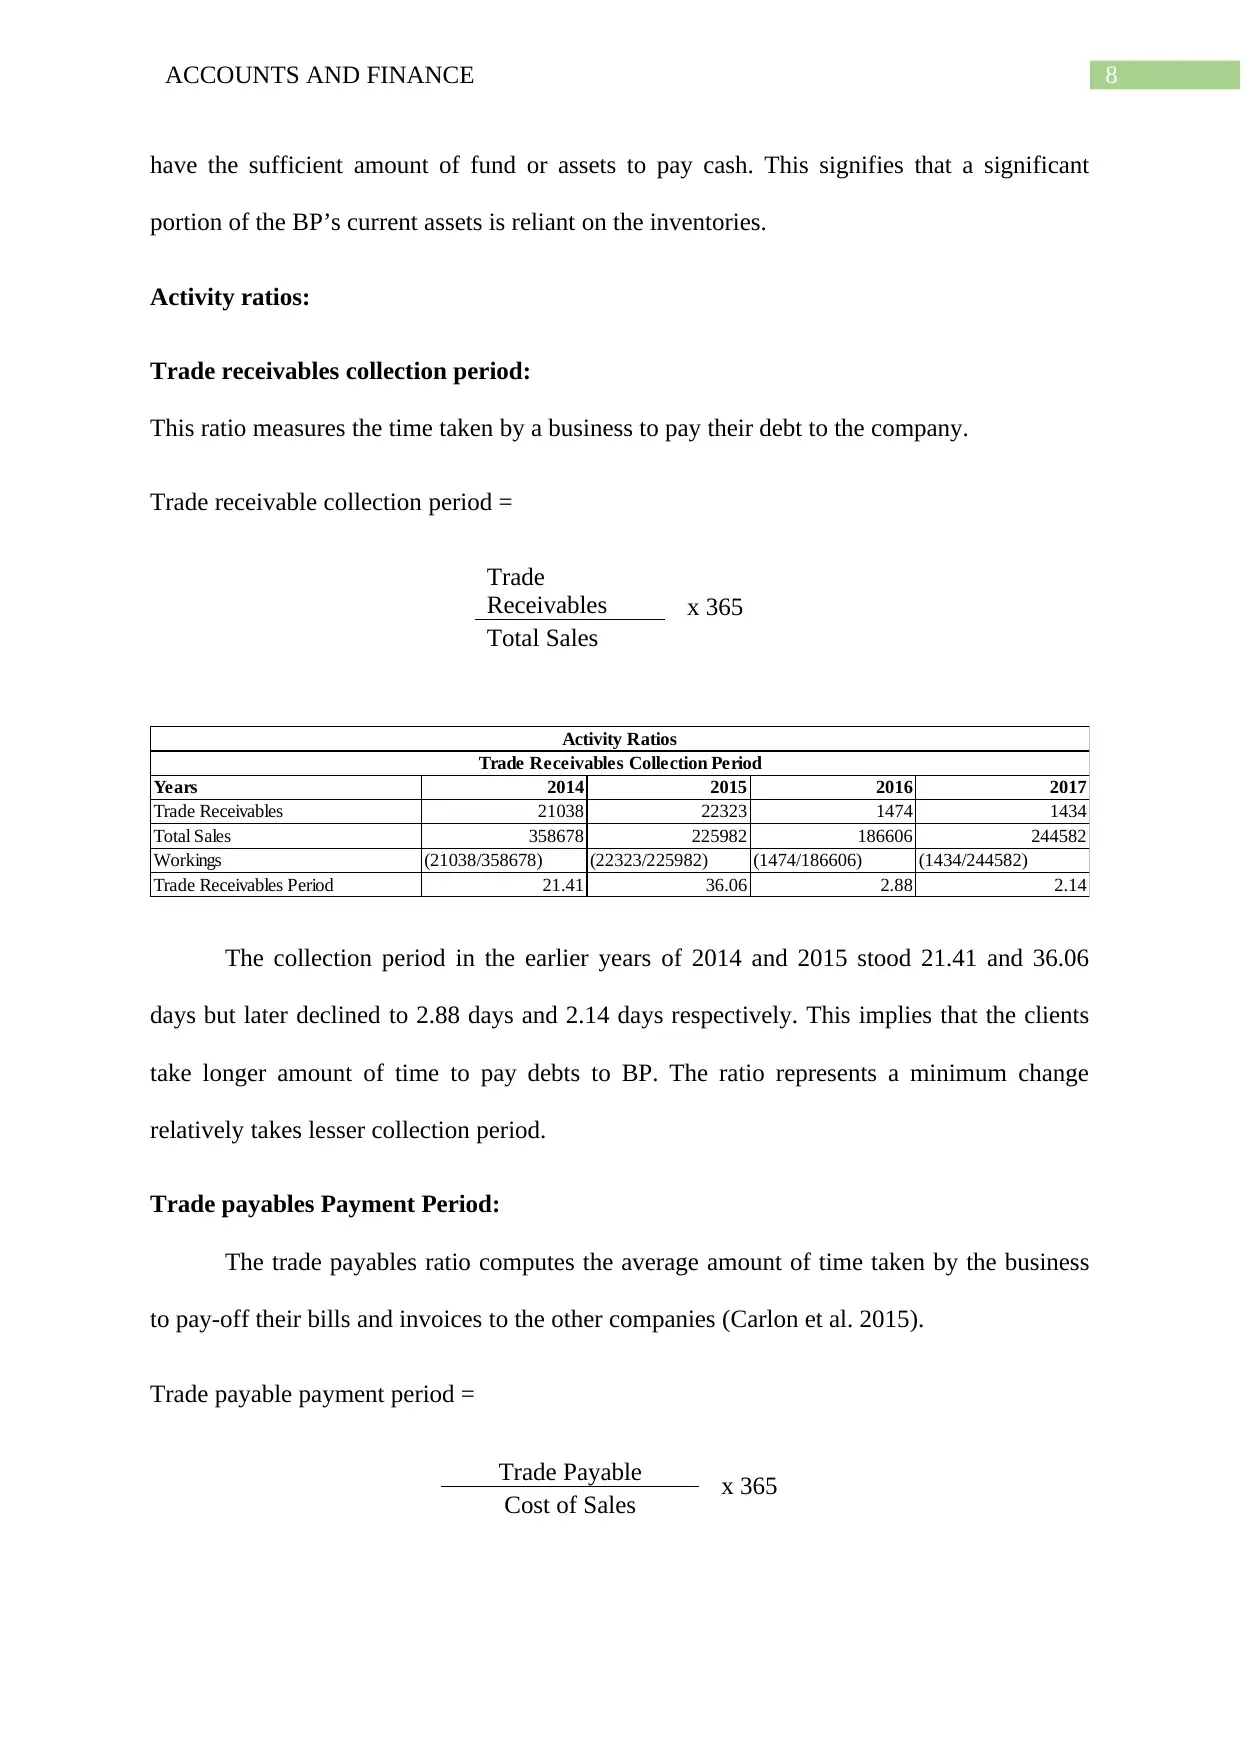
Trade receivables collection period:
This ratio measures the time taken by a business to pay their debt to the company.
Trade receivable collection period =
Trade
Receivables x 365
Total Sales
Years 2014 2015 2016 2017
Trade Receivables 21038 22323 1474 1434
Total Sales 358678 225982 186606 244582
Workings (21038/358678) (22323/225982) (1474/186606) (1434/244582)
Trade Receivables Period 21.41 36.06 2.88 2.14
Trade Receivables Collection Period
Activity Ratios
The collection period in the earlier years of 2014 and 2015 stood 21.41 and 36.06
days but later declined to 2.88 days and 2.14 days respectively. This implies that the clients
take longer amount of time to pay debts to BP. The ratio represents a minimum change
relatively takes lesser collection period.
Trade payables Payment Period:
The trade payables ratio computes the average amount of time taken by the business
to pay-off their bills and invoices to the other companies (Carlon et al. 2015).
Trade payable payment period =
Trade Payable x 365
Cost of Sales
have the sufficient amount of fund or assets to pay cash. This signifies that a significant
portion of the BP’s current assets is reliant on the inventories.
Activity ratios:
Trade receivables collection period:
This ratio measures the time taken by a business to pay their debt to the company.
Trade receivable collection period =
Trade
Receivables x 365
Total Sales
Years 2014 2015 2016 2017
Trade Receivables 21038 22323 1474 1434
Total Sales 358678 225982 186606 244582
Workings (21038/358678) (22323/225982) (1474/186606) (1434/244582)
Trade Receivables Period 21.41 36.06 2.88 2.14
Trade Receivables Collection Period
Activity Ratios
The collection period in the earlier years of 2014 and 2015 stood 21.41 and 36.06
days but later declined to 2.88 days and 2.14 days respectively. This implies that the clients
take longer amount of time to pay debts to BP. The ratio represents a minimum change
relatively takes lesser collection period.
Trade payables Payment Period:
The trade payables ratio computes the average amount of time taken by the business
to pay-off their bills and invoices to the other companies (Carlon et al. 2015).
Trade payable payment period =
Trade Payable x 365
Cost of Sales
⊘ This is a preview!⊘
Do you want full access?
Subscribe today to unlock all pages.
Trusted by 1+ million students worldwide
9ACCOUNTS AND FINANCE
Years 2014 2015 2016 2017
Trade Payables 40118 31949 44209 37915
Cost of Goods Sold 327403 218085 176484 221304
Workings (40118/327403) (31949/218085) (44209/176484) (37915/22304)
Trade payable period 44.72 53.47 91.43 62.53
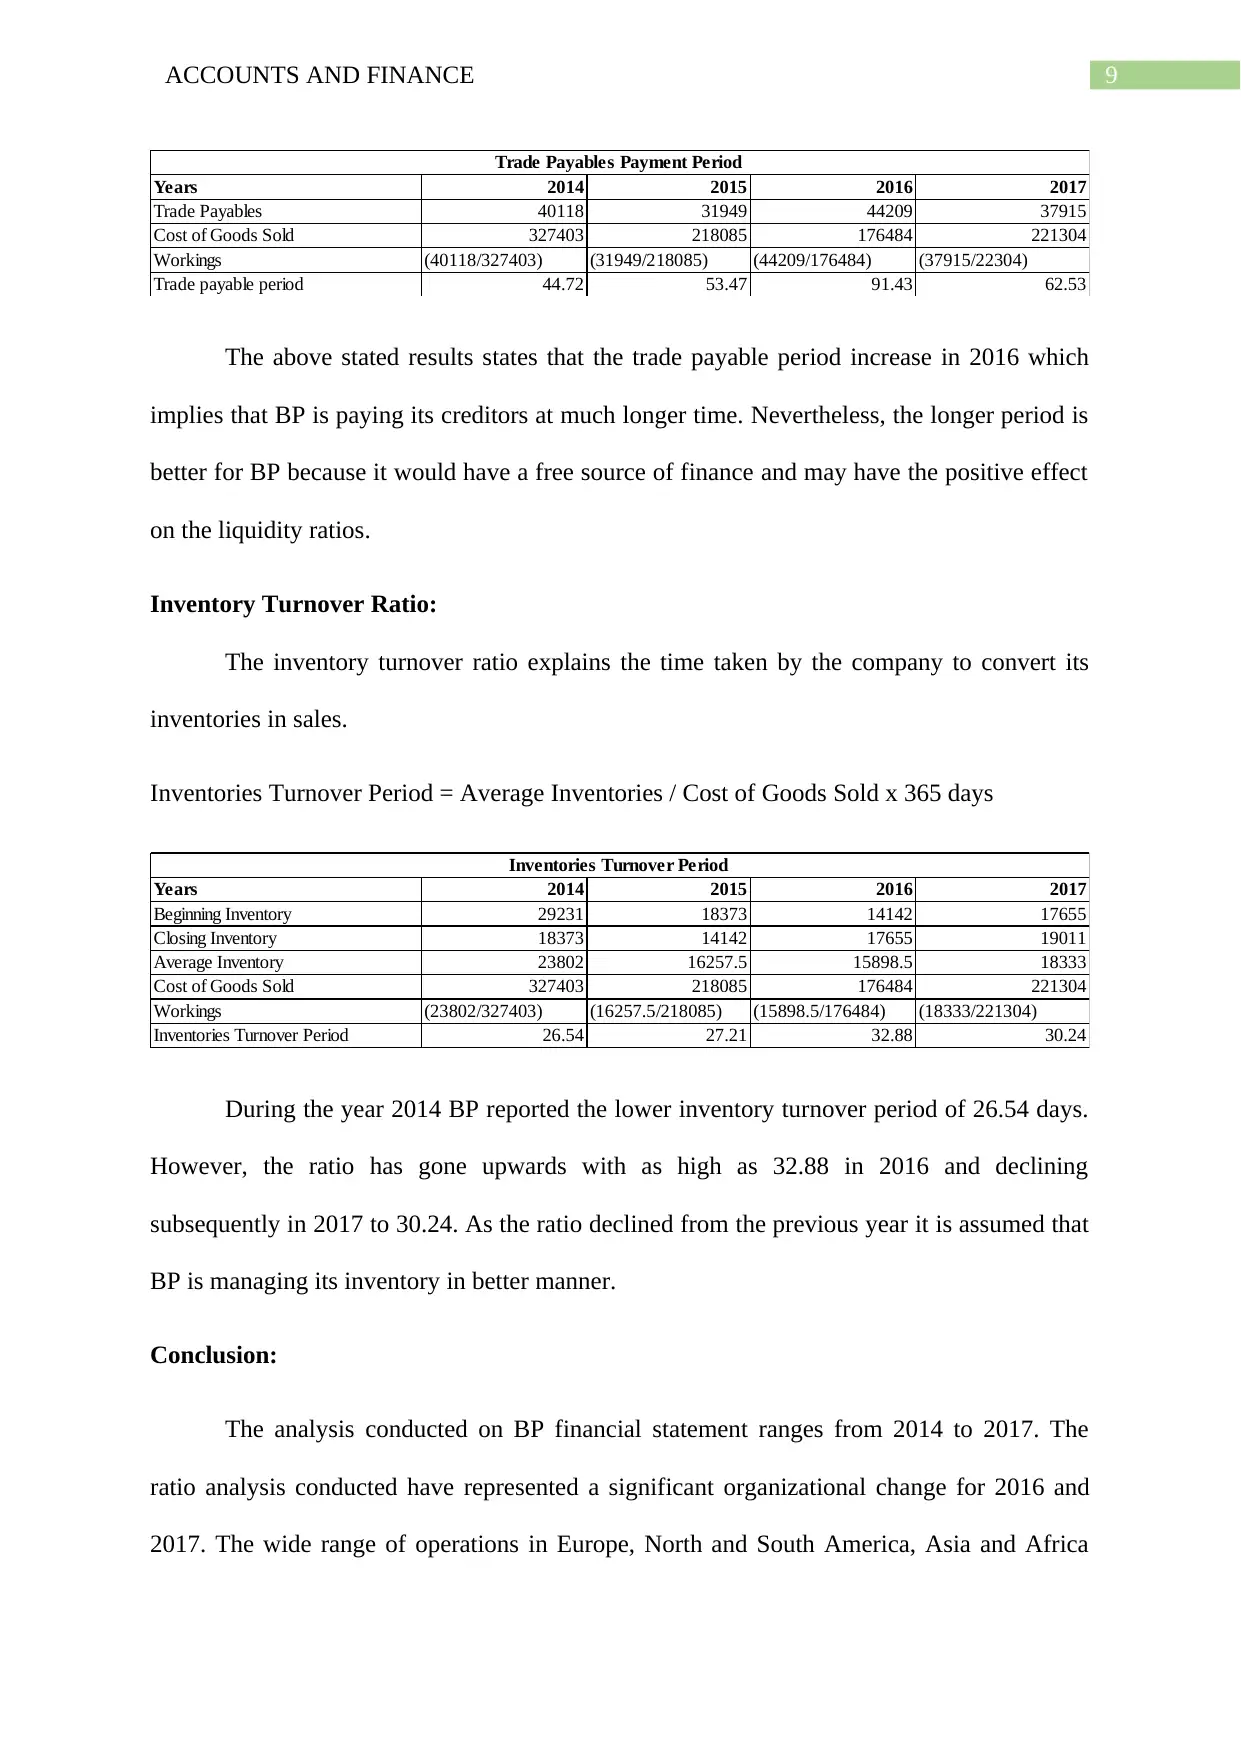
Trade Payables Payment Period
The above stated results states that the trade payable period increase in 2016 which
implies that BP is paying its creditors at much longer time. Nevertheless, the longer period is
better for BP because it would have a free source of finance and may have the positive effect
on the liquidity ratios.
Inventory Turnover Ratio:
The inventory turnover ratio explains the time taken by the company to convert its
inventories in sales.
Inventories Turnover Period = Average Inventories / Cost of Goods Sold x 365 days
Years 2014 2015 2016 2017
Beginning Inventory 29231 18373 14142 17655
Closing Inventory 18373 14142 17655 19011
Average Inventory 23802 16257.5 15898.5 18333
Cost of Goods Sold 327403 218085 176484 221304
Workings (23802/327403) (16257.5/218085) (15898.5/176484) (18333/221304)
Inventories Turnover Period 26.54 27.21 32.88 30.24
Inventories Turnover Period
During the year 2014 BP reported the lower inventory turnover period of 26.54 days.
However, the ratio has gone upwards with as high as 32.88 in 2016 and declining
subsequently in 2017 to 30.24. As the ratio declined from the previous year it is assumed that
BP is managing its inventory in better manner.
Conclusion:
The analysis conducted on BP financial statement ranges from 2014 to 2017. The
ratio analysis conducted have represented a significant organizational change for 2016 and
2017. The wide range of operations in Europe, North and South America, Asia and Africa
Years 2014 2015 2016 2017
Trade Payables 40118 31949 44209 37915
Cost of Goods Sold 327403 218085 176484 221304
Workings (40118/327403) (31949/218085) (44209/176484) (37915/22304)
Trade payable period 44.72 53.47 91.43 62.53
Trade Payables Payment Period
The above stated results states that the trade payable period increase in 2016 which
implies that BP is paying its creditors at much longer time. Nevertheless, the longer period is
better for BP because it would have a free source of finance and may have the positive effect
on the liquidity ratios.
Inventory Turnover Ratio:
The inventory turnover ratio explains the time taken by the company to convert its
inventories in sales.
Inventories Turnover Period = Average Inventories / Cost of Goods Sold x 365 days
Years 2014 2015 2016 2017
Beginning Inventory 29231 18373 14142 17655
Closing Inventory 18373 14142 17655 19011
Average Inventory 23802 16257.5 15898.5 18333
Cost of Goods Sold 327403 218085 176484 221304
Workings (23802/327403) (16257.5/218085) (15898.5/176484) (18333/221304)
Inventories Turnover Period 26.54 27.21 32.88 30.24
Inventories Turnover Period
During the year 2014 BP reported the lower inventory turnover period of 26.54 days.
However, the ratio has gone upwards with as high as 32.88 in 2016 and declining
subsequently in 2017 to 30.24. As the ratio declined from the previous year it is assumed that
BP is managing its inventory in better manner.
Conclusion:
The analysis conducted on BP financial statement ranges from 2014 to 2017. The
ratio analysis conducted have represented a significant organizational change for 2016 and
2017. The wide range of operations in Europe, North and South America, Asia and Africa
Paraphrase This Document
Need a fresh take? Get an instant paraphrase of this document with our AI Paraphraser
10ACCOUNTS AND FINANCE
have enabled the company to attain record crude oil production. Furthermore, the
performance of BP improved significantly as the profit attributable to shareholder stood $3.4
bn. The study would have provided more detailed if a comparative study has been conducted
with the company of same industry.
have enabled the company to attain record crude oil production. Furthermore, the
performance of BP improved significantly as the profit attributable to shareholder stood $3.4
bn. The study would have provided more detailed if a comparative study has been conducted
with the company of same industry.
11ACCOUNTS AND FINANCE
References:
"Annual report | Home | BP". BP global, 2018. Online. Internet. 23 Dec. 2018. . Available:
https://www.bp.com/en/global/corporate/investors/results-and-reporting/annual-report.html.
Barth, M.E., 2015. Financial accounting research, practice, and financial
accountability. Abacus, 51(4), pp.499-510.
Carlon, S., McAlpine-Mladenovic, R., Palm, C., Mitrione, L., Kirk, N. and Wong, L.,
2015. Financial accounting: Reporting, analysis and decision making. John Wiley and Sons
Australia.
Deegan, C., 2013. Financial accounting theory. McGraw-Hill Education Australia.
Henderson, S., Peirson, G., Herbohn, K. and Howieson, B., 2015. Issues in financial
accounting. Pearson Higher Education AU.
Hoskin, R.E., Fizzell, M.R. and Cherry, D.C., 2014. Financial Accounting: a user
perspective. Wiley Global Education.
Khan, M., 2015. Accounting: Financial. In Encyclopedia of Public Administration and Public
Policy, Third Edition-5 Volume Set (pp. 1-6). Routledge.
Robson, K., Young, J. and Power, M., 2017. Themed section on financial accounting as
social and organizational practice: exploring the work of financial reporting. Accounting,
Organizations and Society, 56, pp.35-37.
⊘ This is a preview!⊘
Do you want full access?
Subscribe today to unlock all pages.
Trusted by 1+ million students worldwide
1 out of 17
Related Documents


Your All-in-One AI-Powered Toolkit for Academic Success.
+13062052269
info@desklib.com
Available 24*7 on WhatsApp / Email
![[object Object]](/_next/static/media/star-bottom.7253800d.svg)
Unlock your academic potential
Copyright © 2020–2026 A2Z Services. All Rights Reserved. Developed and managed by ZUCOL.