Financial Analysis Report: Capral Limited - BUS106 USC Assignment
VerifiedAdded on 2023/06/07
|11
|2320
|299
Report
AI Summary
This report provides a financial analysis of Capral Limited for the years 2016 and 2017, utilizing ratio analysis to assess the company's financial health. The analysis covers key areas such as liquidity, profitability, and asset efficiency. While the company's liquidity position improved in 2017 compared to 2016, its profitability declined. The report also evaluates Capral Limited's inventory management practices, comparing them to those of Rio Tinto Inc., revealing areas for potential improvement. Key ratios such as current ratio, quick ratio, gross profit margin, return on equity, and return on assets are calculated and interpreted to provide a comprehensive overview of Capral Limited's financial standing. The report concludes that while liquidity is satisfactory, profitability needs attention, and inventory management requires enhancement. Desklib offers similar solved assignments for students.
Running Head: Financial Ratio Analysis
Capral lIMITED
Accounting For Managers
9/6/2018
Capral lIMITED
Accounting For Managers
9/6/2018
Paraphrase This Document
Need a fresh take? Get an instant paraphrase of this document with our AI Paraphraser
Financial Ratio Analysis 1
Executive Summary
In this report, the financial performance of Capral Limited for the year 2017 and 2016 has
been analysed. Capral Ltd is a public company that deals in the extruding and designing of
Aluminium related products. The liquidity ratio of the company has been found to be
improved in year 2017 as compared to 2016 but the profitability position of the company has
declined in 2017 as compared to 2016. The inventory management practices of the company
are not found to be satisfactory when they are compared with Rio Tinto Inc. which also deals
in aluminium product.
Financial Ratio Analysis 2
Table of Contents
Executive Summary...............................................................................................................................1
1.0. Introduction:...................................................................................................................................3
1.1. Purpose:......................................................................................................................................3
1.2. Scope:.........................................................................................................................................3
1.3. Limitations:.................................................................................................................................3
2.0. Company Overview:.......................................................................................................................3
3.0 Ratio Analysis...................................................................................................................................4
3.1. Current ratio:..............................................................................................................................5
3.2. Quick ratio:.................................................................................................................................5
3.3. Gross profit margin:....................................................................................................................6
3.4. Return on Equity:........................................................................................................................6
3.5. Return on Assets:........................................................................................................................7
4.0. Analysis and Comparison using the Inventory Ratio.......................................................................7
5.0. Conclusion:.....................................................................................................................................8
References:............................................................................................................................................9
⊘ This is a preview!⊘
Do you want full access?
Subscribe today to unlock all pages.
Trusted by 1+ million students worldwide
Financial Ratio Analysis 3
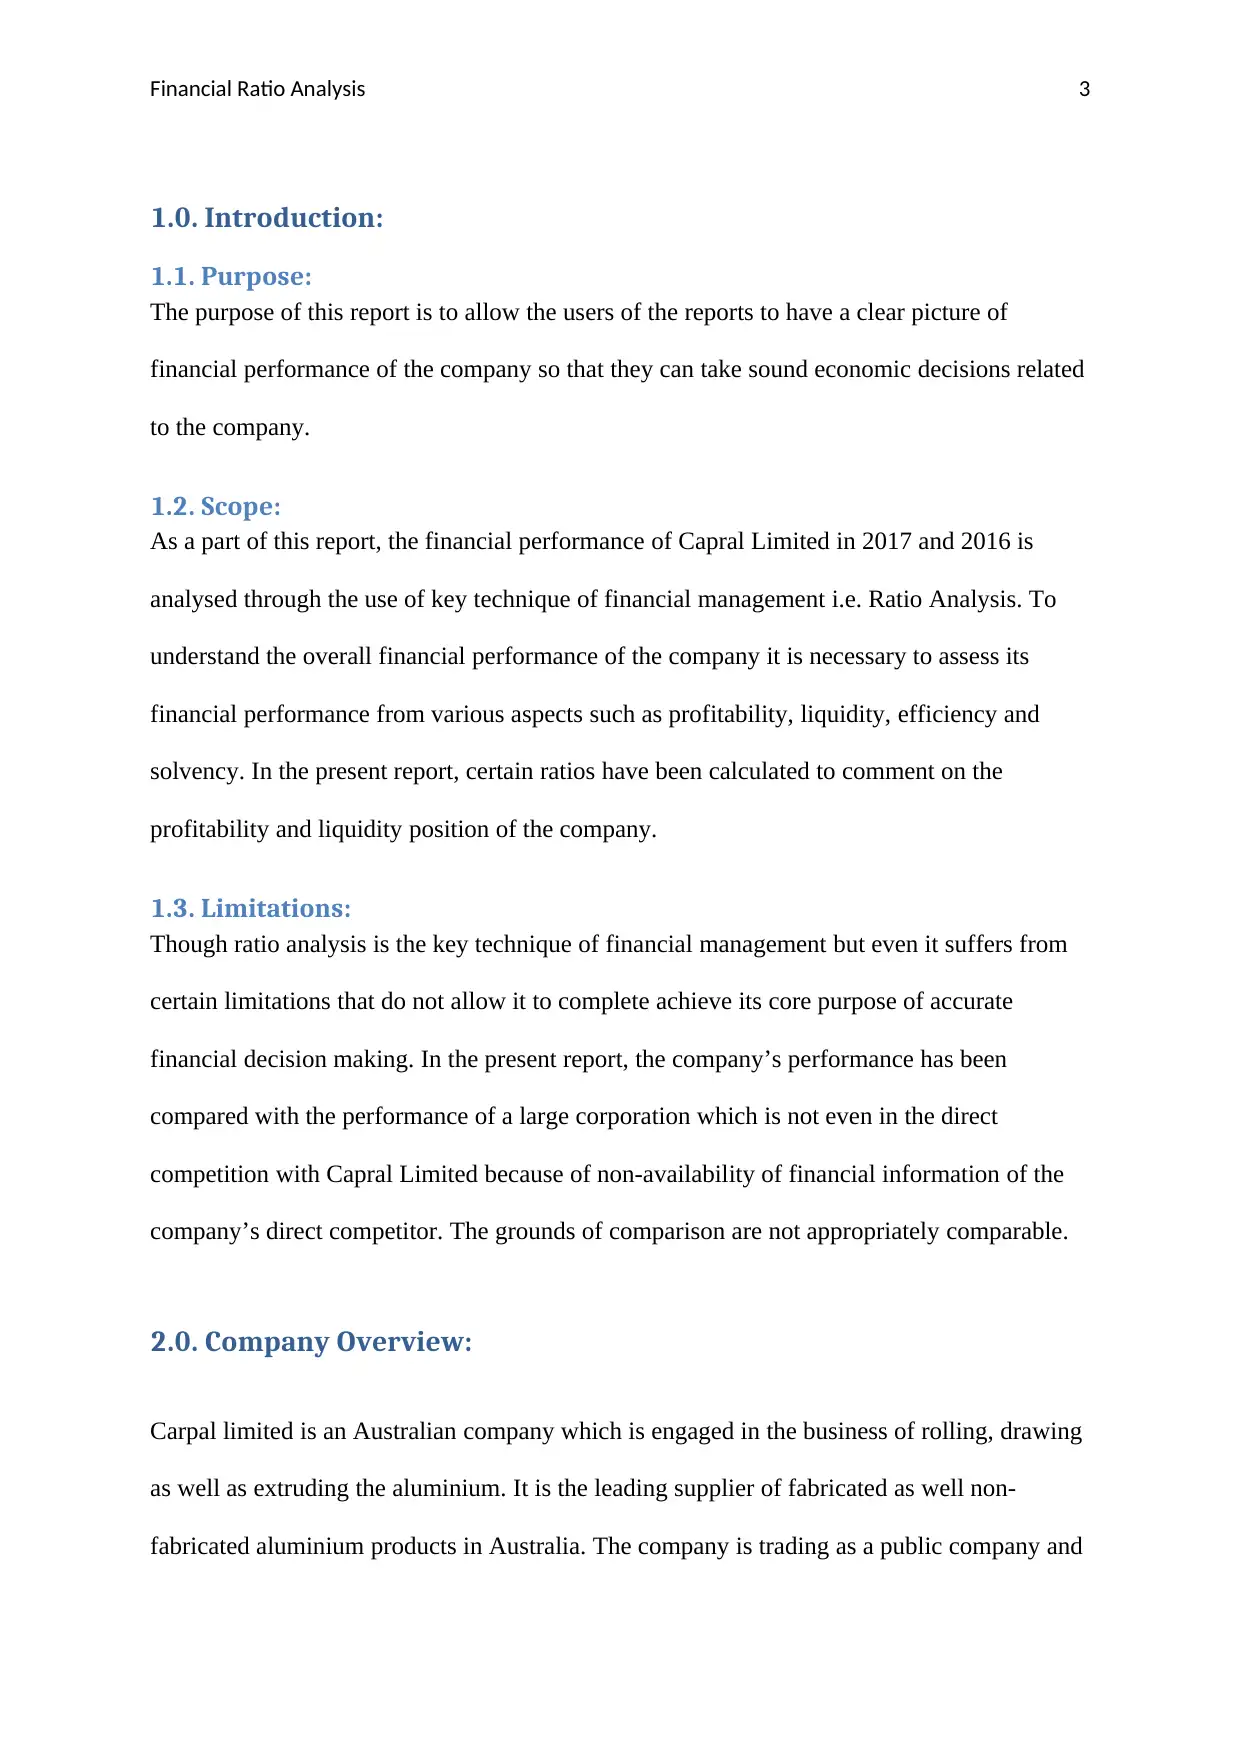
1.0. Introduction:
1.1. Purpose:
The purpose of this report is to allow the users of the reports to have a clear picture of
financial performance of the company so that they can take sound economic decisions related
to the company.
1.2. Scope:
As a part of this report, the financial performance of Capral Limited in 2017 and 2016 is
analysed through the use of key technique of financial management i.e. Ratio Analysis. To
understand the overall financial performance of the company it is necessary to assess its
financial performance from various aspects such as profitability, liquidity, efficiency and
solvency. In the present report, certain ratios have been calculated to comment on the
profitability and liquidity position of the company.
1.3. Limitations:
Though ratio analysis is the key technique of financial management but even it suffers from
certain limitations that do not allow it to complete achieve its core purpose of accurate
financial decision making. In the present report, the company’s performance has been
compared with the performance of a large corporation which is not even in the direct
competition with Capral Limited because of non-availability of financial information of the
company’s direct competitor. The grounds of comparison are not appropriately comparable.
2.0. Company Overview:
Carpal limited is an Australian company which is engaged in the business of rolling, drawing
as well as extruding the aluminium. It is the leading supplier of fabricated as well non-
fabricated aluminium products in Australia. The company is trading as a public company and
Paraphrase This Document
Need a fresh take? Get an instant paraphrase of this document with our AI Paraphraser
Financial Ratio Analysis 4
is ranked at 849th position among the top 2000 corporations in Australia. Carpal operates its
business through various divisions such as manufacturing division, business systems,
aluminium centres and industrial solutions. The manufacturing unit of the company is
operated through various manufacturing sites that are located in multiple places of Australia.
These sites undertake the extrusion and distribution of aluminium products in the Australian
market. The building system of the company provides a wide range of products like windows,
doors, showers, wardrobes etc. Through its trade centres, it provides a wide range of services
such as transportation, geometric extrusions and so on. The industrial solution unit offers
solutions to the company’s customers in the areas of cost and risk analysis.
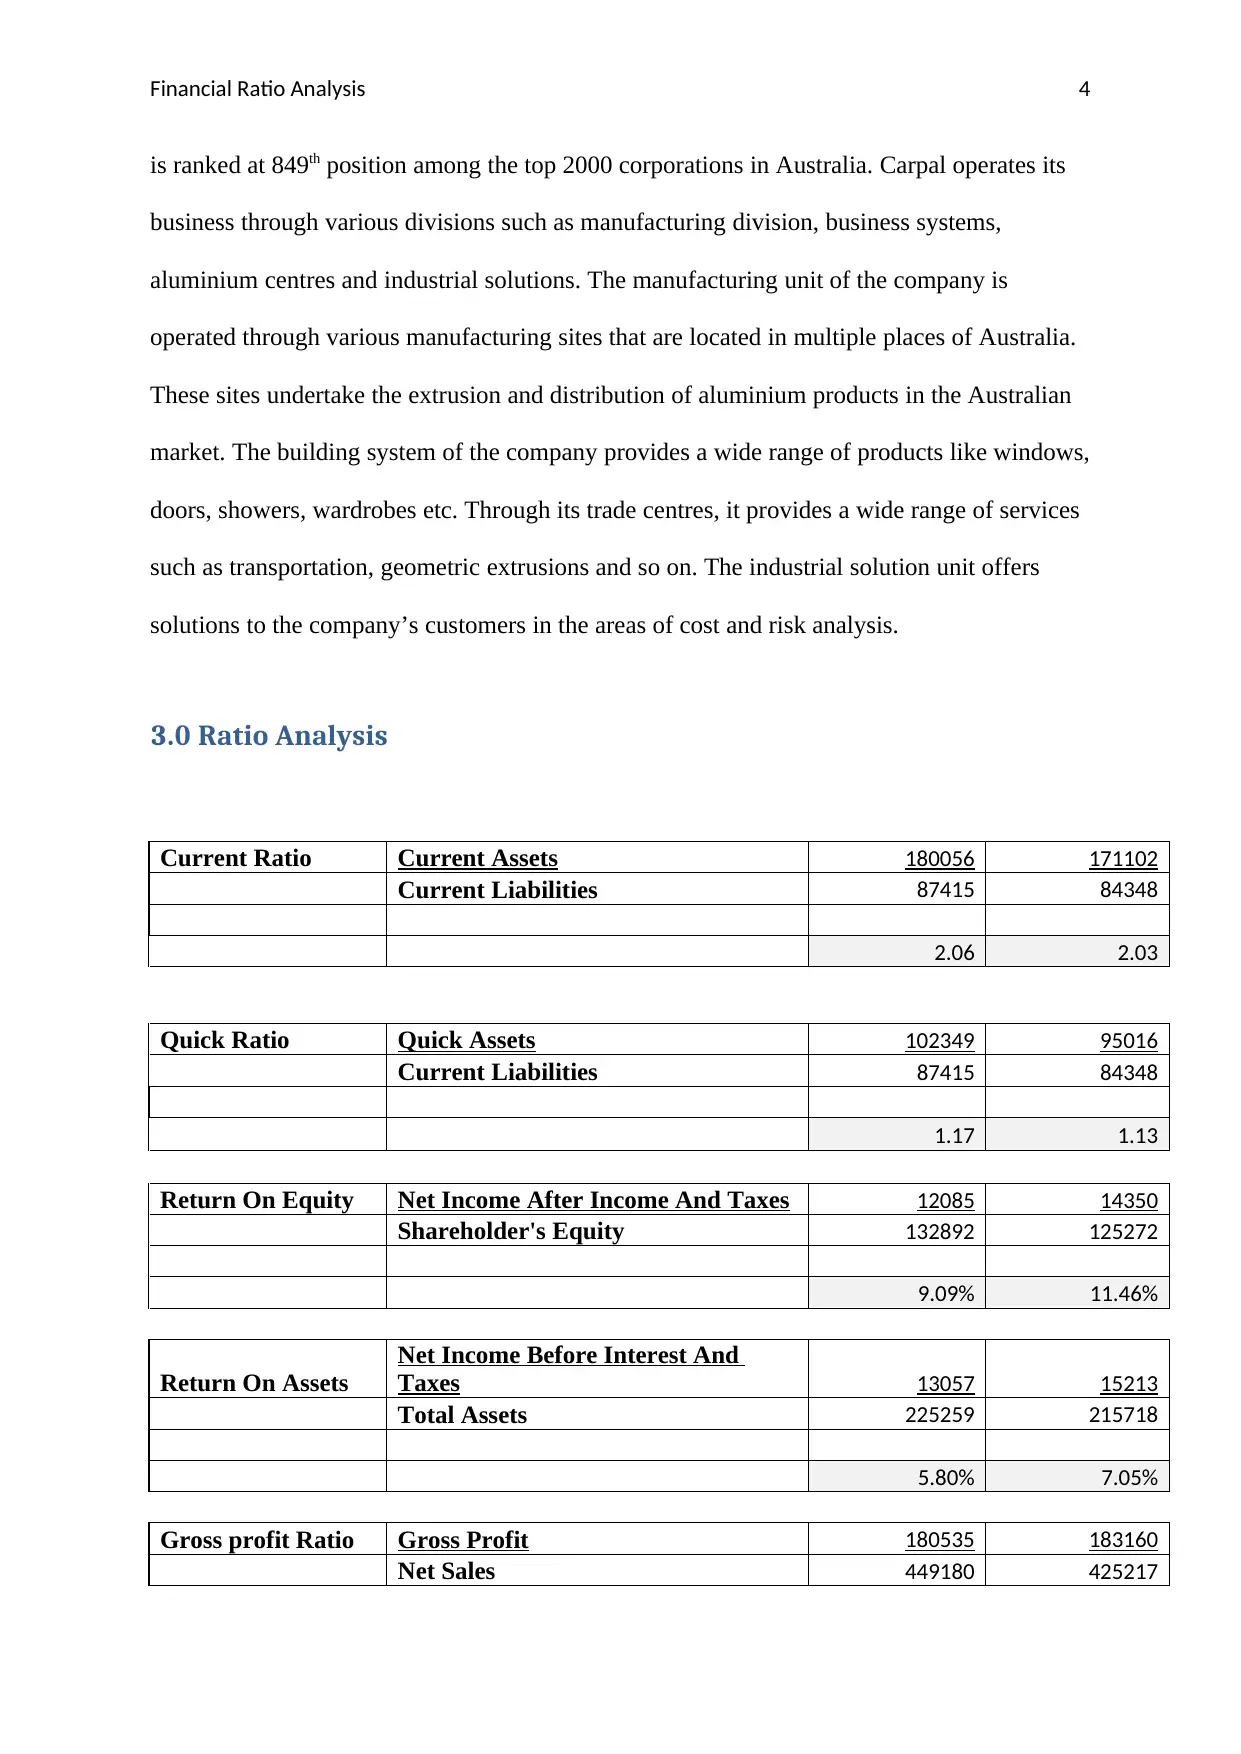
3.0 Ratio Analysis
Current Ratio Current Assets 180056 171102
Current Liabilities 87415 84348
2.06 2.03
Quick Ratio Quick Assets 102349 95016
Current Liabilities 87415 84348
1.17 1.13
Return On Equity Net Income After Income And Taxes 12085 14350
Shareholder's Equity 132892 125272
9.09% 11.46%
Return On Assets
Net Income Before Interest And
Taxes 13057 15213
Total Assets 225259 215718
5.80% 7.05%
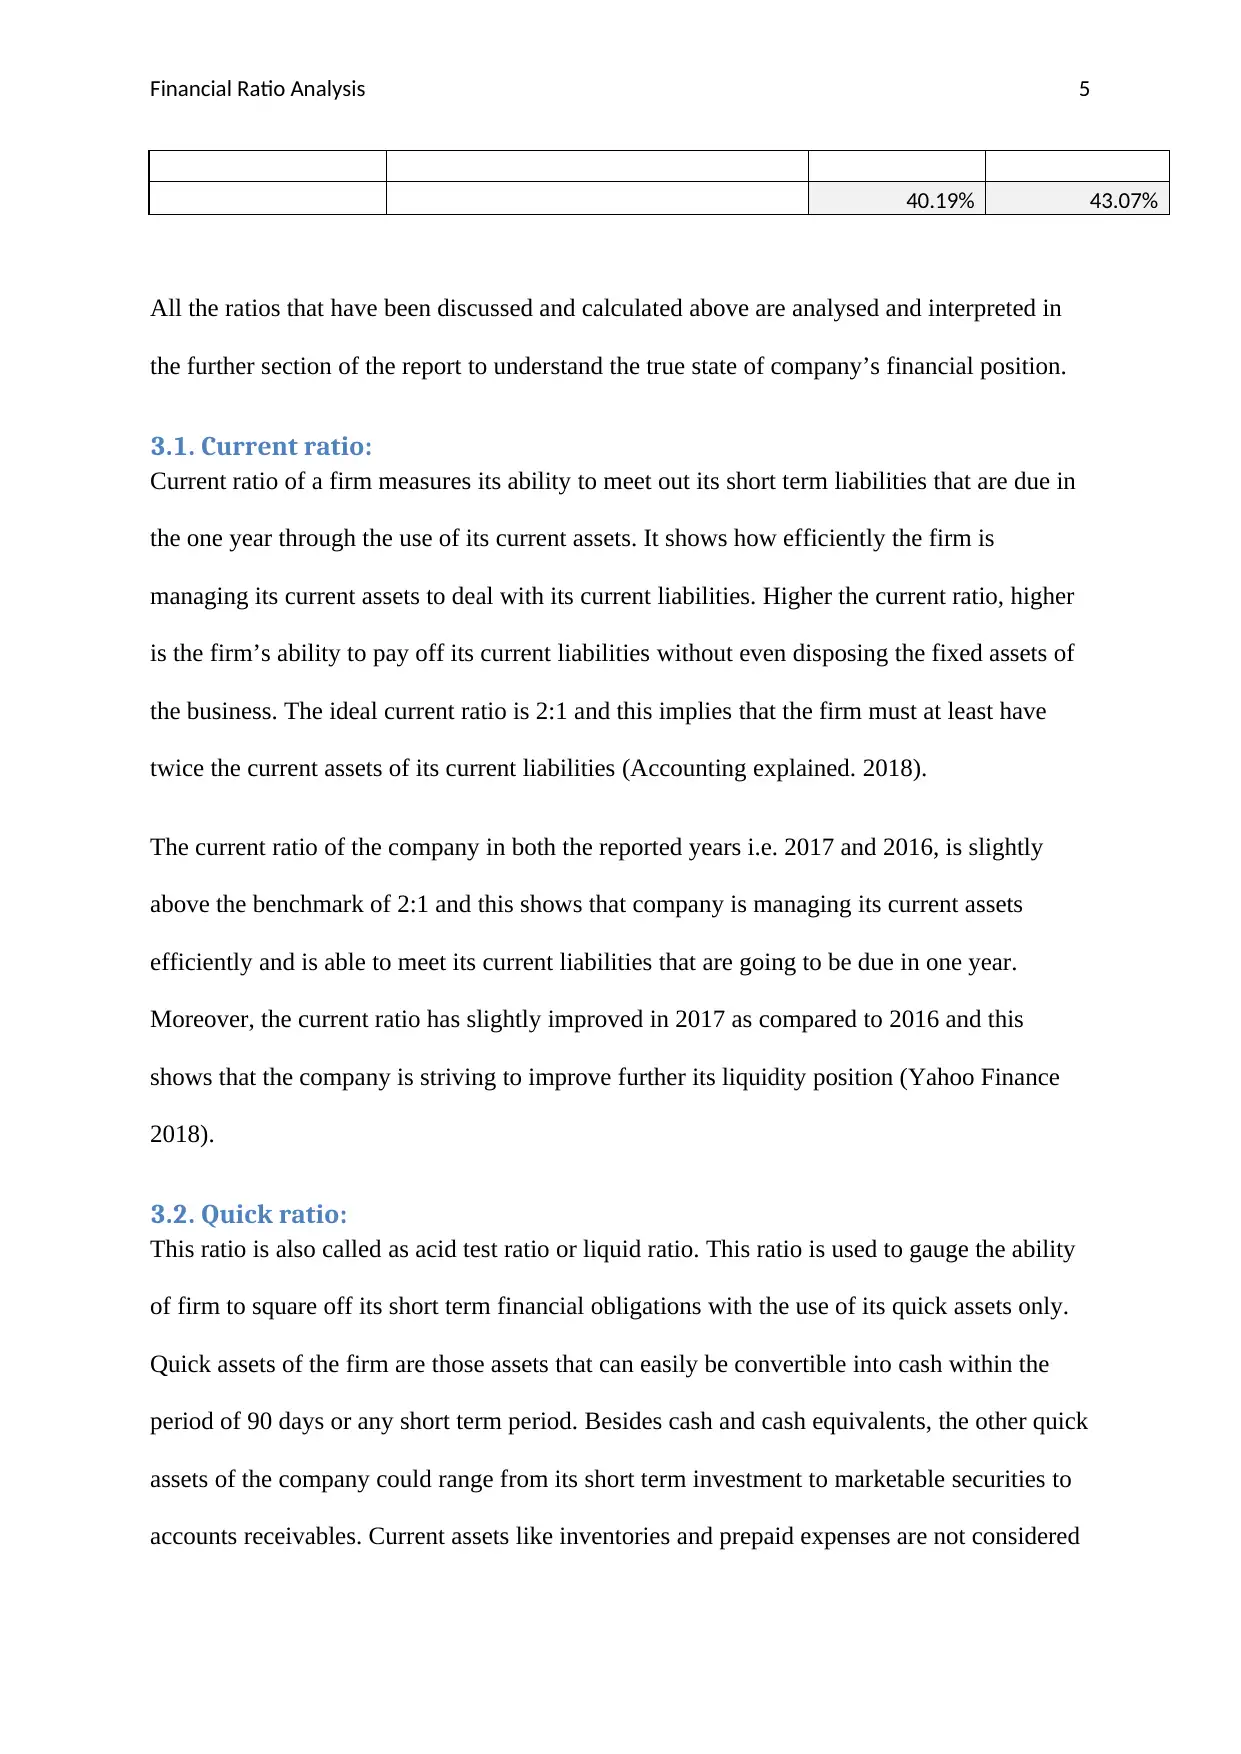
Gross profit Ratio Gross Profit 180535 183160
Net Sales 449180 425217
is ranked at 849th position among the top 2000 corporations in Australia. Carpal operates its
business through various divisions such as manufacturing division, business systems,
aluminium centres and industrial solutions. The manufacturing unit of the company is
operated through various manufacturing sites that are located in multiple places of Australia.
These sites undertake the extrusion and distribution of aluminium products in the Australian
market. The building system of the company provides a wide range of products like windows,
doors, showers, wardrobes etc. Through its trade centres, it provides a wide range of services
such as transportation, geometric extrusions and so on. The industrial solution unit offers
solutions to the company’s customers in the areas of cost and risk analysis.
3.0 Ratio Analysis
Current Ratio Current Assets 180056 171102
Current Liabilities 87415 84348
2.06 2.03
Quick Ratio Quick Assets 102349 95016
Current Liabilities 87415 84348
1.17 1.13
Return On Equity Net Income After Income And Taxes 12085 14350
Shareholder's Equity 132892 125272
9.09% 11.46%
Return On Assets
Net Income Before Interest And
Taxes 13057 15213
Total Assets 225259 215718
5.80% 7.05%
Gross profit Ratio Gross Profit 180535 183160
Net Sales 449180 425217
Financial Ratio Analysis 5
40.19% 43.07%
All the ratios that have been discussed and calculated above are analysed and interpreted in
the further section of the report to understand the true state of company’s financial position.
3.1. Current ratio:
Current ratio of a firm measures its ability to meet out its short term liabilities that are due in
the one year through the use of its current assets. It shows how efficiently the firm is
managing its current assets to deal with its current liabilities. Higher the current ratio, higher
is the firm’s ability to pay off its current liabilities without even disposing the fixed assets of
the business. The ideal current ratio is 2:1 and this implies that the firm must at least have
twice the current assets of its current liabilities (Accounting explained. 2018).
The current ratio of the company in both the reported years i.e. 2017 and 2016, is slightly
above the benchmark of 2:1 and this shows that company is managing its current assets
efficiently and is able to meet its current liabilities that are going to be due in one year.
Moreover, the current ratio has slightly improved in 2017 as compared to 2016 and this
shows that the company is striving to improve further its liquidity position (Yahoo Finance
2018).
3.2. Quick ratio:
This ratio is also called as acid test ratio or liquid ratio. This ratio is used to gauge the ability
of firm to square off its short term financial obligations with the use of its quick assets only.
Quick assets of the firm are those assets that can easily be convertible into cash within the
period of 90 days or any short term period. Besides cash and cash equivalents, the other quick
assets of the company could range from its short term investment to marketable securities to
accounts receivables. Current assets like inventories and prepaid expenses are not considered
⊘ This is a preview!⊘
Do you want full access?
Subscribe today to unlock all pages.
Trusted by 1+ million students worldwide
Financial Ratio Analysis 6
as the quick assets of business as these assets are generally not capable of getting converted
into cash quickly and easily as and when required. Ideally, the company must maintain a
liquid ratio of at least 1:1 (Papadopoulos, 2011).
The quick ratio of Capral Ltd. is also slightly above the ideal ratio and this shows that the
company has adequate quantum of its liquid assets and hence its liquidity position could be
said to be satisfactory.
3.3. Gross profit margin:
This ratio is an important financial metric of measuring the financial performance of the
company in terms of profitability. It is expressed as the percentage terms. Gross profit is the
proportion of company’s earnings that remains after meeting the cost of goods sold in a
particular year (Fridson & Alvarez, 2011). This ratio takes into account the expenses that are
incurred in the business only to undertake the core business activities i.e. the purchase and
sale of raw material and finished goods. It does not take into account the operating expenses
of the business such as depreciation, finance cost, occupancy cost etc. Though, there is no
standard gross profit ratio but the company must at least have 25% of its GP ratio.
The profitability position of the company has been identified using the gross profits, return on
equity and return on assets. All the three ratios have depicted that the profitability position of
the company has declined in 2017 when compared to that of 2016. However, the Gross profit
ratio of the company in 2017 is satisfactory enough in both the years. The current GP ratio of
40.19% shows that the earnings that remains with the company after meeting its cost of basic
operations is 40.19% of the total revenue of the company.
3.4. Return on Equity:
It is the profitability ratio that measures the quantum of net profits earned during the course
of the business using the funds invested by the shareholders of the company. Higher the
return on equity ratio, stronger is the profitability position of the company. Return on equity
Paraphrase This Document
Need a fresh take? Get an instant paraphrase of this document with our AI Paraphraser
Financial Ratio Analysis 7
shows the efficiency of the company in utilising the funds of its shareholders for the purpose
of generating returns (Wang & Zhou, 2016). The declining return on equity ratio shows that
the company in 2017 is not able to generate as much returns as it earned in 2016 because of
its inefficiency to use the funds invested by its shareholders (Capral Aluminium, 2017).
3.5. Return on Assets:
It is the income generated by the business from the appropriate deployment of its total assets.
Higher return on assets ratio shows the company’s efficiency in utilising its total assets of the
business for the purpose of producing profits (Tracy, 2012).
Even the return on asset ratio has been declined in 2017 as compared to 2016 and this shows
that the company must not have utilised its total assets in such a way that would have allowed
it to earn higher returns as the income of business (IBIS World, 2017). Though, there is no
standard rate prescribed for the ideal return on assets and return on equity ratio but as the
general investor tendency, higher ROE and ROA percentages are preferred by them because
it shows the return potential of the company.
4.0. Analysis and Comparison using the Inventory Ratio
In order to evaluate the company’s performance in terms of asset efficiency, the days
inventory ratio of Capral Ltd. is calculated and this ratio is compared with that of Rio Tinto
Inc. which is also an Australian company and is a leading corporation that is engaged in the
business of mining and extracting aluminium products (Yahoo Finance, 2018). The company
is the global leader in the aluminium product refining. The inventory turnover ratio of the
company has been calculated for the purpose of calculating the inventory day’s ratio
(Accounting explained, 2013). The days inventory ratio of the company shows the number of
days that the firm will take to sell of all its inventory that is held for the purpose of sale only
during the course of business. The days inventory ratio of Carpal is 107 days however that of
Financial Ratio Analysis 8
Rio Tinto is just 47 days. This shows that Rio Tinto is managing its inventory more
efficiently than Carpal Ltd as the former company is able to sell its inventories in the time
that is quite lower than that of Rio Tinto. Inventory is an important element of the business
that requires proper management in order to carry out business in the most smooth and
effective way so that proper flow of cash by way of timely conversion of inventory into sales.
The management of Carpal Ltd. must make efforts to minimise its days inventory ratio so as
to control its cost of carrying inventories.
5.0. Conclusion:
From the above ratio analysis, it can be concluded that the company’s financial performance
in terms of profitability has degraded in 2017 as compared to 2016 but its liquidity position is
satisfactory. Further, the inventory management practices of the company are not as adequate
as its competitors and hence the company must strive to improve these practices.
⊘ This is a preview!⊘
Do you want full access?
Subscribe today to unlock all pages.
Trusted by 1+ million students worldwide
Financial Ratio Analysis 9
References:
Accounting explained. 2013. Financial Ratio Analysis. Available at:
https://accountingexplained.com/financial/ratios/ accessed on 05.08.2018.
Accounting tools. 2018. Ratio Analysis. Available at:
https://www.accountingtools.com/articles/ratio-analysis.html accessed on 05.08.2018
Bloomberg (2018) Company Overview of Capral Limited [online]. Available from
https://www.bloomberg.com/research/stocks/private/snapshot.asp?privcapId=874819
accessed on 05.08.2018.
Capral Aluminium (2017) Annual Report . Available from
http://member.afraccess.com/media?id=CMN://2A1069260&filename=20180306/
CAA_01958748.pdf accessed on 05.08.2018.
Fridson, M.S., and Alvarez, F. (2011) Financial Statement Analysis: A Practitioner's Guide
4th ed. U.S: John Wiley & Sons.
IBIS World (2017) Capral Limited - Premium Company Report Australia [online]. Available
from https://www.ibisworld.com.au/australian-company-research-reports/manufacturing/
capral-limited-company.html accessed on 05.08.2018.
Papadopoulos, P. 2011. Investment Report - Fundamental Analysis/ Ratio Analysis. GRIN
Verlag.
Rio Tinto (2017) Annual Report . Available from
https://www.riotinto.com/documents/RT_2017_Annual_Report.pdf accessed on 05.08.2018.
Tracy, A. (2012) Ratio Analysis Fundamentals: How 17 Financial Ratios Can Allow You to
Analyse Any Business on the Planet 1st ed. RatioAnalysis.net
Paraphrase This Document
Need a fresh take? Get an instant paraphrase of this document with our AI Paraphraser

Financial Ratio Analysis 10
Tracy, A. 2012. Ratio Analysis Fundamentals: How 17 Financial Ratios Can Allow You to
Analyse Any Business on the Planet. RatioAnalysis.net.
Wang, D., and Zhou, F. (2016) The Application of Financial Analysis in Business
Management. Journal of Business and Management, 4(2016), 471-475.
Yahoo Finance (2018) Rio Tinto plc (RIO) . Available from
https://finance.yahoo.com/quote/RIO/ accessed on 05.08.2018.
1 out of 11
Related Documents


Your All-in-One AI-Powered Toolkit for Academic Success.
+13062052269
info@desklib.com
Available 24*7 on WhatsApp / Email
![[object Object]](/_next/static/media/star-bottom.7253800d.svg)
Unlock your academic potential
Copyright © 2020–2026 A2Z Services. All Rights Reserved. Developed and managed by ZUCOL.