In-Depth Financial Analysis: Company X Ratio & Performance Report
VerifiedAdded on 2023/06/12
|21
|3291
|59
Homework Assignment
AI Summary
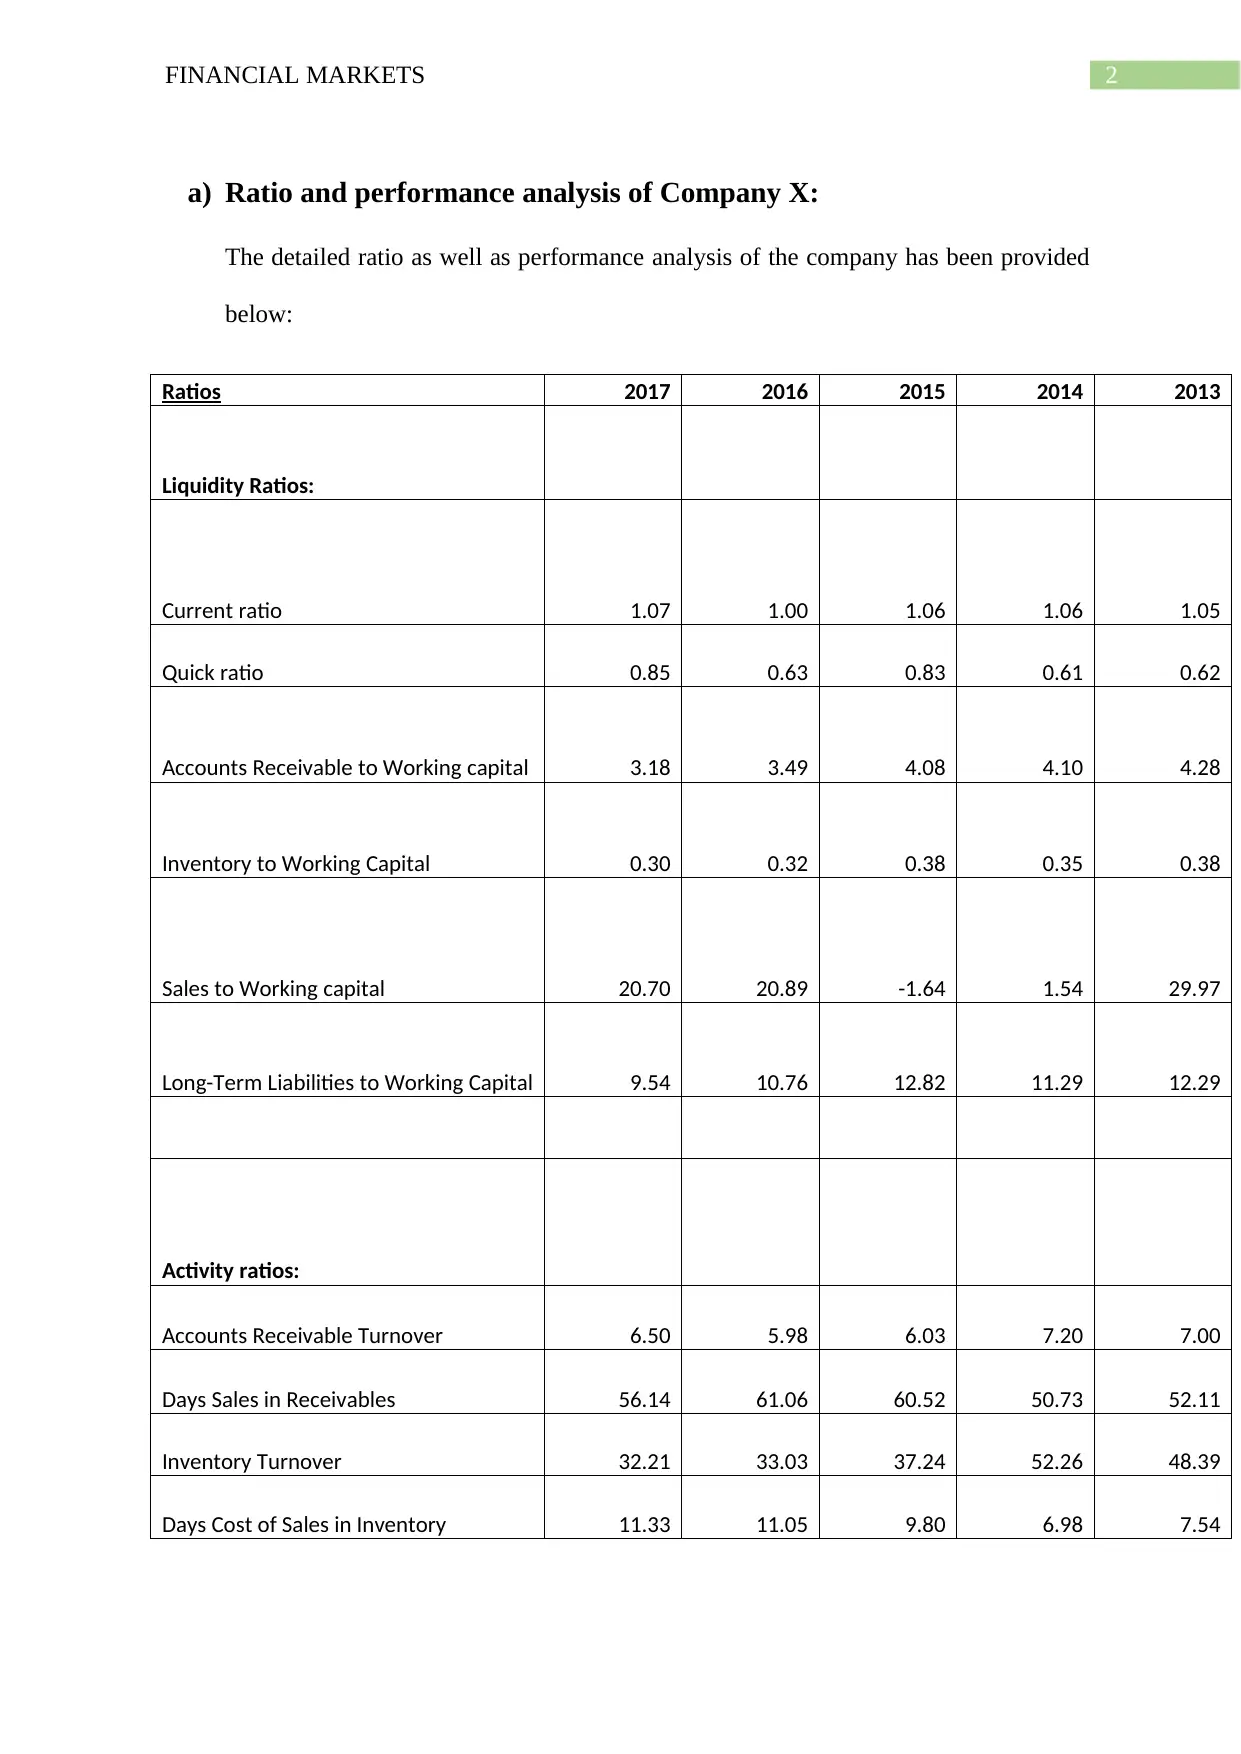
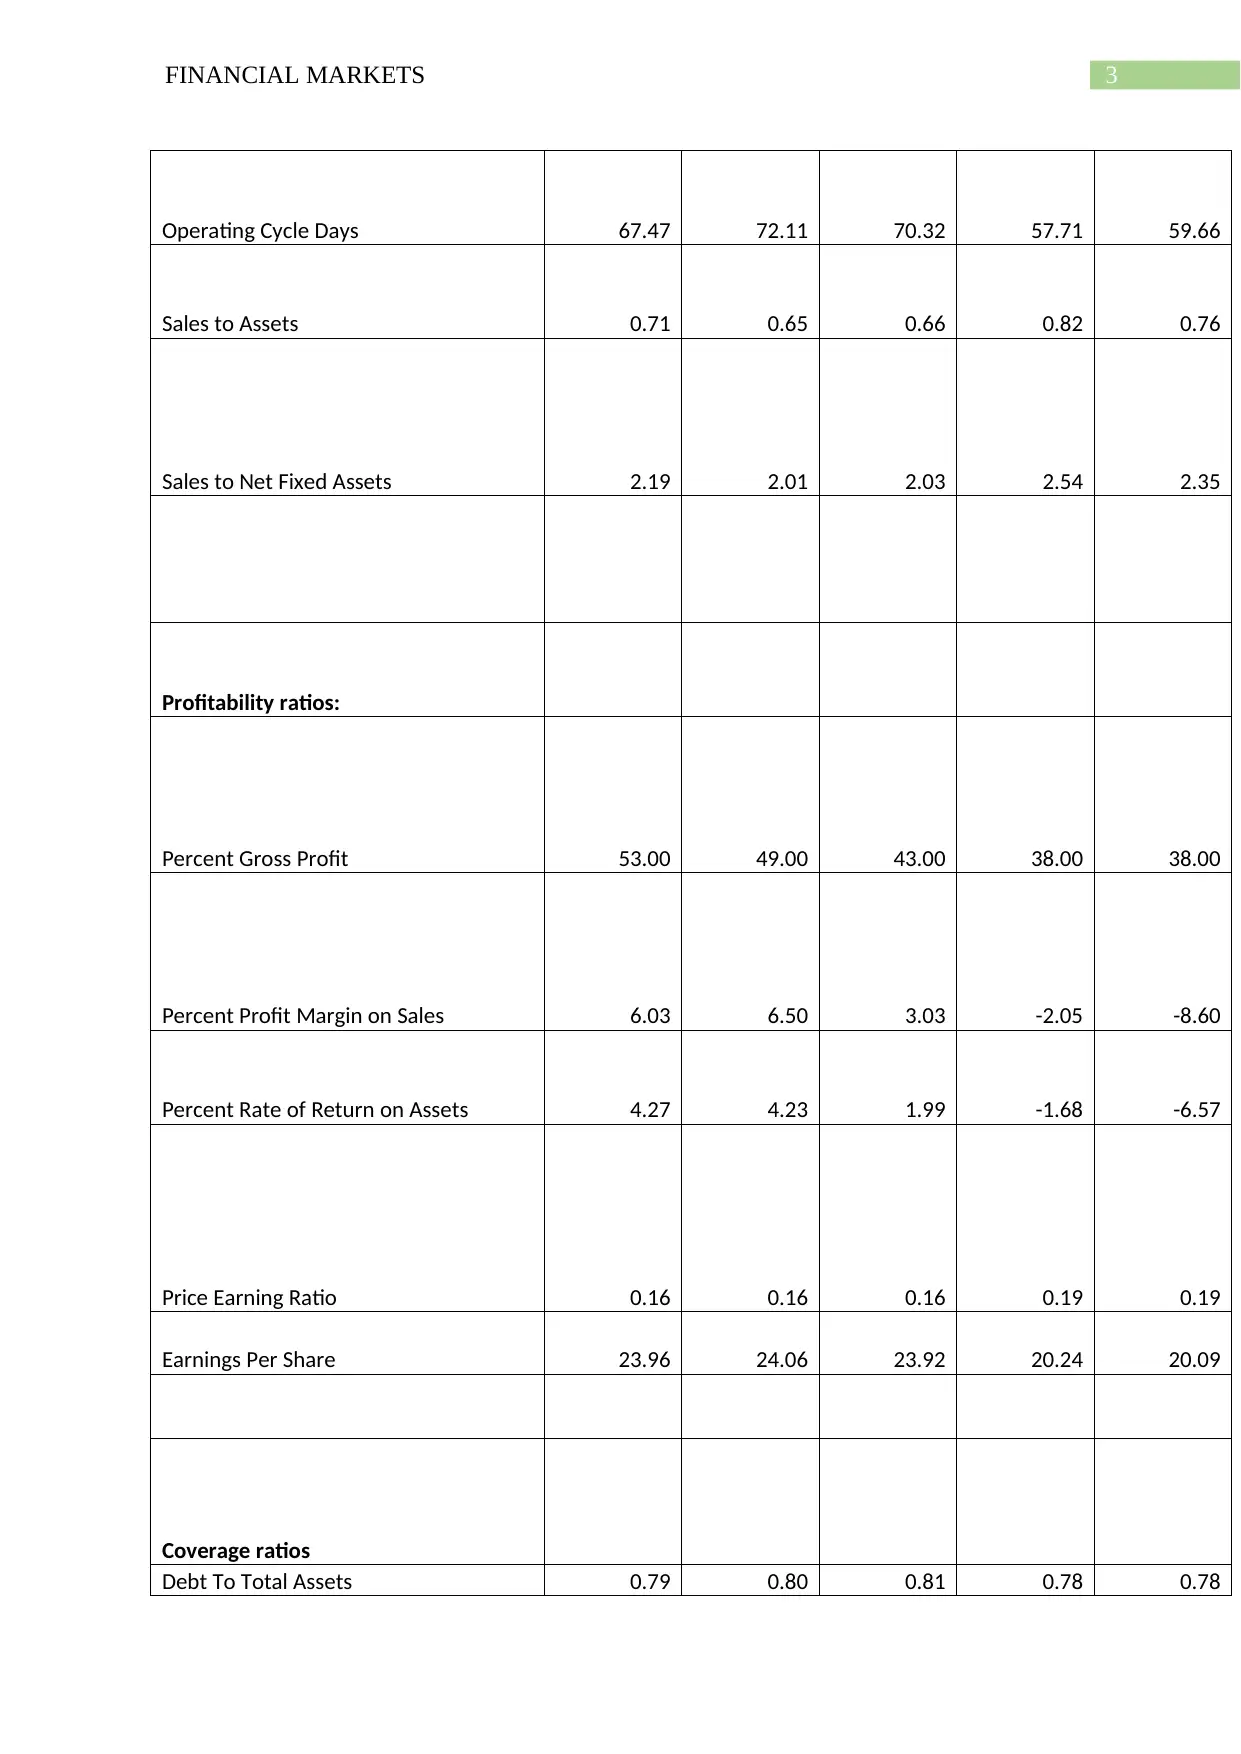
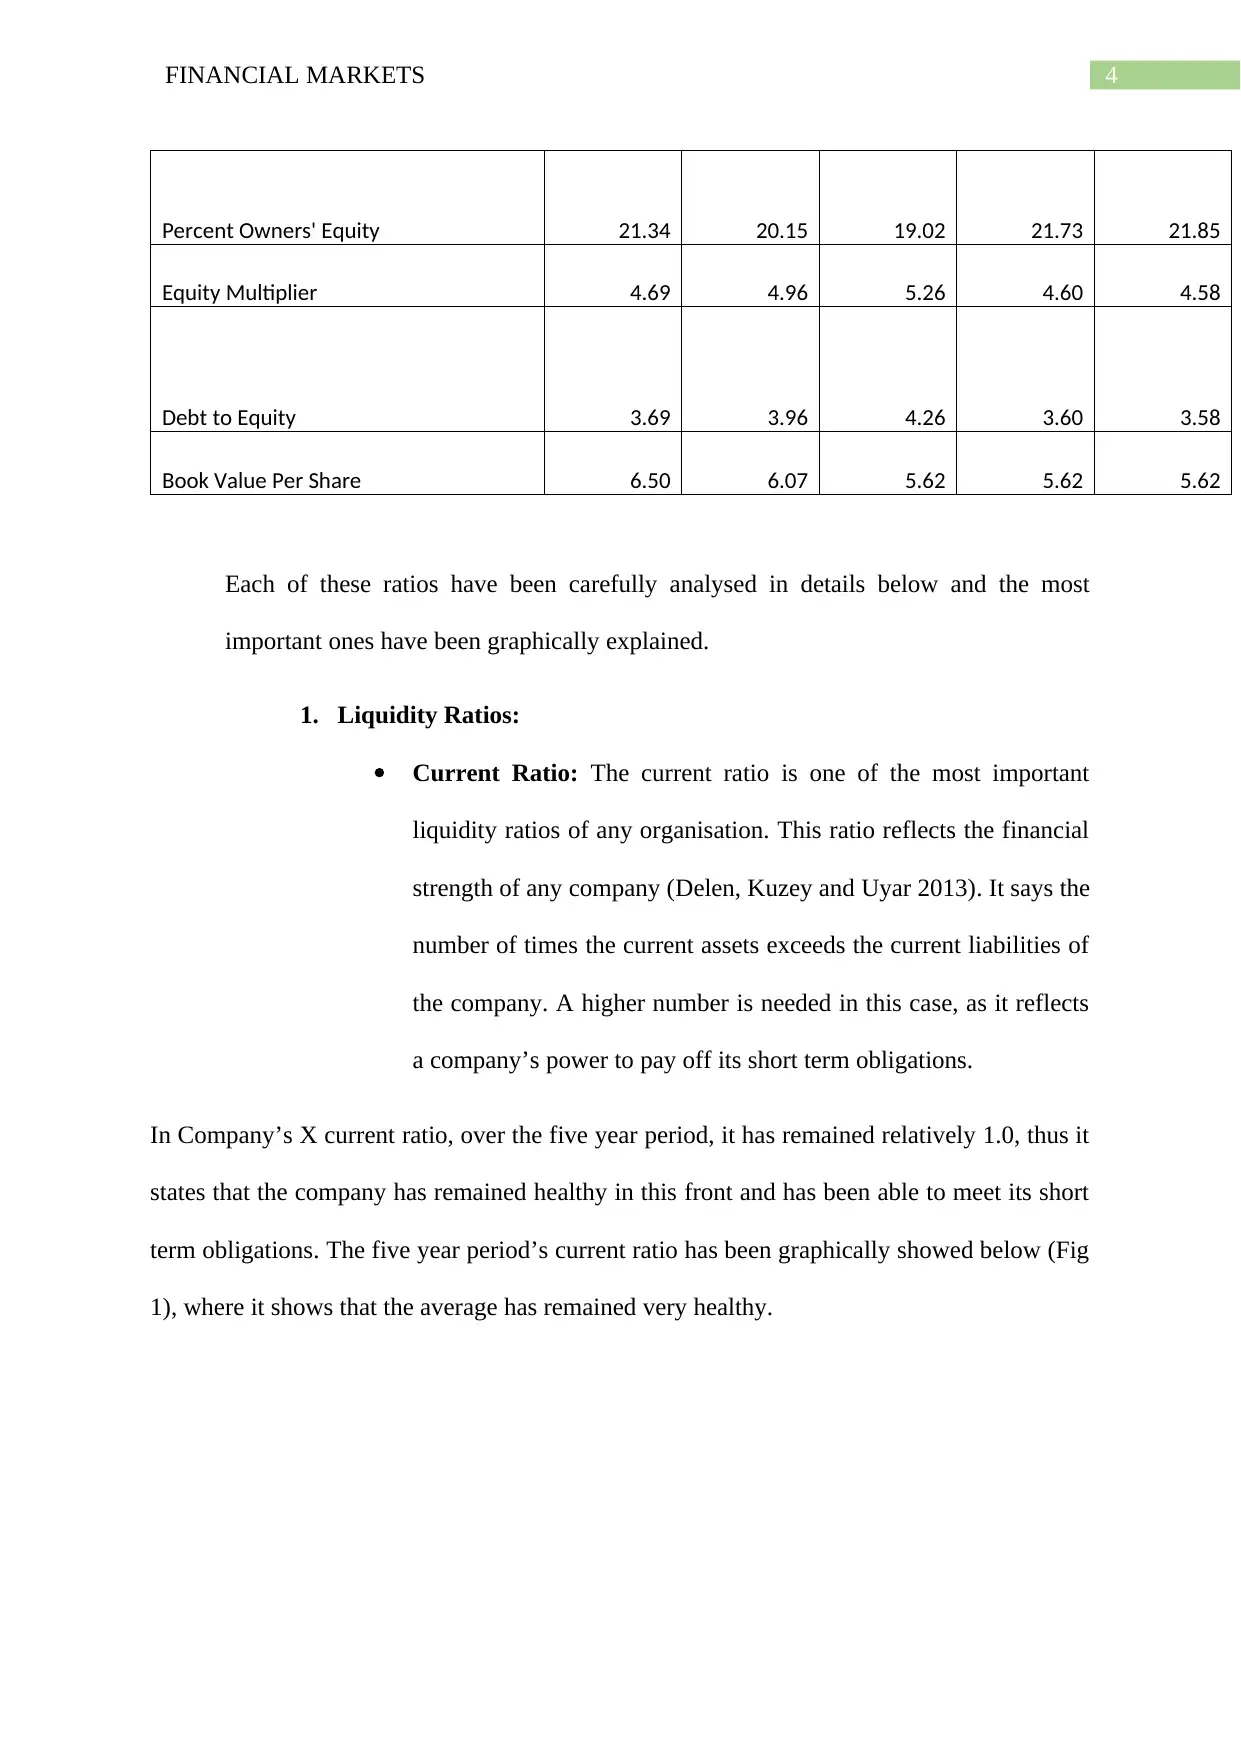
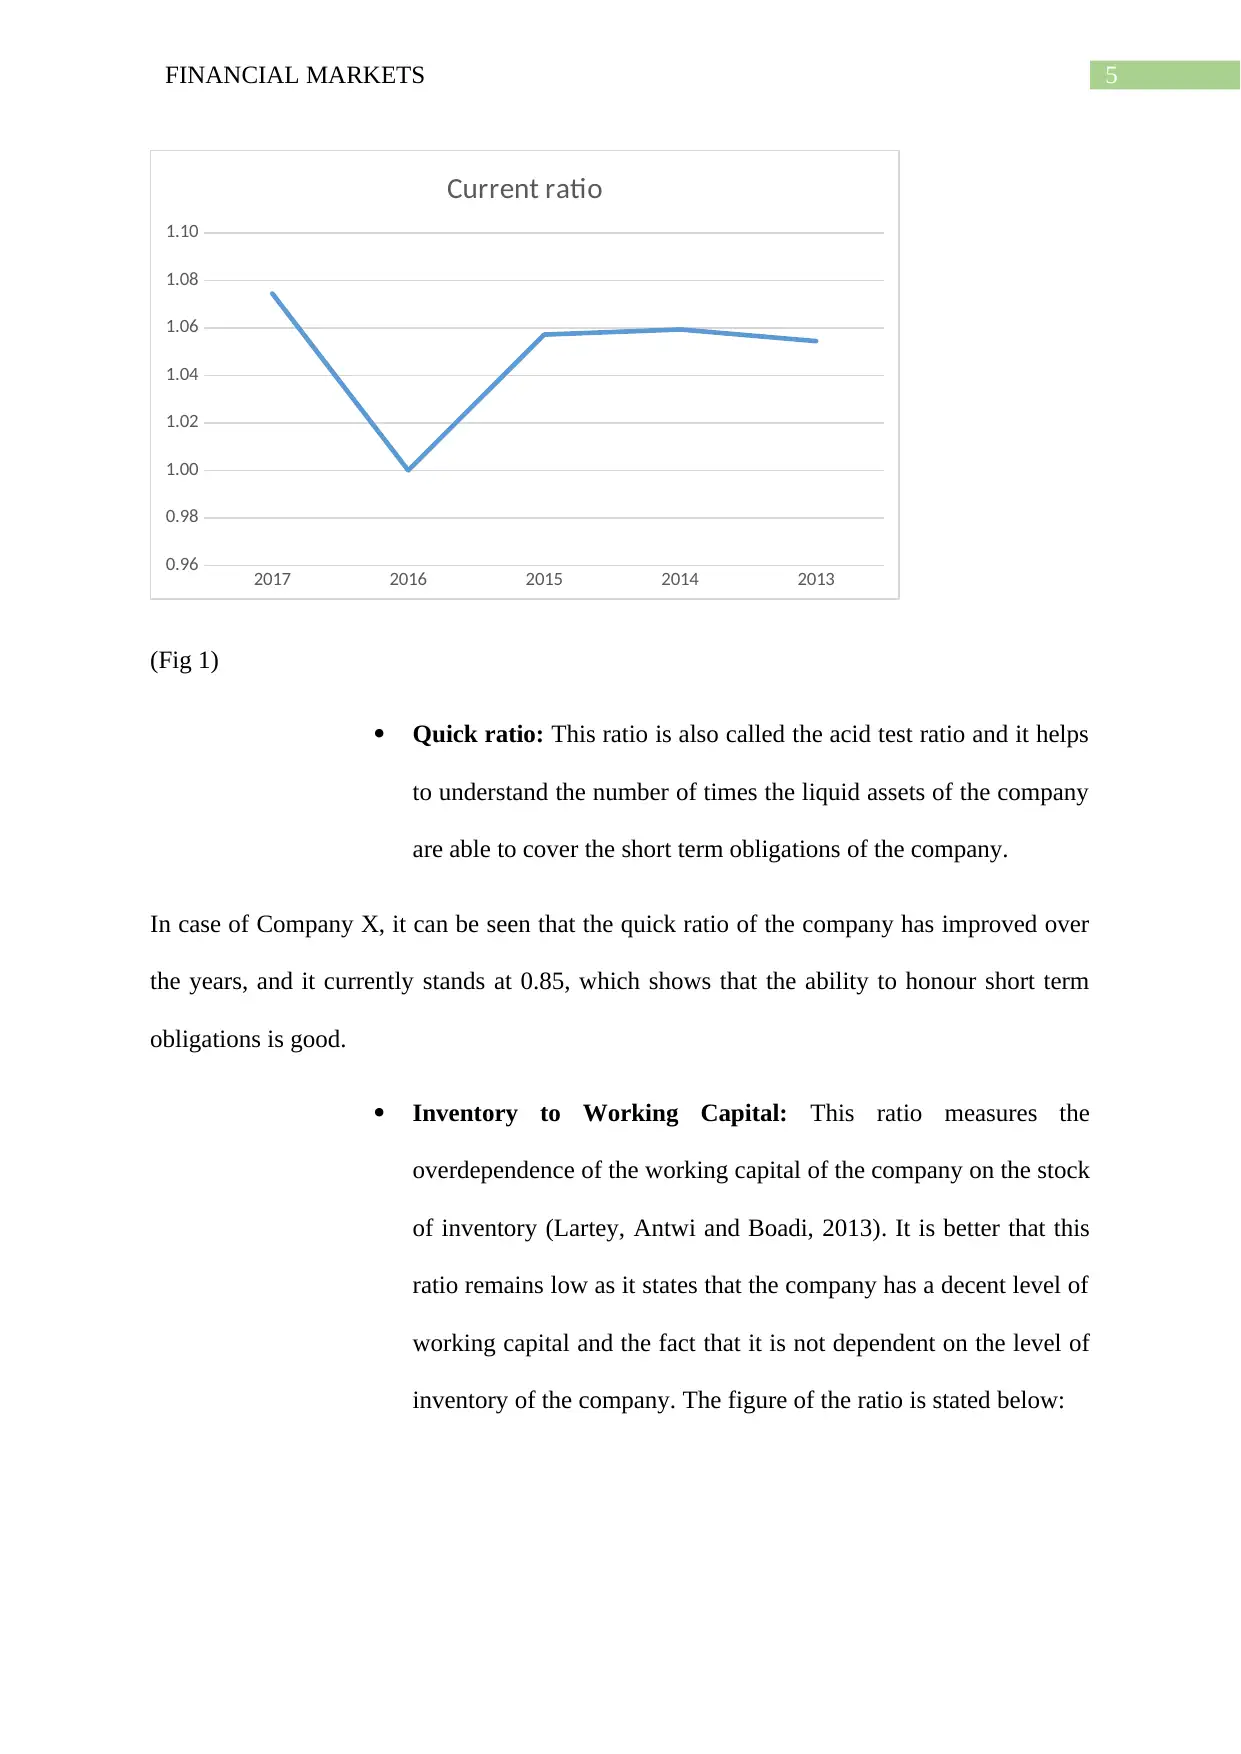
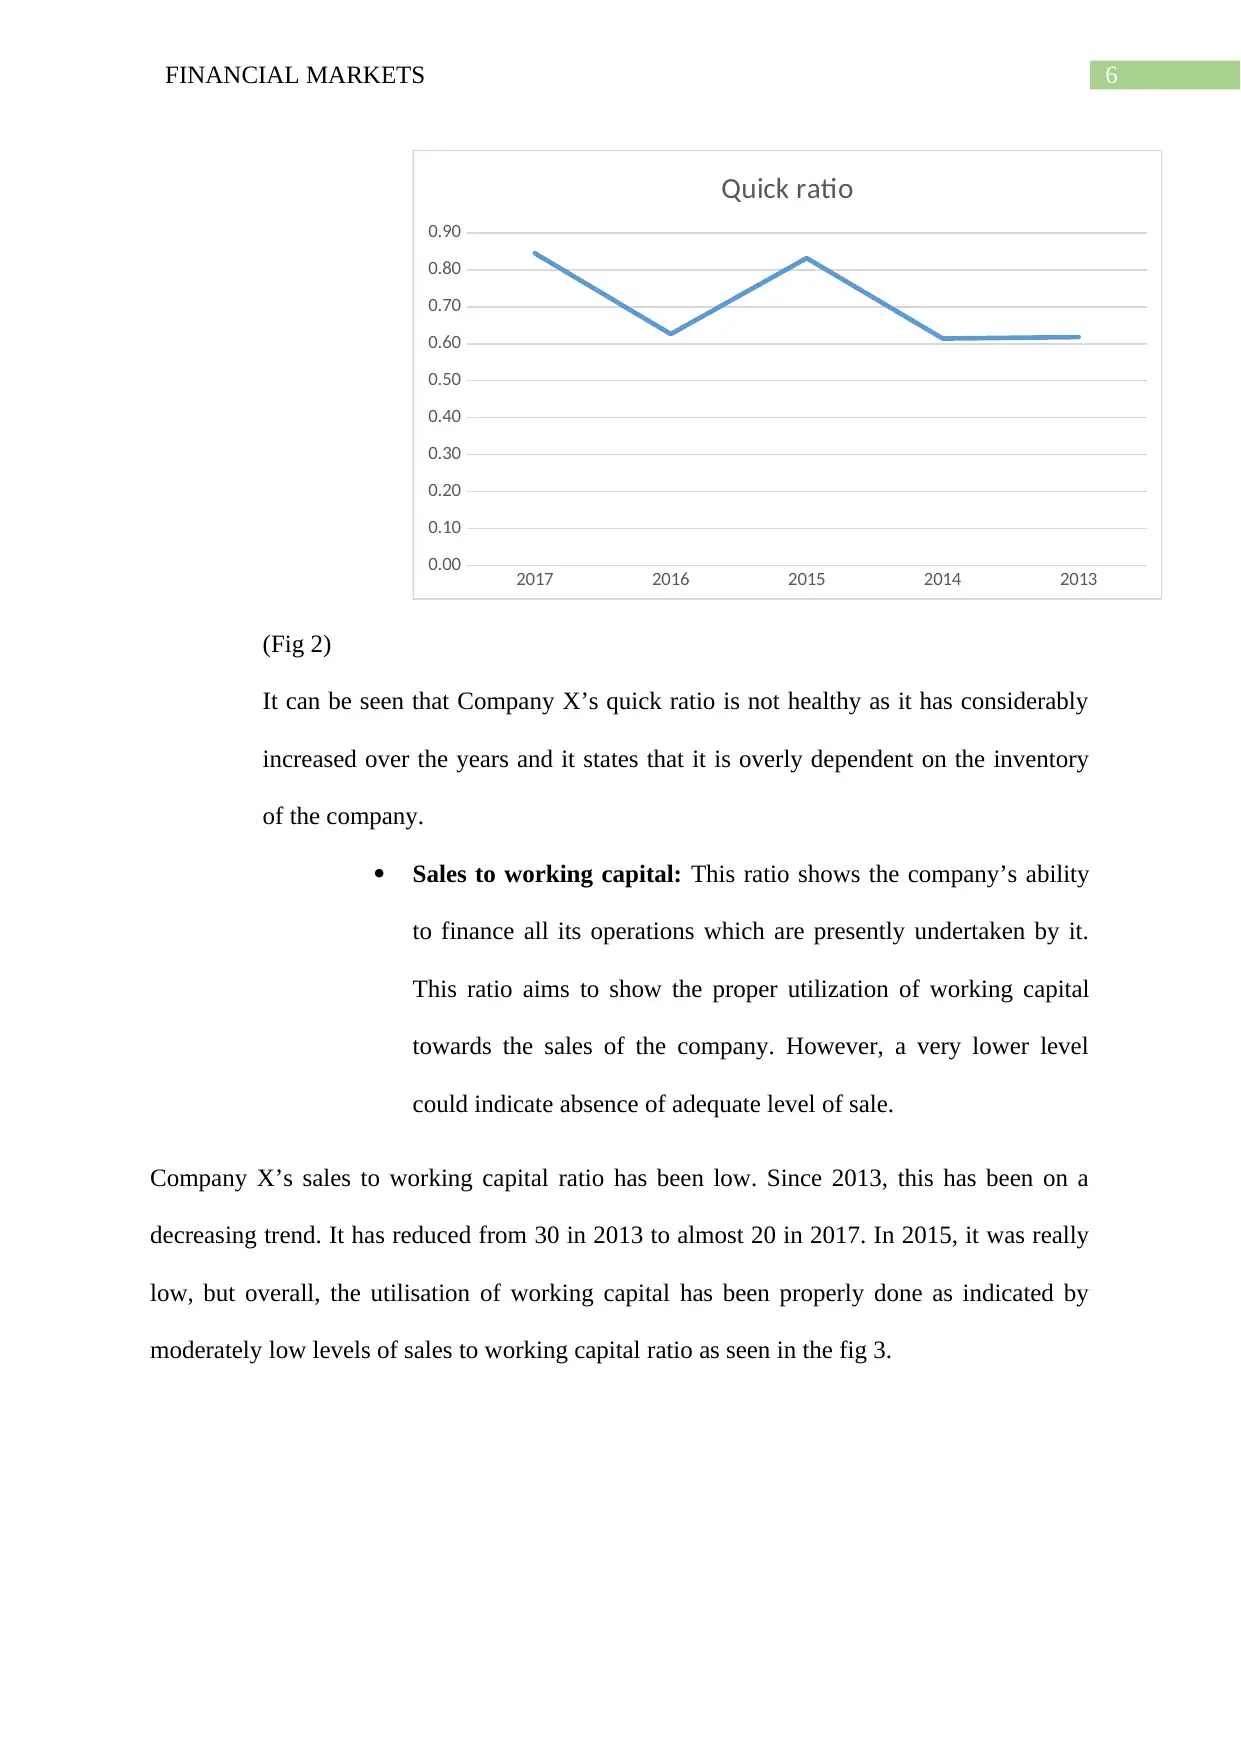
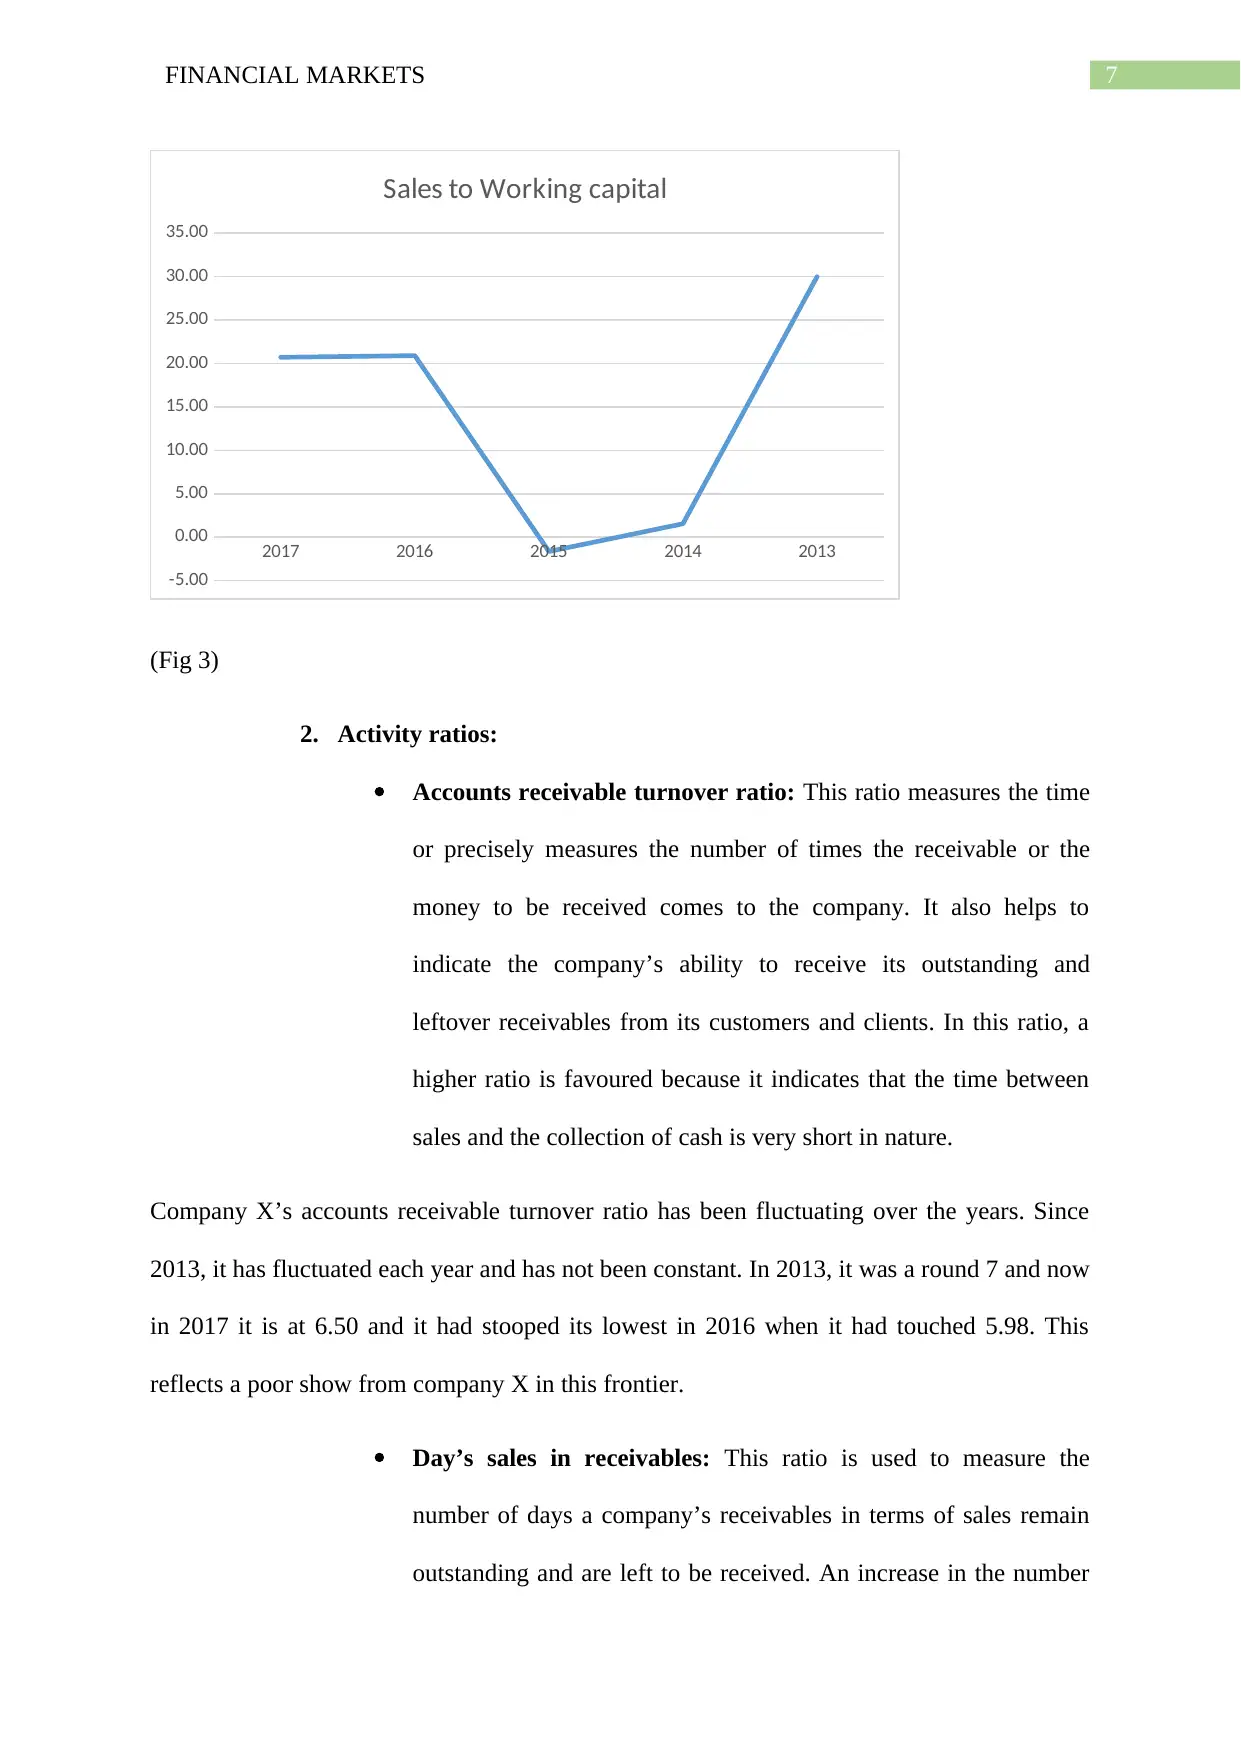
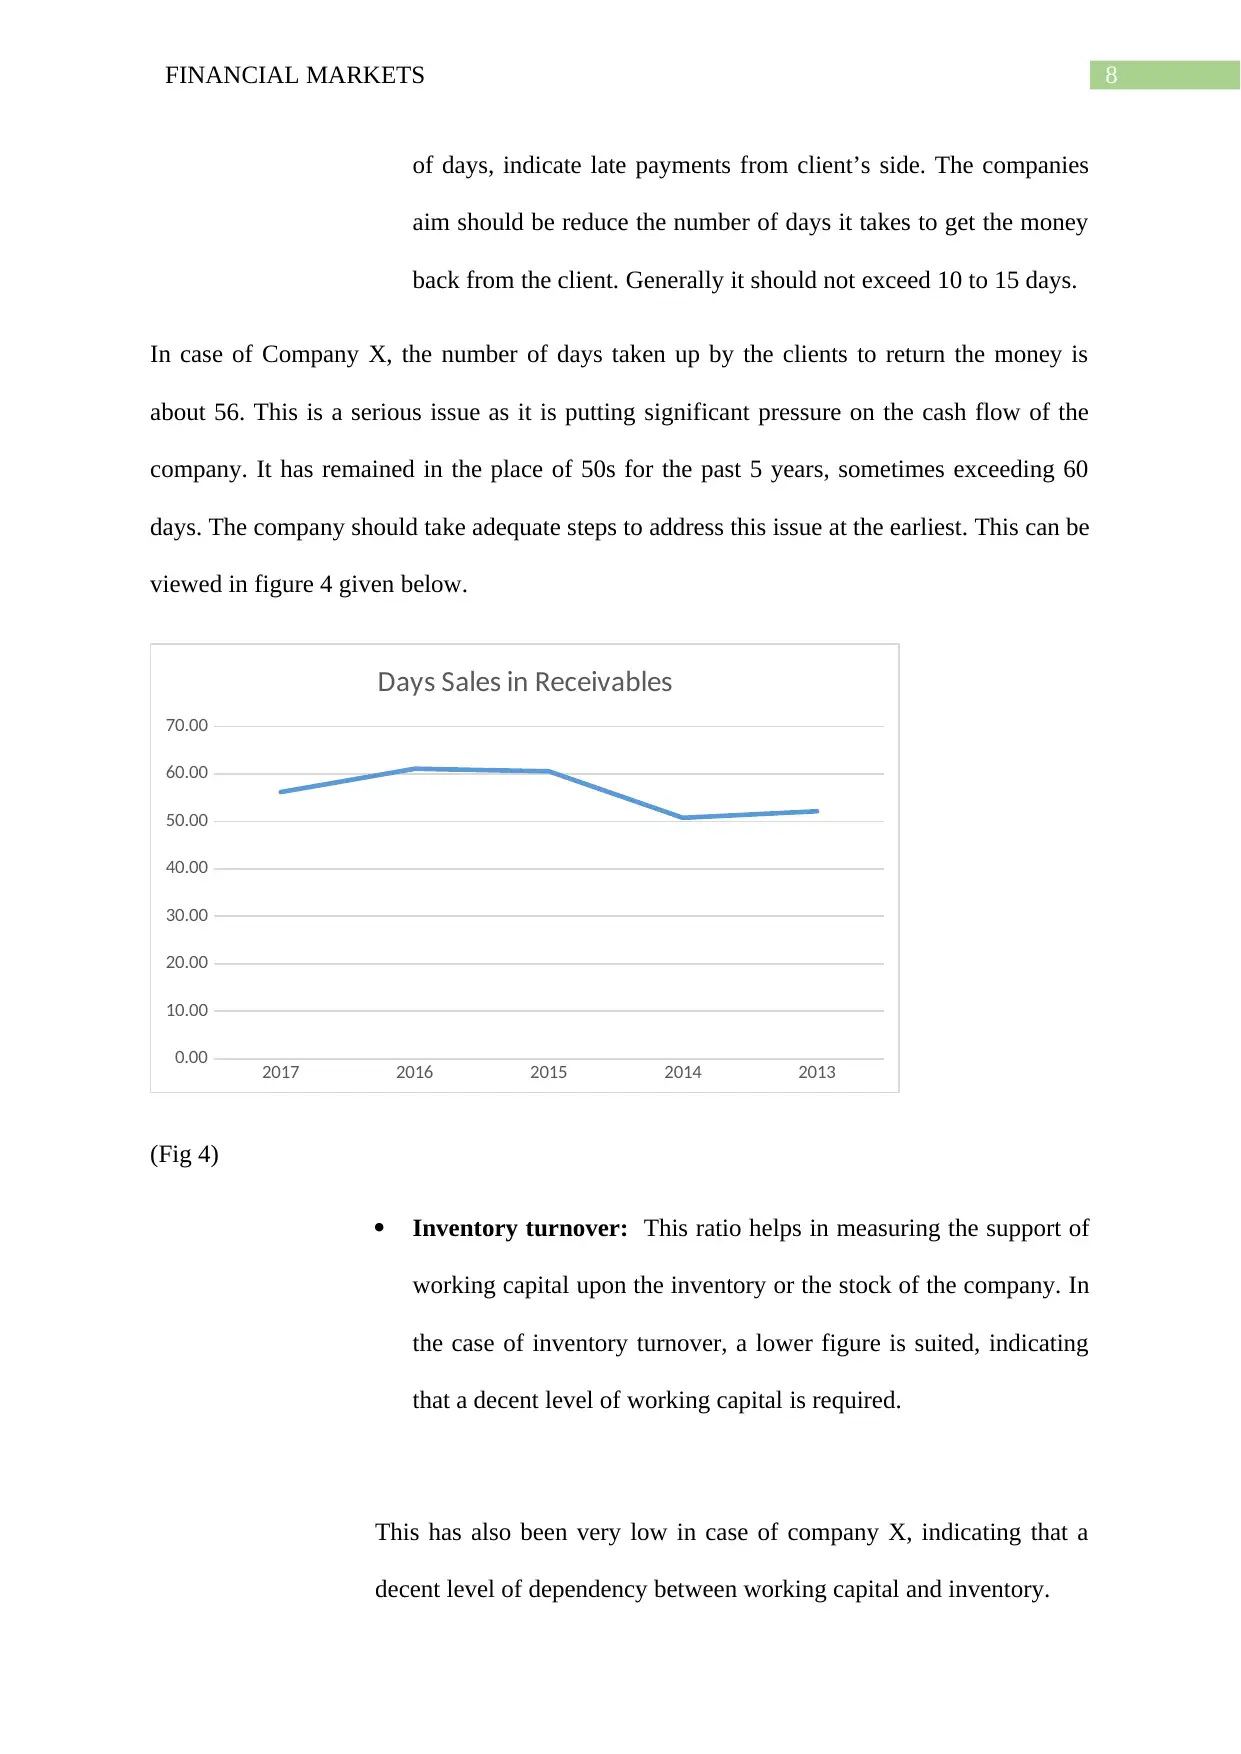
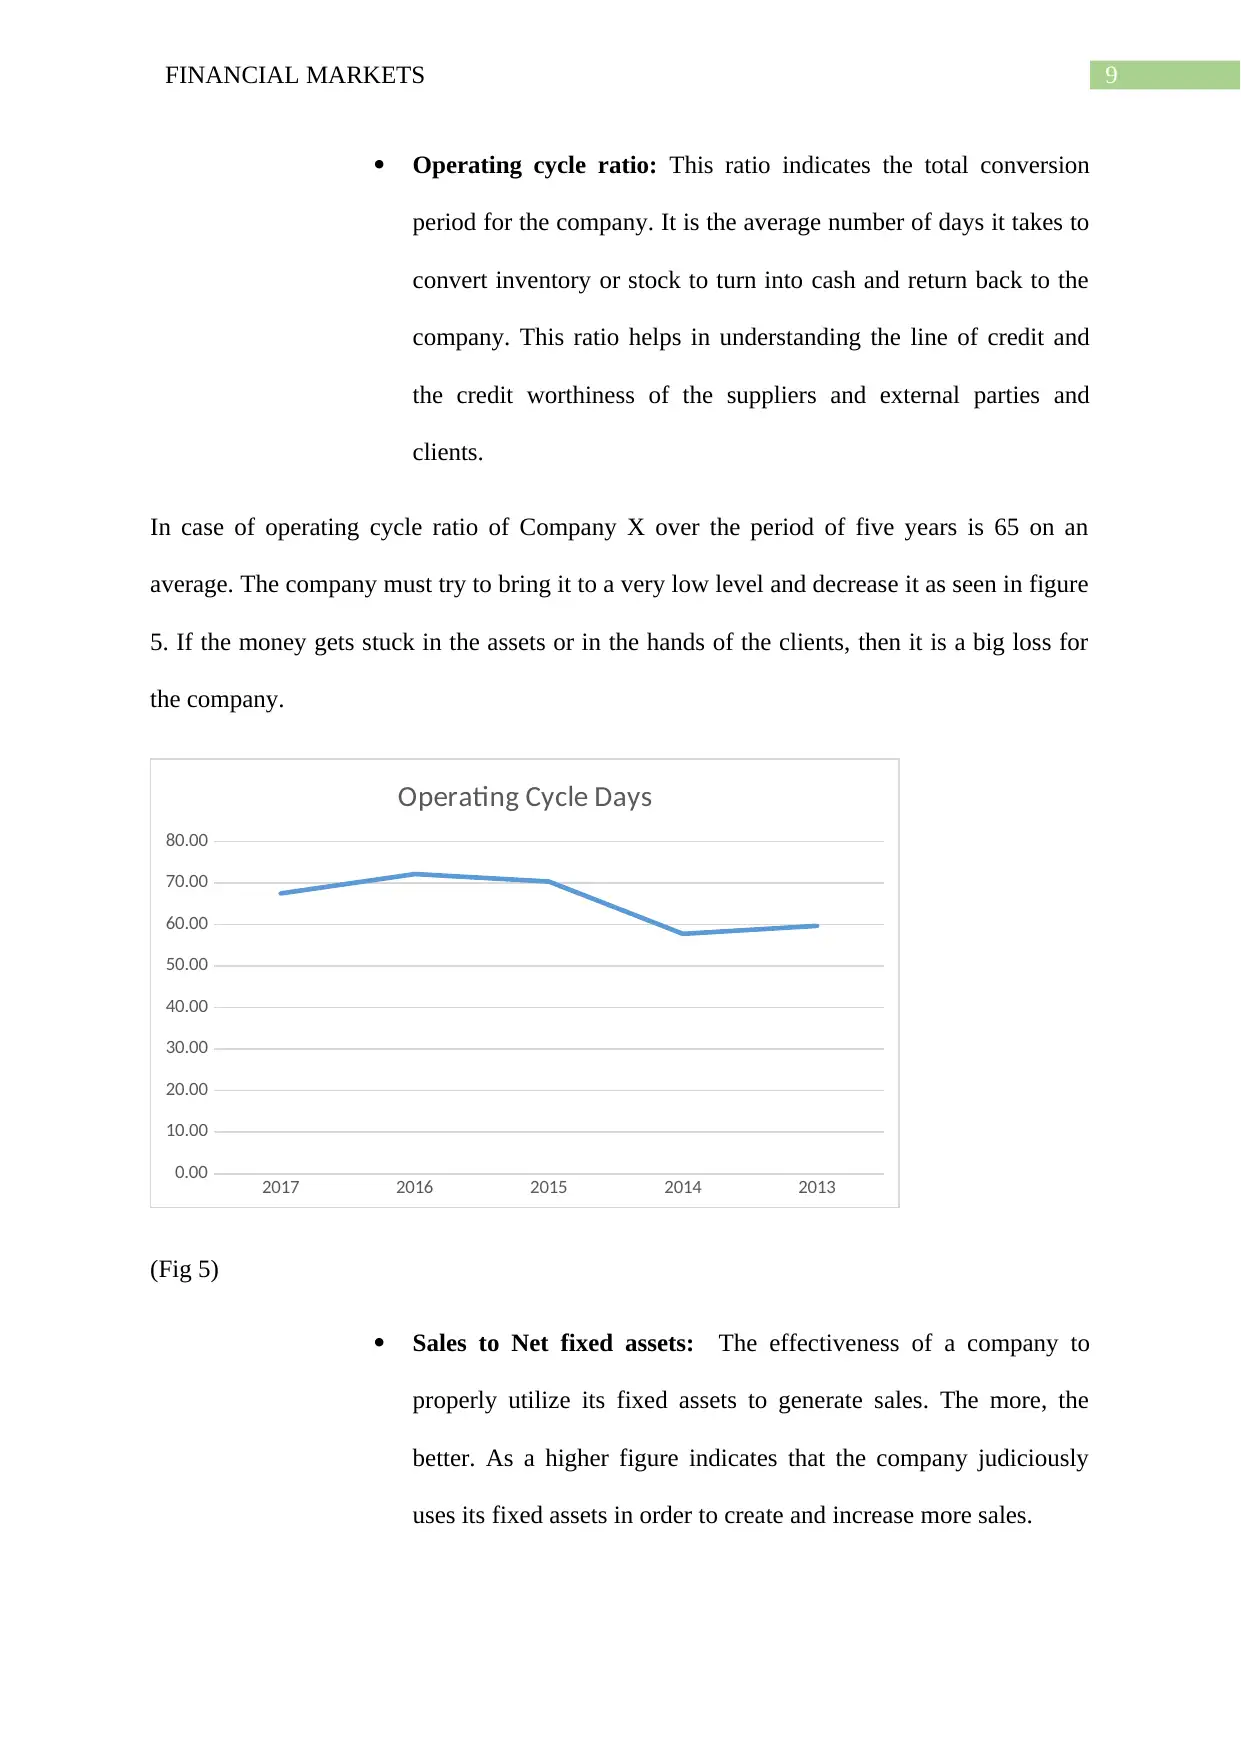
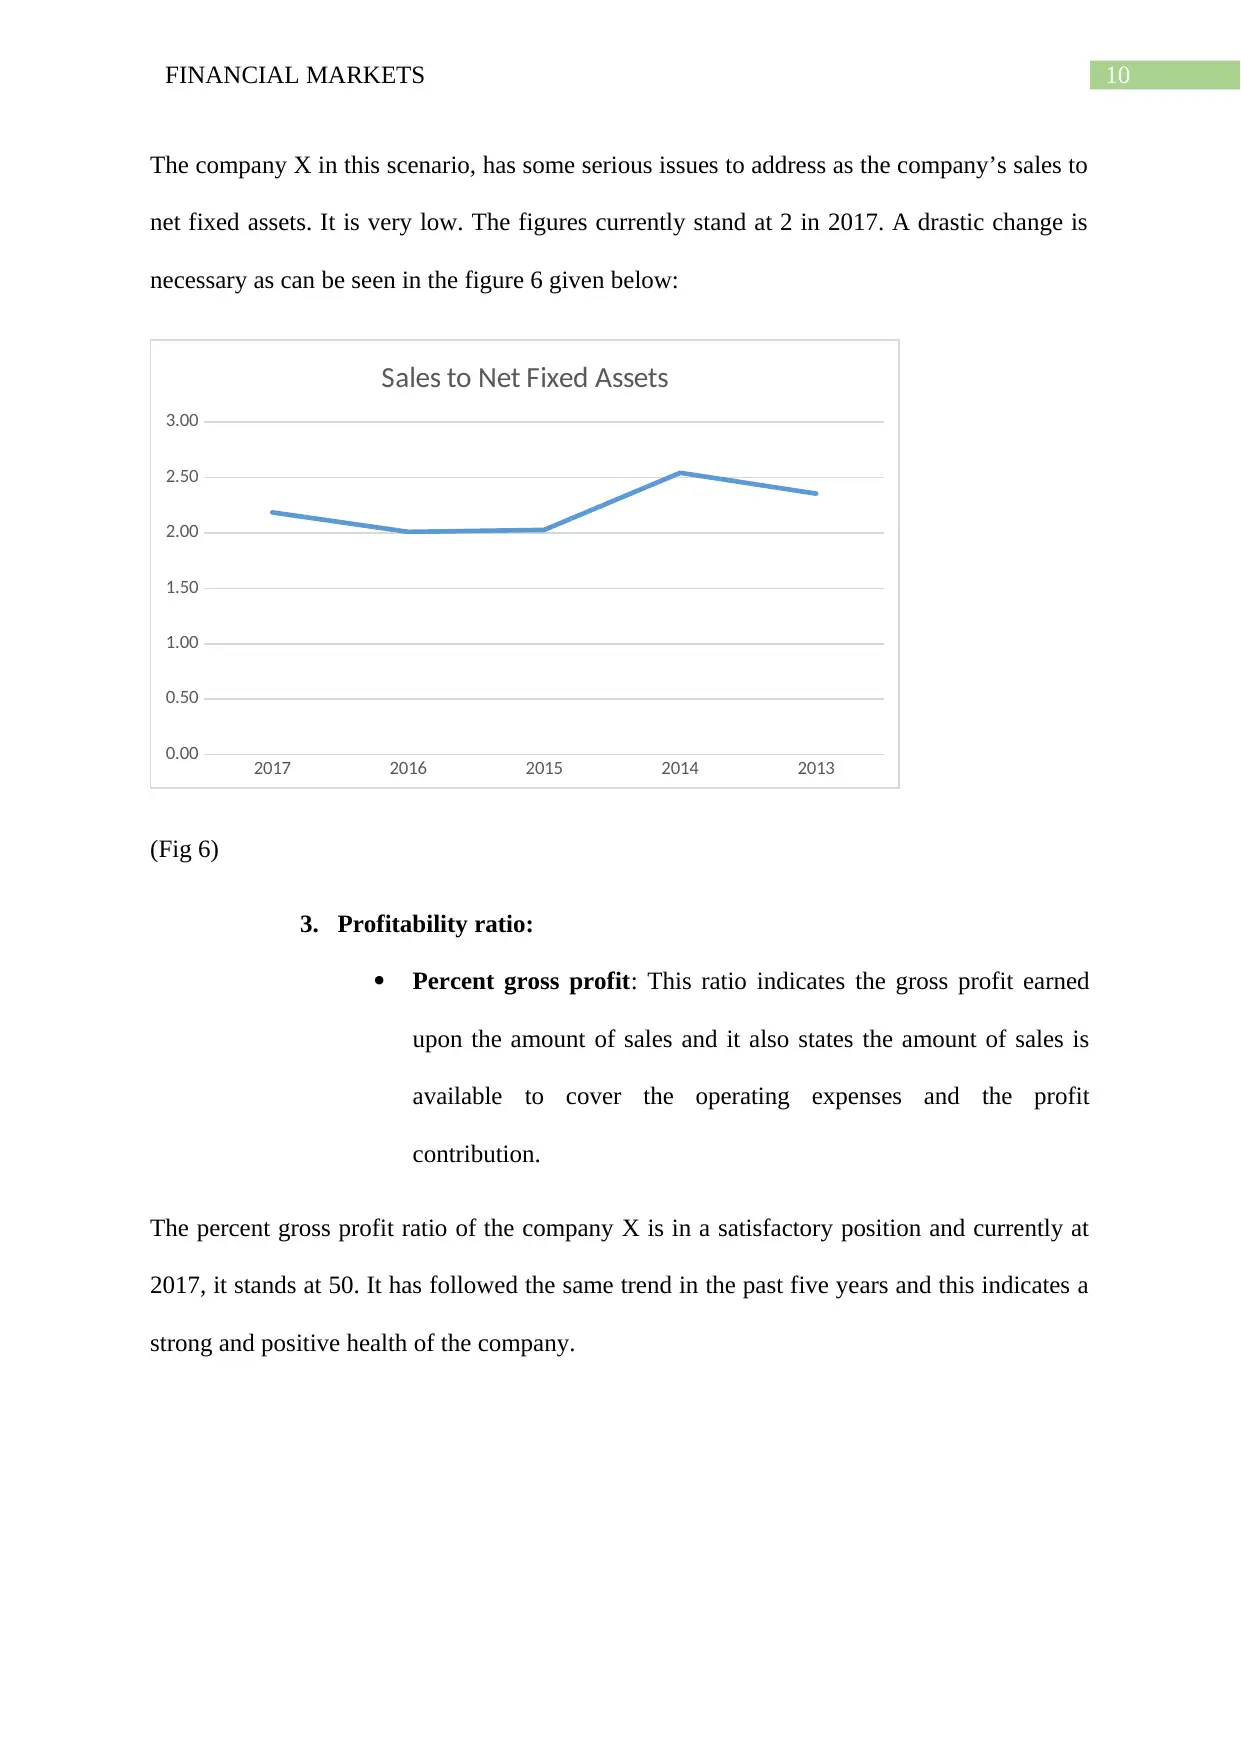
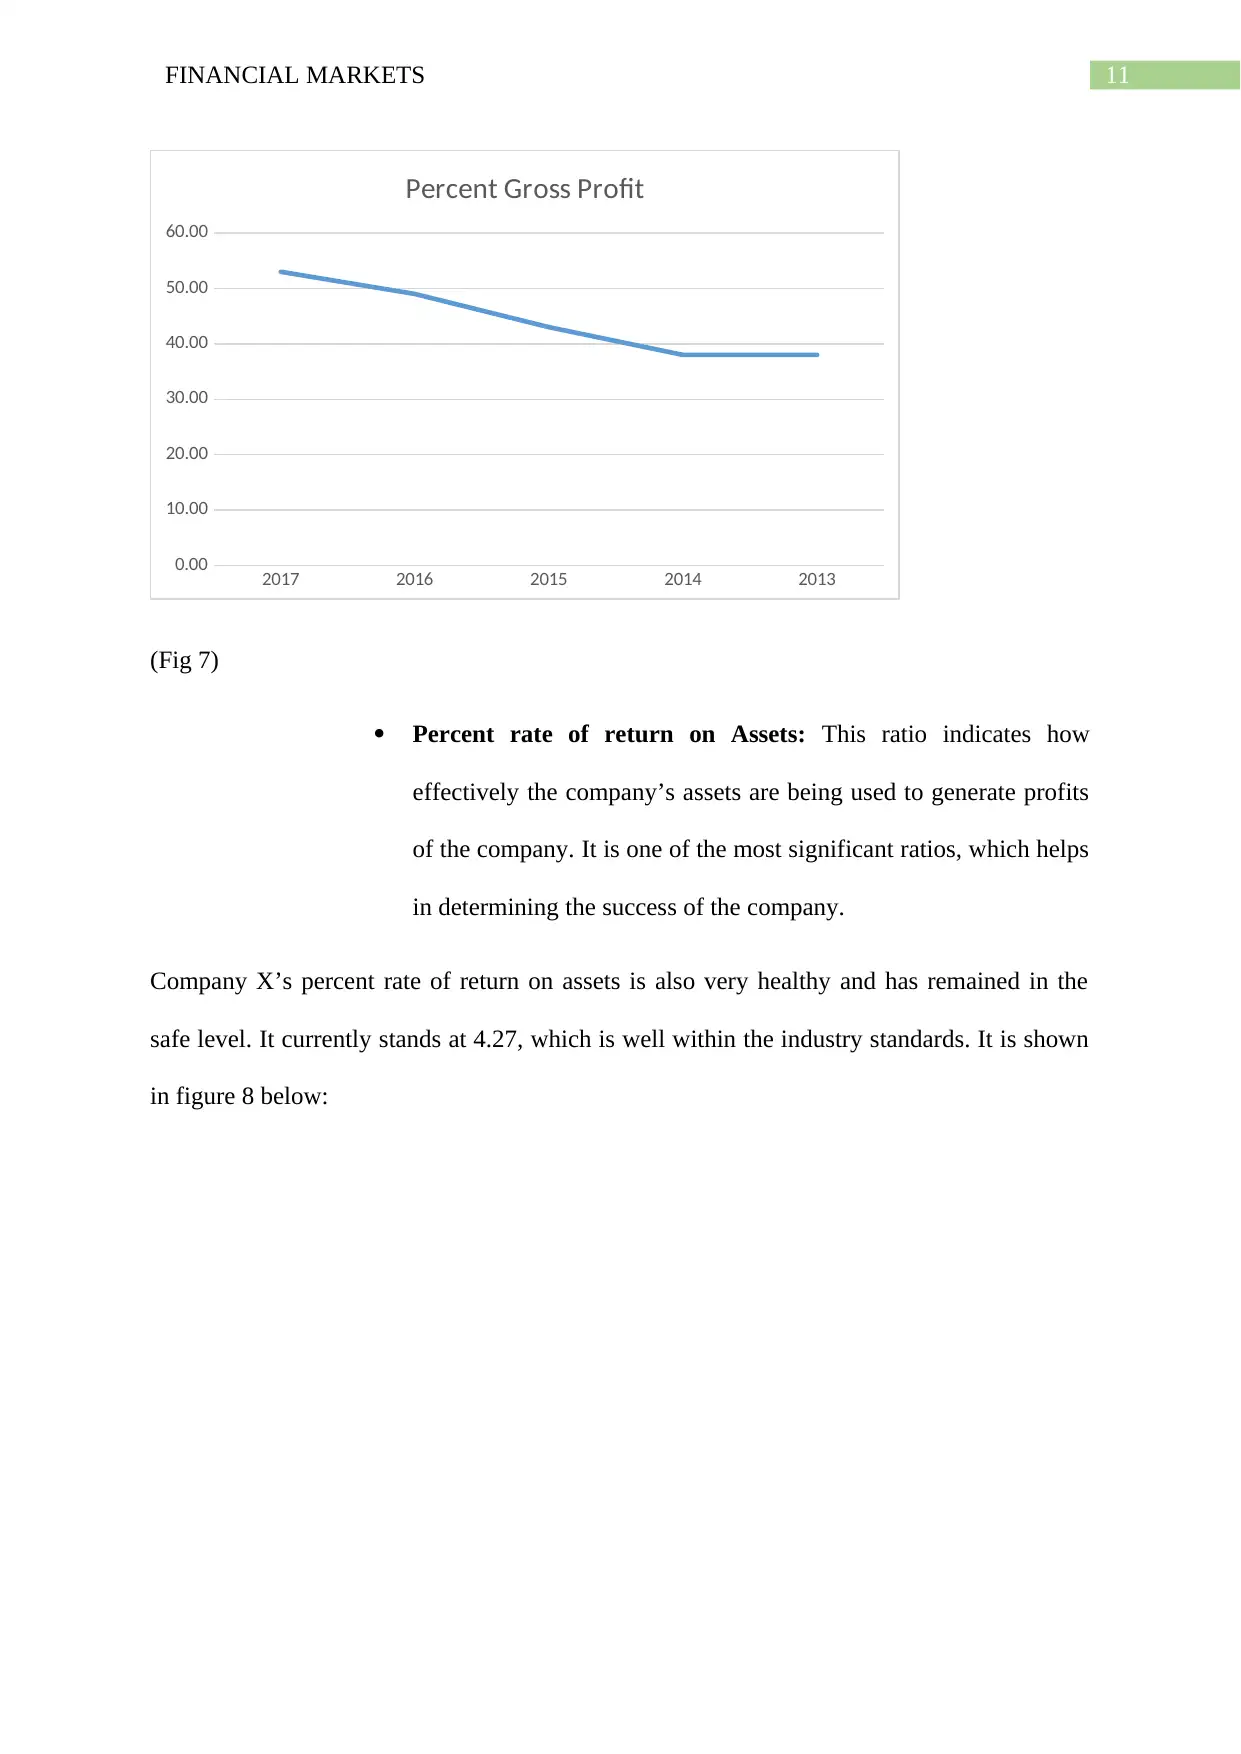
This assignment provides a comprehensive financial analysis of Company X, utilizing various financial ratios to assess the company's liquidity, activity, profitability, and coverage. The analysis spans from 2013 to 2017, examining key ratios such as current ratio, quick ratio, accounts receivable turnover, inventory turnover, debt to total assets, and debt to equity. The report includes graphical representations of these ratios to illustrate trends and performance over time. Additionally, the assignment discusses the par value and market value of the company's shares. The analysis aims to provide insights into the financial health and operational efficiency of Company X, highlighting areas of strength and potential concern. Desklib is a valuable resource for students seeking similar solved assignments and study tools.
Contribute Materials
Your contribution can guide someone’s learning journey. Share your
documents today.

Running head: FINANCIAL MARKETS
Name of the Student
Name of the University
Author note
Name of the Student
Name of the University
Author note
Secure Best Marks with AI Grader
Need help grading? Try our AI Grader for instant feedback on your assignments.

1FINANCIAL MARKETS
Table of Contents
a) Ratio and performance analysis of Company X:................................................................2
b) Par value and market value for 2015, 2016 and 2017:.....................................................15
c) Comparison of ratio performance with Company Y and Industry:..................................16
References:...............................................................................................................................19

2FINANCIAL MARKETS
a) Ratio and performance analysis of Company X:
The detailed ratio as well as performance analysis of the company has been provided
below:
Ratios 2017 2016 2015 2014 2013
Liquidity Ratios:
Current ratio 1.07 1.00 1.06 1.06 1.05
Quick ratio 0.85 0.63 0.83 0.61 0.62
Accounts Receivable to Working capital 3.18 3.49 4.08 4.10 4.28
Inventory to Working Capital 0.30 0.32 0.38 0.35 0.38
Sales to Working capital 20.70 20.89 -1.64 1.54 29.97
Long-Term Liabilities to Working Capital 9.54 10.76 12.82 11.29 12.29
Activity ratios:
Accounts Receivable Turnover 6.50 5.98 6.03 7.20 7.00
Days Sales in Receivables 56.14 61.06 60.52 50.73 52.11
Inventory Turnover 32.21 33.03 37.24 52.26 48.39
Days Cost of Sales in Inventory 11.33 11.05 9.80 6.98 7.54

3FINANCIAL MARKETS
Operating Cycle Days 67.47 72.11 70.32 57.71 59.66
Sales to Assets 0.71 0.65 0.66 0.82 0.76
Sales to Net Fixed Assets 2.19 2.01 2.03 2.54 2.35
Profitability ratios:
Percent Gross Profit 53.00 49.00 43.00 38.00 38.00
Percent Profit Margin on Sales 6.03 6.50 3.03 -2.05 -8.60
Percent Rate of Return on Assets 4.27 4.23 1.99 -1.68 -6.57
Price Earning Ratio 0.16 0.16 0.16 0.19 0.19
Earnings Per Share 23.96 24.06 23.92 20.24 20.09
Coverage ratios
Debt To Total Assets 0.79 0.80 0.81 0.78 0.78
Secure Best Marks with AI Grader
Need help grading? Try our AI Grader for instant feedback on your assignments.

4FINANCIAL MARKETS
Percent Owners' Equity 21.34 20.15 19.02 21.73 21.85
Equity Multiplier 4.69 4.96 5.26 4.60 4.58
Debt to Equity 3.69 3.96 4.26 3.60 3.58
Book Value Per Share 6.50 6.07 5.62 5.62 5.62
Each of these ratios have been carefully analysed in details below and the most
important ones have been graphically explained.
1. Liquidity Ratios:
Current Ratio: The current ratio is one of the most important
liquidity ratios of any organisation. This ratio reflects the financial
strength of any company (Delen, Kuzey and Uyar 2013). It says the
number of times the current assets exceeds the current liabilities of
the company. A higher number is needed in this case, as it reflects
a company’s power to pay off its short term obligations.
In Company’s X current ratio, over the five year period, it has remained relatively 1.0, thus it
states that the company has remained healthy in this front and has been able to meet its short
term obligations. The five year period’s current ratio has been graphically showed below (Fig
1), where it shows that the average has remained very healthy.

5FINANCIAL MARKETS
2017 2016 2015 2014 2013
0.96
0.98
1.00
1.02
1.04
1.06
1.08
1.10
Current ratio
(Fig 1)
Quick ratio: This ratio is also called the acid test ratio and it helps
to understand the number of times the liquid assets of the company
are able to cover the short term obligations of the company.
In case of Company X, it can be seen that the quick ratio of the company has improved over
the years, and it currently stands at 0.85, which shows that the ability to honour short term
obligations is good.
Inventory to Working Capital: This ratio measures the
overdependence of the working capital of the company on the stock
of inventory (Lartey, Antwi and Boadi, 2013). It is better that this
ratio remains low as it states that the company has a decent level of
working capital and the fact that it is not dependent on the level of
inventory of the company. The figure of the ratio is stated below:

6FINANCIAL MARKETS
2017 2016 2015 2014 2013
0.00
0.10
0.20
0.30
0.40
0.50
0.60
0.70
0.80
0.90
Quick ratio
(Fig 2)
It can be seen that Company X’s quick ratio is not healthy as it has considerably
increased over the years and it states that it is overly dependent on the inventory
of the company.
Sales to working capital: This ratio shows the company’s ability
to finance all its operations which are presently undertaken by it.
This ratio aims to show the proper utilization of working capital
towards the sales of the company. However, a very lower level
could indicate absence of adequate level of sale.
Company X’s sales to working capital ratio has been low. Since 2013, this has been on a
decreasing trend. It has reduced from 30 in 2013 to almost 20 in 2017. In 2015, it was really
low, but overall, the utilisation of working capital has been properly done as indicated by
moderately low levels of sales to working capital ratio as seen in the fig 3.
Paraphrase This Document
Need a fresh take? Get an instant paraphrase of this document with our AI Paraphraser

7FINANCIAL MARKETS
2017 2016 2015 2014 2013
-5.00
0.00
5.00
10.00
15.00
20.00
25.00
30.00
35.00
Sales to Working capital
(Fig 3)
2. Activity ratios:
Accounts receivable turnover ratio: This ratio measures the time
or precisely measures the number of times the receivable or the
money to be received comes to the company. It also helps to
indicate the company’s ability to receive its outstanding and
leftover receivables from its customers and clients. In this ratio, a
higher ratio is favoured because it indicates that the time between
sales and the collection of cash is very short in nature.
Company X’s accounts receivable turnover ratio has been fluctuating over the years. Since
2013, it has fluctuated each year and has not been constant. In 2013, it was a round 7 and now
in 2017 it is at 6.50 and it had stooped its lowest in 2016 when it had touched 5.98. This
reflects a poor show from company X in this frontier.
Day’s sales in receivables: This ratio is used to measure the
number of days a company’s receivables in terms of sales remain
outstanding and are left to be received. An increase in the number

8FINANCIAL MARKETS
of days, indicate late payments from client’s side. The companies
aim should be reduce the number of days it takes to get the money
back from the client. Generally it should not exceed 10 to 15 days.
In case of Company X, the number of days taken up by the clients to return the money is
about 56. This is a serious issue as it is putting significant pressure on the cash flow of the
company. It has remained in the place of 50s for the past 5 years, sometimes exceeding 60
days. The company should take adequate steps to address this issue at the earliest. This can be
viewed in figure 4 given below.
2017 2016 2015 2014 2013
0.00
10.00
20.00
30.00
40.00
50.00
60.00
70.00
Days Sales in Receivables
(Fig 4)
Inventory turnover: This ratio helps in measuring the support of
working capital upon the inventory or the stock of the company. In
the case of inventory turnover, a lower figure is suited, indicating
that a decent level of working capital is required.
This has also been very low in case of company X, indicating that a
decent level of dependency between working capital and inventory.

9FINANCIAL MARKETS
Operating cycle ratio: This ratio indicates the total conversion
period for the company. It is the average number of days it takes to
convert inventory or stock to turn into cash and return back to the
company. This ratio helps in understanding the line of credit and
the credit worthiness of the suppliers and external parties and
clients.
In case of operating cycle ratio of Company X over the period of five years is 65 on an
average. The company must try to bring it to a very low level and decrease it as seen in figure
5. If the money gets stuck in the assets or in the hands of the clients, then it is a big loss for
the company.
2017 2016 2015 2014 2013
0.00
10.00
20.00
30.00
40.00
50.00
60.00
70.00
80.00
Operating Cycle Days
(Fig 5)
Sales to Net fixed assets: The effectiveness of a company to
properly utilize its fixed assets to generate sales. The more, the
better. As a higher figure indicates that the company judiciously
uses its fixed assets in order to create and increase more sales.
Secure Best Marks with AI Grader
Need help grading? Try our AI Grader for instant feedback on your assignments.

10FINANCIAL MARKETS
The company X in this scenario, has some serious issues to address as the company’s sales to
net fixed assets. It is very low. The figures currently stand at 2 in 2017. A drastic change is
necessary as can be seen in the figure 6 given below:
2017 2016 2015 2014 2013
0.00
0.50
1.00
1.50
2.00
2.50
3.00
Sales to Net Fixed Assets
(Fig 6)
3. Profitability ratio:
Percent gross profit: This ratio indicates the gross profit earned
upon the amount of sales and it also states the amount of sales is
available to cover the operating expenses and the profit
contribution.
The percent gross profit ratio of the company X is in a satisfactory position and currently at
2017, it stands at 50. It has followed the same trend in the past five years and this indicates a
strong and positive health of the company.

11FINANCIAL MARKETS
2017 2016 2015 2014 2013
0.00
10.00
20.00
30.00
40.00
50.00
60.00
Percent Gross Profit
(Fig 7)
Percent rate of return on Assets: This ratio indicates how
effectively the company’s assets are being used to generate profits
of the company. It is one of the most significant ratios, which helps
in determining the success of the company.
Company X’s percent rate of return on assets is also very healthy and has remained in the
safe level. It currently stands at 4.27, which is well within the industry standards. It is shown
in figure 8 below:

12FINANCIAL MARKETS
2017 2016 2015 2014 2013
-8.00
-6.00
-4.00
-2.00
0.00
2.00
4.00
6.00
Percent Rate of Return on Assets
(Fig 8)
Percent profit margins on sales: This ratio helps in indicating the
amount of profit earned by the company and how tactfully a
company could deal with higher costs or a scenario of low sales in
the future.
Company X’s percent profit margins on sales is well within the satisfactory level of 6.03 as
shown in figure 9 This indicates that the company is well prepared to adapt itself to the
changing scenarios of low sales or profits in the future.
Paraphrase This Document
Need a fresh take? Get an instant paraphrase of this document with our AI Paraphraser

13FINANCIAL MARKETS
2017 2016 2015 2014 2013
-10.00
-8.00
-6.00
-4.00
-2.00
0.00
2.00
4.00
6.00
8.00
Percent Profit Margin on Sales
(Fig 9)
4. Coverage Ratios:
Debt to total assets: This ratio shows what amount of debt the
company presently carries in proportion to its asset holdings
( Grant 2016). A company‘s greater debt to total assets ratio
indicates that the company has more debts than its assets, therefore
the creditors indicate a lower ratio in this case.
In the case of company X, the debt to total assets remains very low and has remained very
low throughout the period of five years. The average figure being 0.79 s is evident from the
figure given below:

14FINANCIAL MARKETS
2017 2016 2015 2014 2013
0.76
0.78
0.80
0.82
Debt To Total Assets
(Fig 10)
Debt to equity: This ratio measures the financial leverage of the
company by stating what amount of debt and equity the company is
using in its capital structure (Delen, 2013). A lower ratio indicates
a lower amount of risk involved in the capital structure of the
company.
In this company, the debt to equity ratio is low which is beneficial and risk free for the
company. It stands at 3.69 as of 2017 which is a decent level, accepted by the industry
standards as shown in the given figure:

15FINANCIAL MARKETS
2017 2016 2015 2014 2013
3.20
3.40
3.60
3.80
4.00
4.20
4.40
Debt to Equity
(Fig 11)
b) Par value and market value for 2015, 2016 and 2017:
Par value for the 3 years:
2015= $190,000/50,000=3.8, 2016= $190,000/50,000=3.8, 2017=$ 190,000/50,000=3.8
Calculation of market values for the three year period:
For 2015, 2016 and 2017:
Net income (A) $20,206 (2015) $44,661 (2016) $45,550 (2017)
Less: Dividend paid
(B)
$0.40 $0.44 $0.48
Outstanding shares
(C)
$190,000 $190,000 $190,000
Market value (D) 0.11 0.23 0.24
Secure Best Marks with AI Grader
Need help grading? Try our AI Grader for instant feedback on your assignments.

16FINANCIAL MARKETS
The differences between par and market value for the three year period:
Year 2017 2016 2015
Par value 3.8 3.8 3.8
Market value .24 .23 .11
Difference 3.56 3.57 6.69
On careful analysis, differences have been pointed out between the market and par value for
the three years, there are large differences between the two, it can be caused due to various
reasons such as market volatility, changes in the stock prices due to market factors, changes
in government rules and regulations and other external factors (Frost et al., 2014).
c) Comparison of ratio performance with Company Y and Industry:
Company Y’s 5 year performance:
Key
Ratios Company Y
2017 2016 2015 2014 2013
Debt
ratio 0.5 0.52 0.53 0.53 0.54
Current
ratio 2.36 2.31 2.25 2.45 2.42
EPS 1.52 1.45 1.36 1.87 1.45
ROE 20.48 20.54 21.23 23.14 20.16

17FINANCIAL MARKETS
Company X’s 5 year performance:
Key
Ratios Industry
2017 2016 2015 2014 2013
Debt
ratio 0.58 0.59 0.57 0.58 0.56
Current
ratio 1.89 1.74 1.65 1.78 1.74
EPS 0.9 0.92 0.91 0.9 0.91
ROE 18.56 18.25 18.01 17.98 18.11
Industry‘s 5 year performance:
Key
Ratios Company X
2017 2016 2015 2014 2013
Debt
ratio 0.78 0.8 0.81 0.78 0.78
Current
ratio 1.07 1 1.06 1.06 1.05
EPS 0.91 0.89 0.41 -0.3 -1.18
ROE 0.14 0.14 0.07 0.054 0.21
Salient points of comparison:
The company X in terms of debt ratio has shown a dismal
performance as the debt ratio is significantly higher than both
company Y and the industry performance. A higher debt ratio
indicates more risk involved in the financial structure of the
company (Petruzzo et al.,2015). If it remains higher, the company
would be in a serious crisis. The management must take steps to
address this issue.
In terms of current ratio too, company X has not performed well,
when compared with industry or company Y’s performance.

18FINANCIAL MARKETS
Although, the company has maintained a decent record by keeping
it at for the five year period, but when compared with the
performance of the industry or especially with company Y, then
company X has underperformed. Company Y has consistently
maintained the level of keeping it till in the five year period. This
tells us that the company X has not been able to honour the short
term obligations of the various financial years in the five year
period.
Earnings per share is one of the sections, where company X has
been quiet successful, when compared with the overall industry
standards. It has consistently maintained its EPS at 0.9 in
accordance with the industry standards. Nevertheless, when it
comes to company Y, it still lags behind as company Y has
maintained it well over 1.5, consistently over the five year period.
Return on investment is one of the most important indicators of any
company’s financial performance. It indicates, if at all the
investment made, has yielded any kind of significant amount of
returns to the company (Heikal, Khaddafi and Ummah, 2014). In
this regard the company has performed very poorly in the course of
the five year period and is not at all within the standards set up by
company Y or the industry. The company’s management along
with the board must refocus its aim and look for possible reasons
for this under performance.
Paraphrase This Document
Need a fresh take? Get an instant paraphrase of this document with our AI Paraphraser

19FINANCIAL MARKETS
References:
Boudoukh, J., Feldman, R., Kogan, S. and Richardson, M., 2013. Which news moves stock
prices? a textual analysis (No. w18725). National Bureau of Economic Research.
Delen, D., Kuzey, C. and Uyar, A., 2013. Measuring firm performance using financial ratios:
A decision tree approach. Expert Systems with Applications, 40(10), pp.3970-3983.
Doğan, M., 2013. Does firm size affect the firm profitability? Evidence from Turkey.
Research Journal of Finance and Accounting, 4(4), pp.53-59.
Frost, J.J., Sonfield, A., Zolna, M.R. and Finer, L.B., 2014. Return on investment: a fuller
assessment of the benefits and cost savings of the US publicly funded family planning
program. The Milbank Quarterly, 92(4), pp.696-749.
Grant, R.M., 2016. Contemporary strategy analysis: Text and cases edition. John Wiley &
Sons.
Heikal, M., Khaddafi, M. and Ummah, A., 2014. Influence analysis of return on assets
(ROA), return on equity (ROE), net profit margin (NPM), debt to equity ratio (DER), and
current ratio (CR), against corporate profit growth in automotive in Indonesia Stock
Exchange. International Journal of Academic Research in Business and Social Sciences,
4(12), p.101.
Lartey, V.C., Antwi, S. and Boadi, E.K., 2013. The relationship between liquidity and
profitability of listed banks in Ghana. International Journal of Business and Social Science,
4(3).
Petruzzo, P., Gazarian, A., Kanitakis, J., Parmentier, H., Guigal, V., Guillot, M., Vial, C.,
Dubernard, J.M., Morelon, E. and Badet, L., 2015. Outcomes after bilateral hand
allotransplantation: a risk/benefit ratio analysis. Annals of surgery, 261(1), pp.213-220.

20FINANCIAL MARKETS
1 out of 21
Related Documents

Your All-in-One AI-Powered Toolkit for Academic Success.
+13062052269
info@desklib.com
Available 24*7 on WhatsApp / Email
Unlock your academic potential
© 2024 | Zucol Services PVT LTD | All rights reserved.