University Finance Course: Financial Statement Ratio Analysis
VerifiedAdded on 2019/10/16
|30
|4552
|336
Homework Assignment
AI Summary
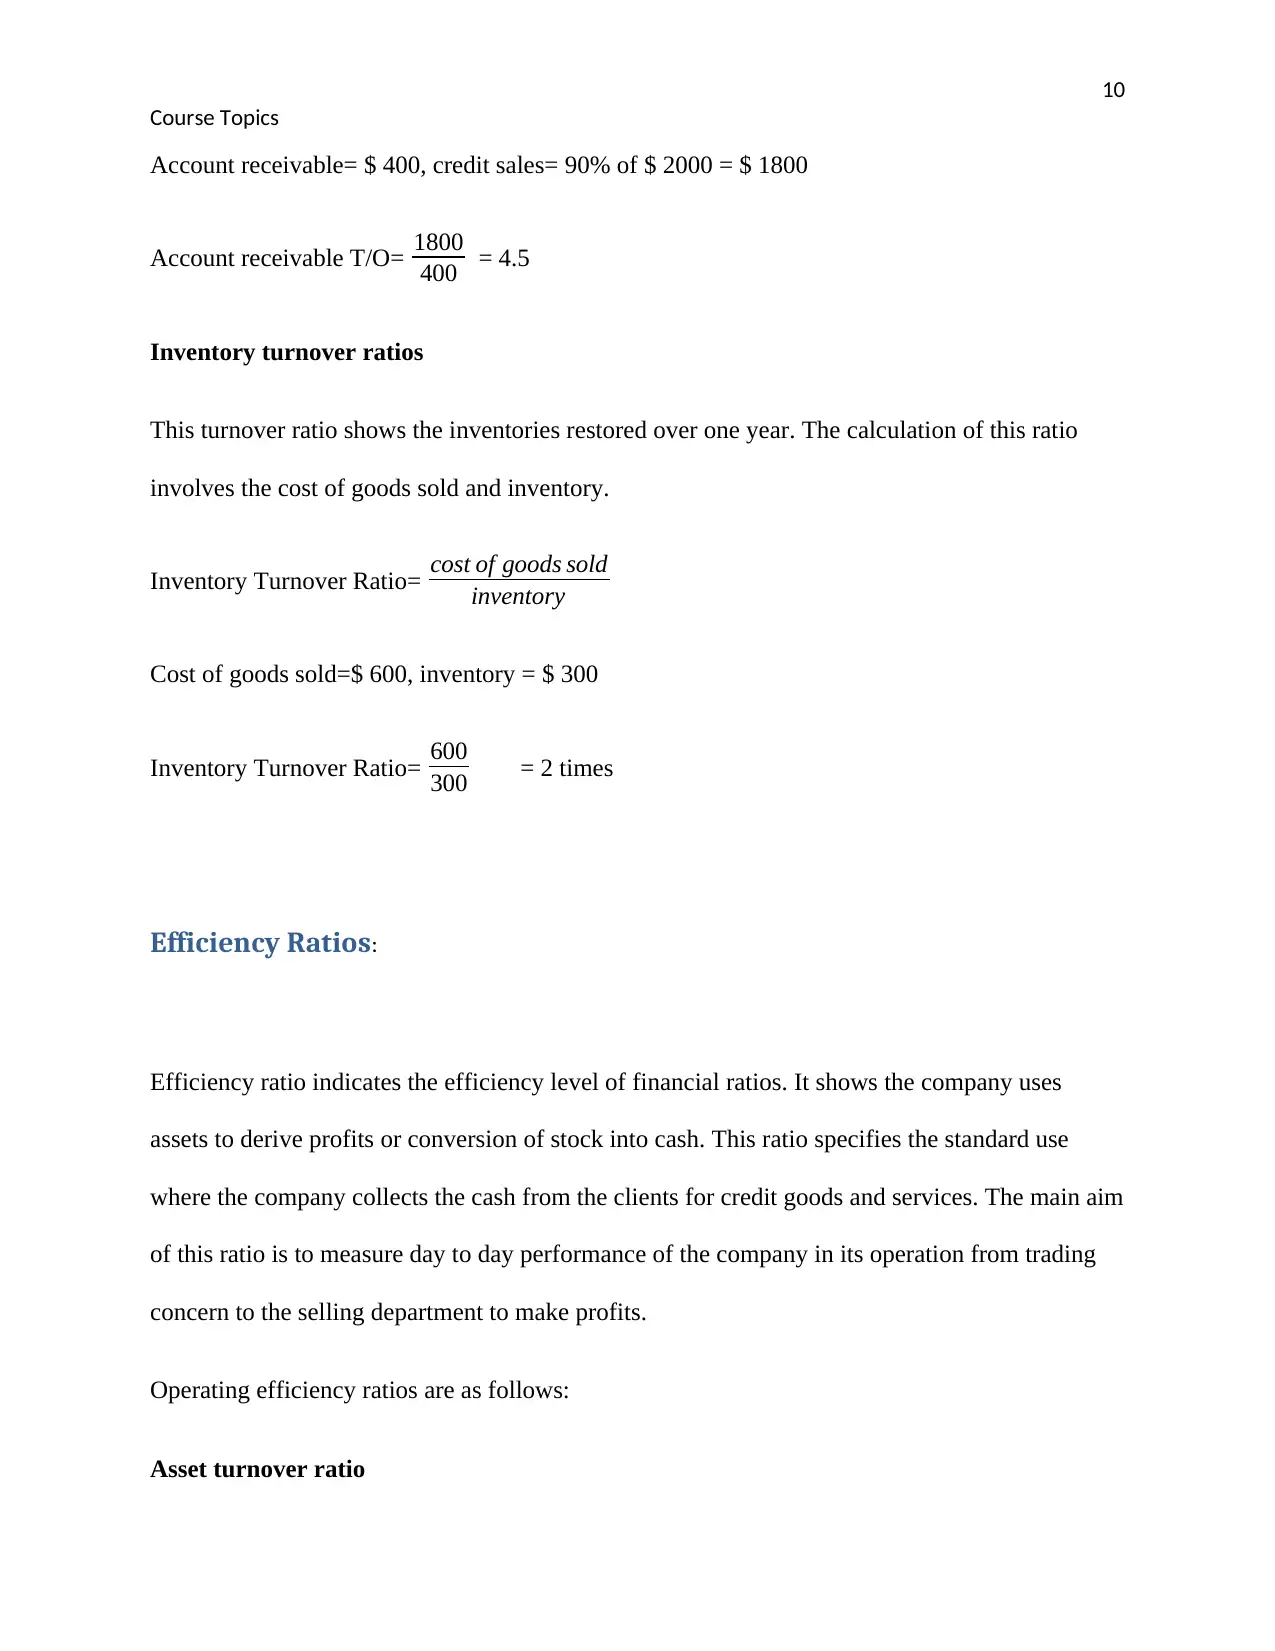
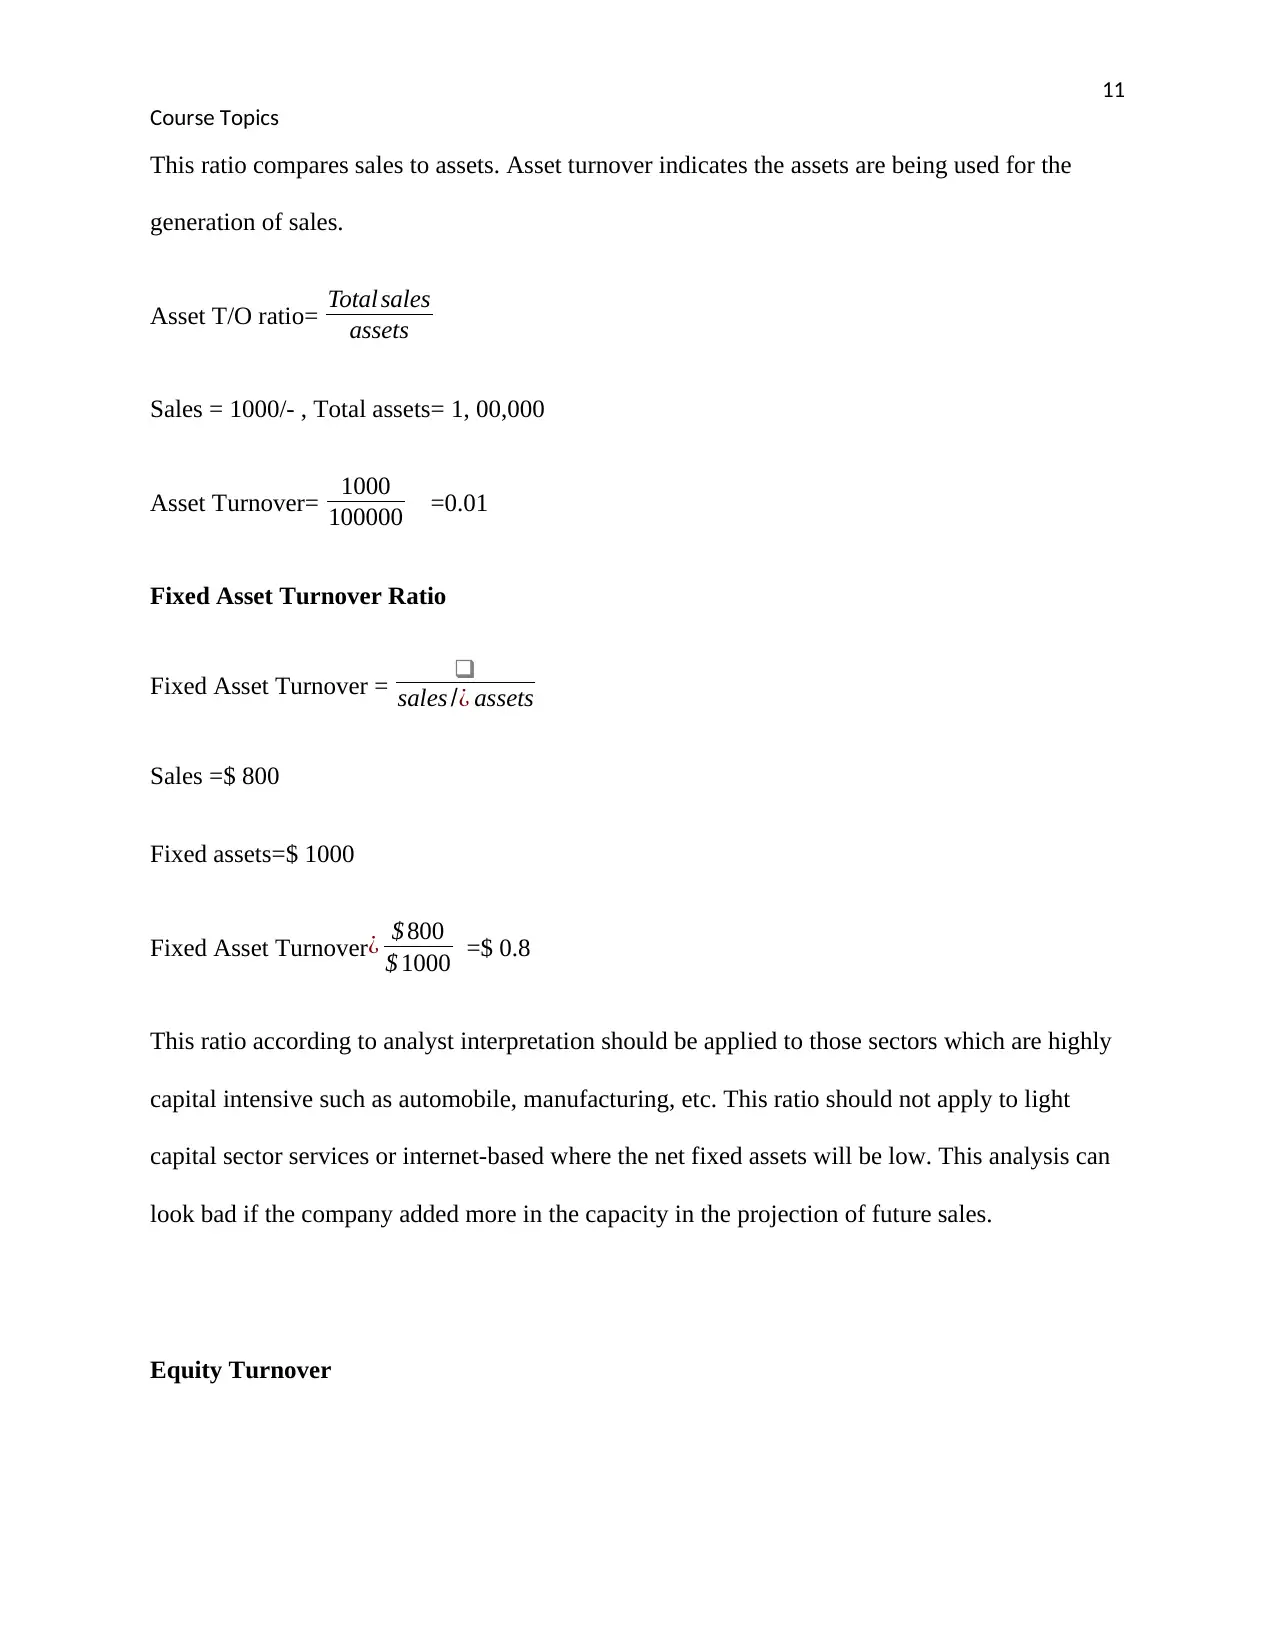
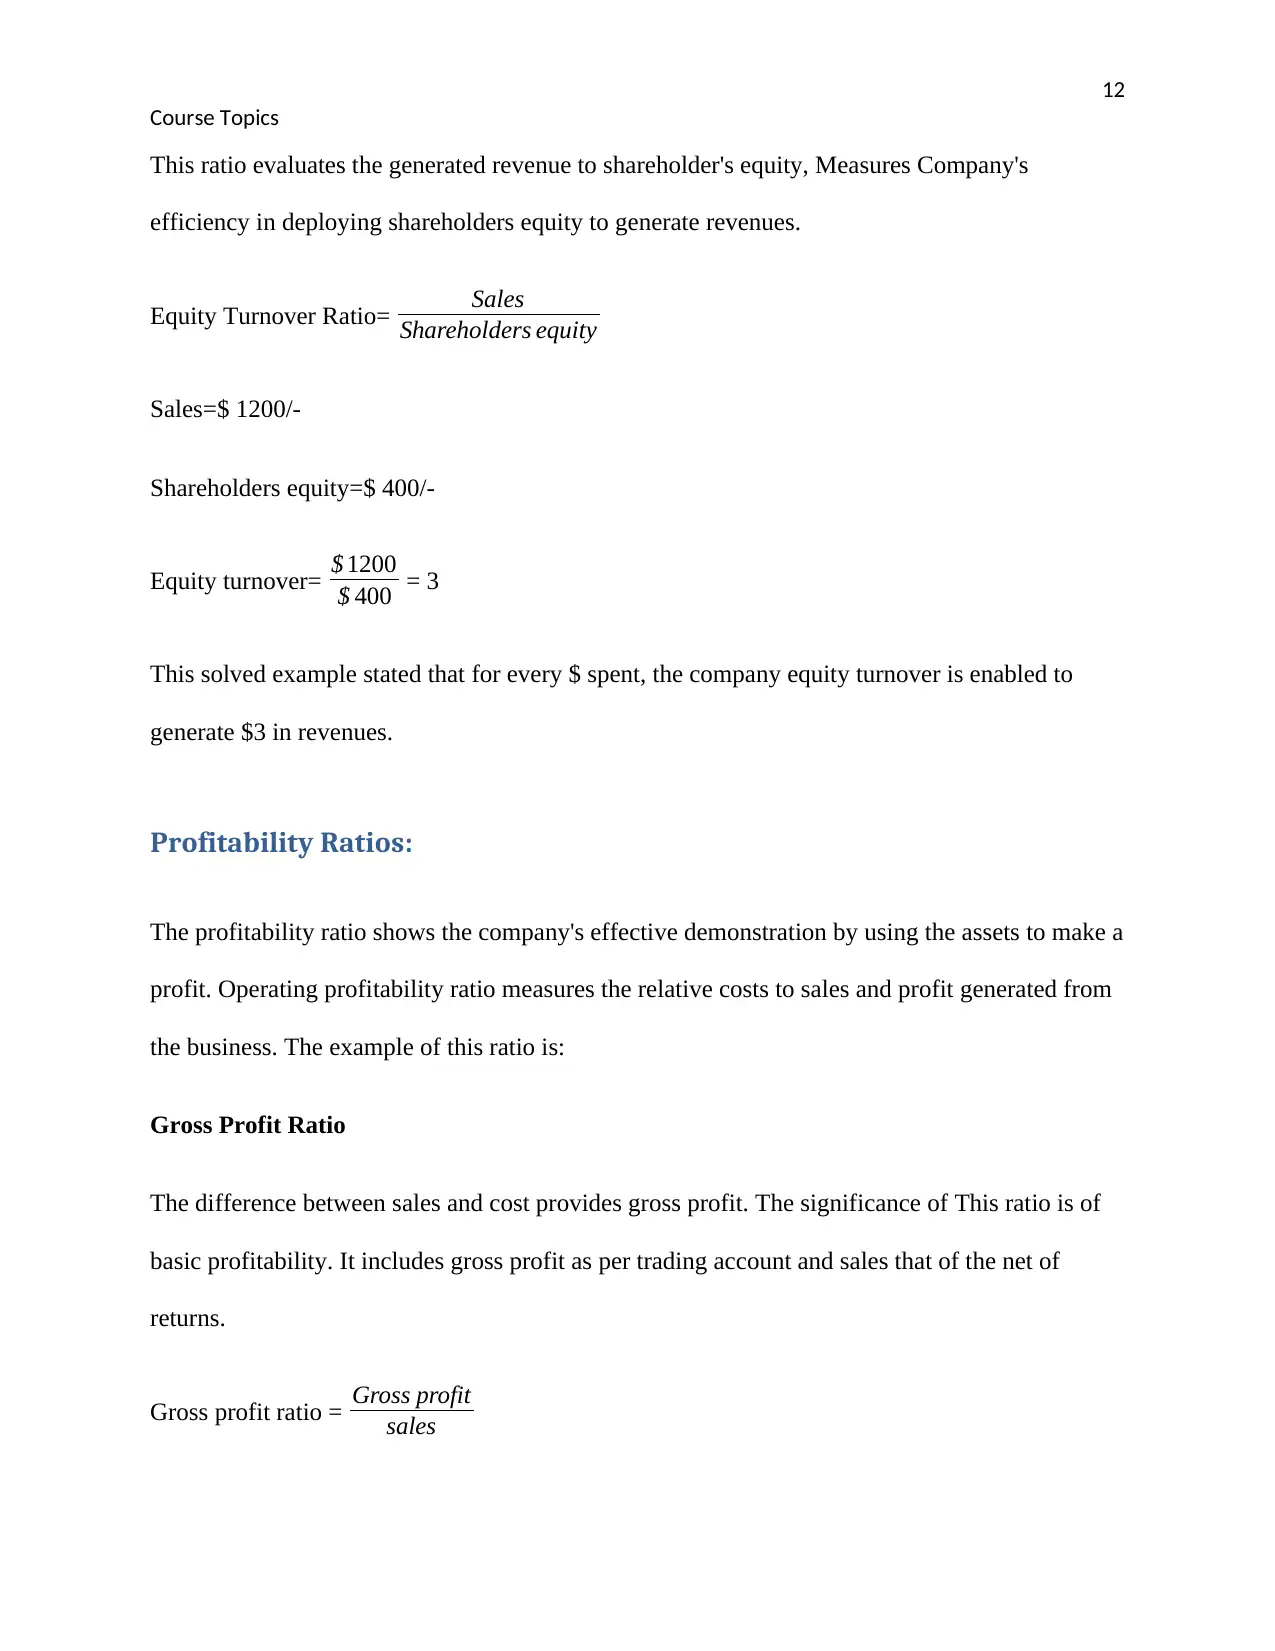
This assignment provides a comprehensive overview of financial ratio analysis, a crucial tool for interpreting financial statements. It begins with an introduction to ratio analysis, defining its purpose and importance in evaluating a company's performance, including profitability, risk, and efficiency. The assignment then delves into the classification of ratios, categorizing them based on the financial statements from which they are derived (balance sheet, revenue statement, and combined ratios). It explains various types of financial ratios, including solvency, liquidity, turnover, efficiency, profitability, and valuation ratios. Each type is explained with formulas and real-world examples. The document concludes with a focus on the practical application of these ratios and the significance of financial statement analysis for investors, managers, and stakeholders. This assignment is designed to help students understand how to calculate and interpret financial ratios to assess a company's financial health and make informed decisions. The assignment is contributed by a student to be published on the website Desklib, a platform which provides all the necessary AI based study tools for students.

qwertyuiopasdfghjklzxcvbnmqwertyui
opasdfghjklzxcvbnmqwertyuiopasdfgh
jklzxcvbnmqwertyuiopasdfghjklzxcvb
nmqwertyuiopasdfghjklzxcvbnmqwer
tyuiopasdfghjklzxcvbnmqwertyuiopas
dfghjklzxcvbnmqwertyuiopasdfghjklzx
cvbnmqwertyuiopasdfghjklzxcvbnmq
wertyuiopasdfghjklzxcvbnmqwertyuio
pasdfghjklzxcvbnmqwertyuiopasdfghj
klzxcvbnmqwertyuiopasdfghjklzxcvbn
mqwertyuiopasdfghjklzxcvbnmqwerty
uiopasdfghjklzxcvbnmqwertyuiopasdf
ghjklzxcvbnmqwertyuiopasdfghjklzxc
vbnmqwertyuiopasdfghjklzxcvbnmrty
uiopasdfghjklzxcvbnmqwertyuiopasdf
ghjklzxcvbnmqwertyuiopasdfghjklzxc
Course Topics
Paraphrase This Document
Need a fresh take? Get an instant paraphrase of this document with our AI Paraphraser

2
Course Topics
Overview
How to do ratio analysis for financial statements?
Financial statement analysis use ratio analysis formulas to draw a meaningful interpretation of
the data given in financial statements. This analysis helps investors to adopt a user-oriented
approach rather than traditional proprietary approach. Considering the various types of ratios
help investors to easily obtain the data from some ratios. This course aims to learn how to do
ratio analysis for the financial statement. This course first covers the meaning and definition of
ratio analysis in the introductory part and next to the various types of examples of financial
ratios. This course focuses on the purpose of the financial statement that is to evaluate its
performance in management's profitability, risk, and efficiency. The importance of ratio analysis
is to access the financial statement and analyze it. This analysis compares the company’s trends
with others over a specific period.
A ratio measures the relationship between two financial figures. In this corporate finance world,
ratios specify the company's standard performance and help the investors and managers to
analyze the operations. The ratios may be classified according to the financial statement on the
basic leading categories from which the ratios are derived.
Balance sheet ratios
Revenue statement ratios
Combined ratios
The ratio measures the relationship between two financial figures. Considering an example if
there are four cell phones and two calculators, now it can be said that cell phones and calculators

3
Course Topics
are in the ratio of 4:2. This shows that there are four cell phones for every two calculators. In the
corporate world of finance, ratios show the performance of companies. Ratio analysis helps the
investors and managers to analyze the various ratios and sustainability of the operations.
Ratios are used to simplify financial statement ratios. Without understanding the whole financial
statement ratio analysis helps the investor to obtain the information of a few data from the ratios.
Detection of problematic trend the analysis can also forecast the future performance of a
company. The profile of the company's business based on the geographical location where the
company operates, the category of product and services it provides, target customers, etc. Next is
financial profile included the size of the company, the upper limit to lower limit, etc. the
comparison in between companies through the implication of the ratios and that ratios can be PE
ratio, PB ratio. Financial statements are essential for the internal and external investors of the company
ever all the stakeholders have their different tastes like equity shareholders are interested in the growth of
the dividend payment. This course also provides the quiz after the topic finished for better knowledge of
the ratios and understanding.
Keywords- T/O- This short-form denotes to the company's turnover
ROE- ROE means a return on equity that is used to show the investor's return on their stock
holding.
RONA- This short form is used to show the companies performance in finance which determines
the use of assets in the financial statement. The return on net assets reflects the higher proportion
that means using the assets and net working capital efficiently and effectively.
EAT- Earning after tax is used to show a company's profitability. This term reflects the earning
expressed in percentage of revenues.
⊘ This is a preview!⊘
Do you want full access?
Subscribe today to unlock all pages.

Trusted by 1+ million students worldwide

4
Course Topics
PE ratio= Price earning ratio
PB ratio= price to book ratio
Introduction
Financial statement analysis determines the performance of management namely profitability, efficiency
and risk. Financial statement classified in three analysis that can be:
Vertical analysis
Horizontal analysis
Ratio analysis
Vertical analysis:
Vertical analysis is known as a common size statement analysis compares to all items. This is a
technique used to identify the resources where to apply the resources. The distribution of
resources in varied proportions has applied determines the measure of the relative performance
of the income statement.
The income statements each item are expressed as a percentage of sales. Balance sheet items also
balanced with twofold aspect. Total assets= Total liabilities.
Vertical analysis – Balance sheet
These analyses manage the balance sheet and consider various items in the total assets and total
liabilities percentages.
Paraphrase This Document
Need a fresh take? Get an instant paraphrase of this document with our AI Paraphraser

5
Course Topics
Horizontal analysis
This analysis compares the income statement and balance sheet; both financial statements
determine the changes, the absolute change along with percentage changes. This technique
evaluates the trends within time by computing the proportion, the percentages increase or
decrease with the base year. The accounts calculated interlinked with different dates using
different purchasing powers.
Ratio analysis of financial statements helps to identify the changes in the financial statements
situation. The individually separate ratio is not adequate to judge the situation of the company.
Various ratios used to evaluate the financial statement with each other. This comparative analysis
of ratios is most important in financial analysis. The ratios are variables in analysis and not
absolute measurements. The awareness is required to avoid the errors in conclusions. This is the
following ratios discussed below:
Solvency Ratio
Solvency ratios show companies feasibility on a long term basis. The comparison of debt
measures its earning, equity and assets. This analysis classified into two subcategories:
1) Liquidity ratio and
2) Turnover ratio
Liquidity ratios indicate the cash available to business and its ability to meet current dues.
Liquidity ratios are an indicator of a company's capacity to clear its current liabilities (liabilities
need to be cleared in the year)

6
Course Topics
Operational Efficiency
Some ratios help to analyze efficiency. This ratio specifies the standard use where the company
collects the cash from the clients for credit goods and services. The main aim of this ratio is to
measure day to day performance of the company in its operation from trading concern to the
selling department to make profits.
Profitability
Profitable return on assets ratio and return on equity ratio help to the shareholders or the stakeholders to
understand how many firms can generate the earnings. Return on assets means the total net income
divided by total assets. The margin rate helps to analyze the firm's ability to translate sales to profit.
Valuation Ratio
Valuation ratios are for the company's investors, it helps them to measure whether the share to be
purchase, hold or sell. Using these ratio investors can also be able to forecast the future of the
shares and stock and the expected returns from the stock
Types of financial statement ratios
Solvency Ratios:
Solvency ratios show companies feasibility on a long term basis. The comparison of debt
measures its earning, equity and assets. This analysis classified into two subcategories:
⊘ This is a preview!⊘
Do you want full access?
Subscribe today to unlock all pages.

Trusted by 1+ million students worldwide

7
Course Topics
3) Liquidity ratio and
4) Turnover ratio
Examples of solvency ratios are:
According to its name debt –to- equity ratio shows its relationship with debt taken by the
company to equity. The proportion of fundraising from banks and creditors compared to the fund
from the investors. Debt -equity = Debts
Equity shareholders fund
Debts=$ 40,000
Equity shareholders fund= $ 20,000
Debt- equity= $ 40,000/$ 20,000 =2
This ratio depicts that lower the ratio of debt-equity, higher the company's position. The fund
taken from the company's shareholders and investors is always better than the fund from banks
and creditors.
Liquidity Ratio
Liquidity ratios indicate the cash available to business and its ability to meet current dues.
Liquidity ratios are an indicator of a company's capacity to clear its current liabilities (liabilities
need to be cleared in the year)
Liquidity ratio examples are discussed below
Quick Ratio
Paraphrase This Document
Need a fresh take? Get an instant paraphrase of this document with our AI Paraphraser

8
Course Topics
This ratio indicates the ability to meet immediate liabilities. The ideal ratio is 1.33:1.
Quick Ratio = Quick assets
Quick liabilities
Quick assets= cash and cash equivalent + account receivable.
Cash= $ 200
Account Receivable= $ 400
Current liabilities= $1000
Quick Ratio = 200+400
1200
= 0.5
Current Ratio
The current ratio is often used to analyze the liquidity. It is quickly and easily accessible to
measure the relationship between current assets and current liabilities. This ratio is also known as
an acid ratio. An amount of stock, prepaid expenses, and other current expenses are examples of
current assets. The current ratio provides the estimate for the survival of the company whether it
would survive for one year or not. When the current assets are more than the current liabilities,
the company can easily convert the current assets into cash to pay off the current debts of the
company. Current ratios not only provide the grades of the company but also the marketability.
Current Ratio = Curre nt Assets
Current liabilities

9
Course Topics
Formula: The addition of all the current assets and current liabilities shown in the balance sheet
comes to a quick ratio.
Current assets = $ 400
Current liabilities = $ 800
Current ratio= $ 400/ $800 = 0.5 times
Cash Ratio
Cash Ratio = cash∧cash equivalent
current liabilities
This ratio determines the value of cash and cash equivalents. A higher cash ratio depicts a
company's ability to pay short term liabilities.
Cash and cash equivalent= $600
Current liabilities= $1200
Quick Ratio= $ 600
$ 1200 = 0.5
Turnover analysis
Turnover analysis analyzes the company’s liquidity. How much time a particular
Commonly turnover ratios are as follows:
Receivable turnover ratio- accounts receivables calculated annually or quarterly. For quarterly,
Sales =$ 2000, credit percentage= 90%,
⊘ This is a preview!⊘
Do you want full access?
Subscribe today to unlock all pages.

Trusted by 1+ million students worldwide

10
Course Topics
Account receivable= $ 400, credit sales= 90% of $ 2000 = $ 1800
Account receivable T/O= 1800
400 = 4.5
Inventory turnover ratios
This turnover ratio shows the inventories restored over one year. The calculation of this ratio
involves the cost of goods sold and inventory.
Inventory Turnover Ratio= cost of goods sold
inventory
Cost of goods sold=$ 600, inventory = $ 300
Inventory Turnover Ratio= 600
300 = 2 times
Efficiency Ratios:
Efficiency ratio indicates the efficiency level of financial ratios. It shows the company uses
assets to derive profits or conversion of stock into cash. This ratio specifies the standard use
where the company collects the cash from the clients for credit goods and services. The main aim
of this ratio is to measure day to day performance of the company in its operation from trading
concern to the selling department to make profits.
Operating efficiency ratios are as follows:
Asset turnover ratio
Paraphrase This Document
Need a fresh take? Get an instant paraphrase of this document with our AI Paraphraser

11
Course Topics
This ratio compares sales to assets. Asset turnover indicates the assets are being used for the
generation of sales.
Asset T/O ratio= Total sales
assets
Sales = 1000/- , Total assets= 1, 00,000
Asset Turnover= 1000
100000 =0.01
Fixed Asset Turnover Ratio
Fixed Asset Turnover = ❑
sales /¿ assets
Sales =$ 800
Fixed assets=$ 1000
Fixed Asset Turnover¿ $ 800
$ 1000 =$ 0.8
This ratio according to analyst interpretation should be applied to those sectors which are highly
capital intensive such as automobile, manufacturing, etc. This ratio should not apply to light
capital sector services or internet-based where the net fixed assets will be low. This analysis can
look bad if the company added more in the capacity in the projection of future sales.
Equity Turnover

12
Course Topics
This ratio evaluates the generated revenue to shareholder's equity, Measures Company's
efficiency in deploying shareholders equity to generate revenues.
Equity Turnover Ratio= Sales
Shareholders equity
Sales=$ 1200/-
Shareholders equity=$ 400/-
Equity turnover= $ 1200
$ 400 = 3
This solved example stated that for every $ spent, the company equity turnover is enabled to
generate $3 in revenues.
Profitability Ratios:
The profitability ratio shows the company's effective demonstration by using the assets to make a
profit. Operating profitability ratio measures the relative costs to sales and profit generated from
the business. The example of this ratio is:
Gross Profit Ratio
The difference between sales and cost provides gross profit. The significance of This ratio is of
basic profitability. It includes gross profit as per trading account and sales that of the net of
returns.
Gross profit ratio = Gross profit
sales
⊘ This is a preview!⊘
Do you want full access?
Subscribe today to unlock all pages.

Trusted by 1+ million students worldwide
1 out of 30
Related Documents

Your All-in-One AI-Powered Toolkit for Academic Success.
+13062052269
info@desklib.com
Available 24*7 on WhatsApp / Email
Unlock your academic potential
Copyright © 2020–2025 A2Z Services. All Rights Reserved. Developed and managed by ZUCOL.