MBAD6031: Financial Ratio Analysis of Ethiopian Airlines 2015-2016
VerifiedAdded on 2022/01/19
|17
|4951
|26
Homework Assignment
AI Summary
This assignment, prepared for the Addis Ababa Science and Technology University's MBA program (Industrial Management), focuses on a financial ratio analysis of Ethiopian Airlines' annual reports from 2015 and 2016. The analysis, conducted by Mr. Arkbom Hailu and Mr. Samuel Tekelehana, examines various financial ratios, including liquidity, asset management, leverage (solvency), and profitability ratios. The introduction provides context on financial statements and ratio analysis, emphasizing their role in evaluating a company's performance and financial health. The paper delves into specific ratios such as current ratio, quick ratio, asset turnover, debt-to-equity ratio, and profit margin, explaining their formulas and significance. The document aims to assess Ethiopian Airlines' financial position by applying these ratios to its financial data, offering a comprehensive evaluation of its performance in the aviation industry. The analysis covers short-term liquidity, asset utilization efficiency, long-term solvency, and overall profitability, providing a detailed financial assessment of the airline's operations during the specified period.
Addis Ababa Science and Technology University
College of Natural and Social Sciences
MBA (Industrial Management)
Investment Analysis and Financial Management
(MBAD6031)
Assignment on
Financial Ratio Analysis, for Ethiopian Airline Annual
Report of 2015 and 2016
Submitted to: - Giday G (PhD in Finance)
College of Natural and Social Sciences
MBA (Industrial Management)
Investment Analysis and Financial Management
(MBAD6031)
Assignment on
Financial Ratio Analysis, for Ethiopian Airline Annual
Report of 2015 and 2016
Submitted to: - Giday G (PhD in Finance)
Paraphrase This Document
Need a fresh take? Get an instant paraphrase of this document with our AI Paraphraser
Financial Ratio Analysis, for Ethiopian Airline Annual Report of 2015 and 2016
Table of Contents
1. Introduction ............................................................................................................................. 1
1.1. Financial Statement and Financial Analysis .................................................................... 1
1.2. Financial Ratio Analysis .................................................................................................. 1
1.2.1. Liquidity (Short term) ratio ....................................................................................... 1
1.2.2. Asset or Activity (efficiency) ratio ........................................................................... 2
1.2.3. Leverage Ratio, Solvency or Debt (Long term) Ratio .............................................. 4
1.2.4. Profitability Ratio...................................................................................................... 5
1.3. Financial Ratio for Ethiopian Airline for the year of 2015-2016 ..................................... 8
2. Reference ............................................................................................................................... 15
Financial Ratio Analysis, for Ethiopian Airline Annual Report of 2015 and 2016
1. Introduction
1.1. Financial Statement and Financial Analysis
The performance, efficiency or effectiveness of a company in utilizing its resource i.e., financial,
any tangible and intangible asset will be evaluating using financial ratio analysis. This financial
ratio analysis will also used to evaluated the liquidity or short-term liability or payment ability as
well as solvency or long-term status debt recovery capacity of the company. Asset or activity
management ratio will also help the financial manager or any creditors to see how the asset has
been utilize and how the account receivables or payable are managed in the company.
Ratio Analysis is a very helpful mathematical tool for any financial manager, employee, external
body like creditor to determine the financial status of the company in as compare to its strength
and weakness in obtaining profit out of the initial investment.
Always, in order to execute a financial ratio, a balance sheet and income statement of the company
must be there. Without these two-accounting financial statement, ration analysis couldn’t be
possible.
This paper will evaluate the financial ratio of one inter-company in the aviation industry, Ethiopian
Airline. For evaluating a horizontal five-year annual financial statement data is collected starting
from 2011-2012 to 2015-2016 E.C but for this assignment we only used the last two-year financial
statement for comparison.
1.2. Financial Ratio Analysis
There are different ration analyses which are particularly focused on
A) Liquidity (Short term) loan
B) Asset (Activity) Management
C) Solvency (Debt) or Capital Structure (Long term) debt and
D) Profit
⊘ This is a preview!⊘
Do you want full access?
Subscribe today to unlock all pages.
Trusted by 1+ million students worldwide
Financial Ratio Analysis, for Ethiopian Airline Annual Report of 2015 and 2016
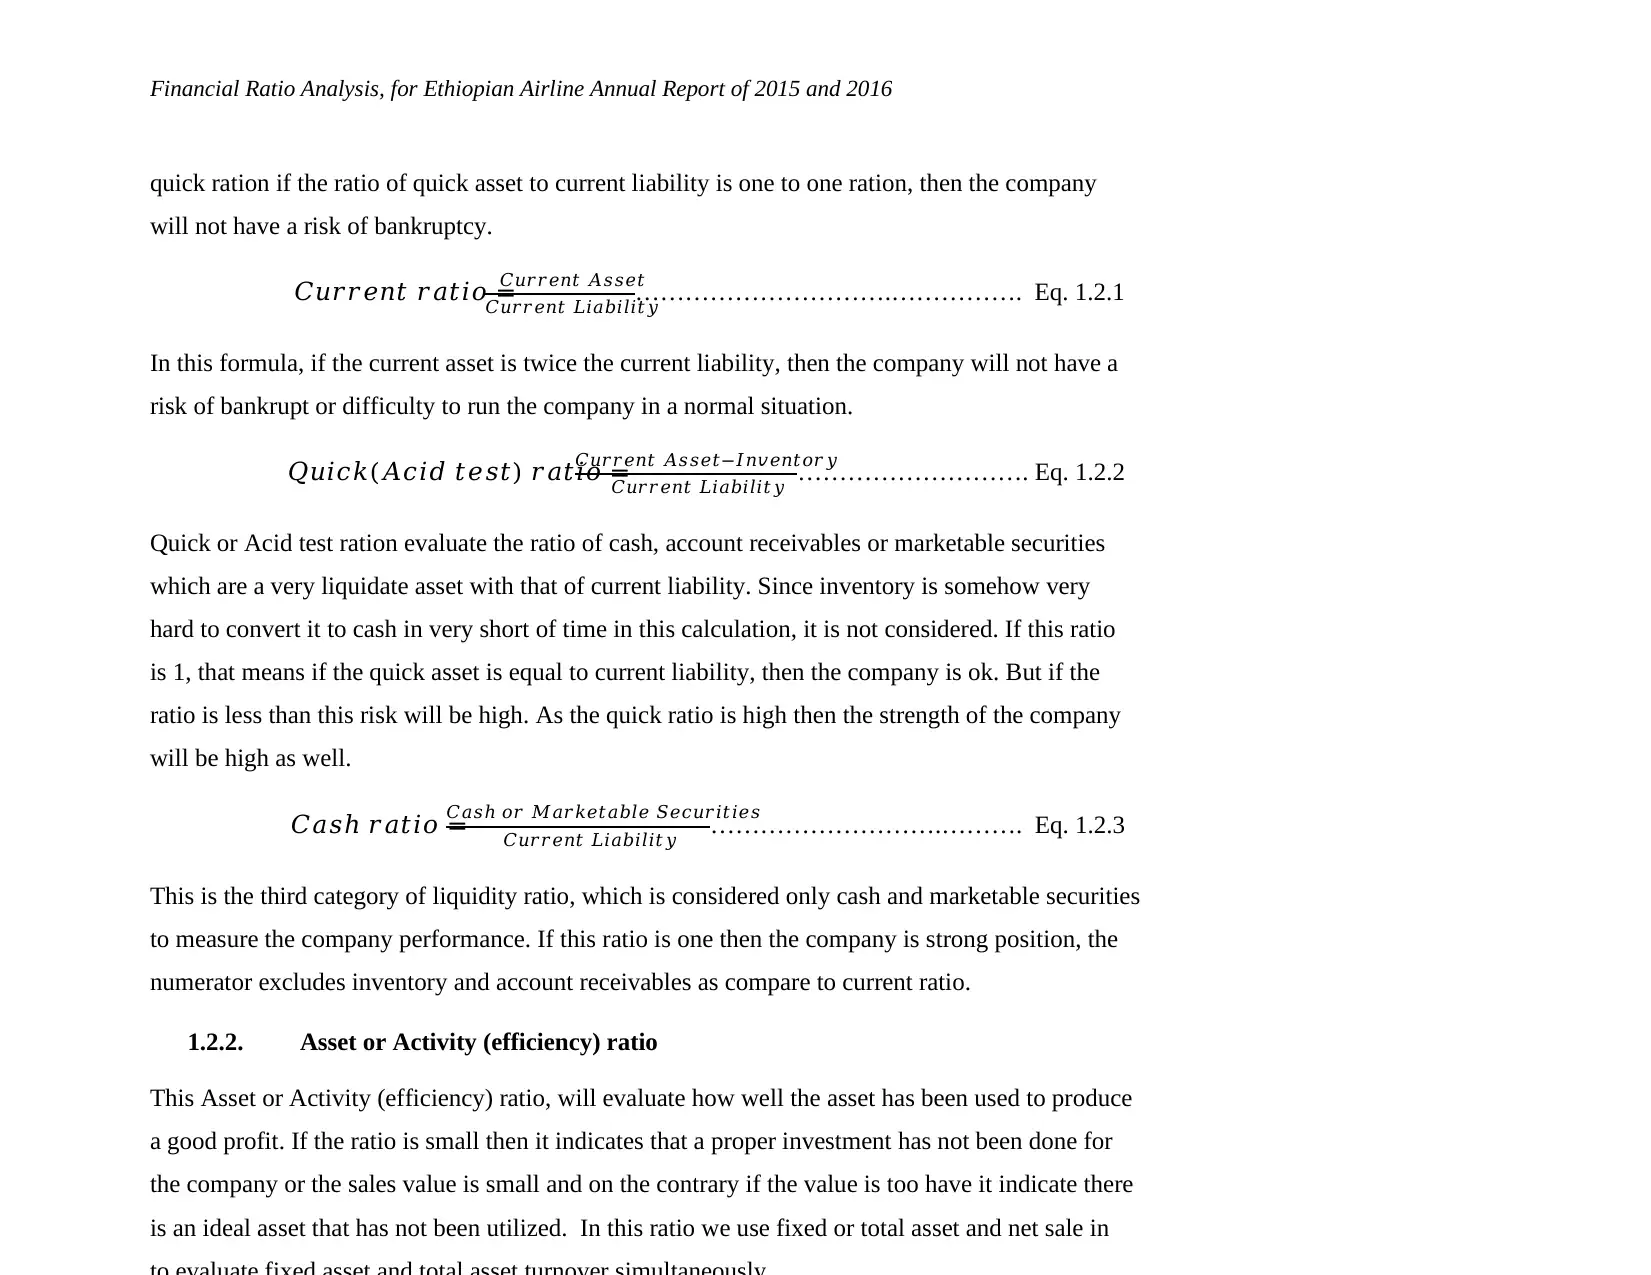
quick ration if the ratio of quick asset to current liability is one to one ration, then the company
will not have a risk of bankruptcy.
𝐶𝑢𝑟𝑟𝑒𝑛𝑡 𝑟𝑎𝑡𝑖𝑜 =
𝐶𝑢𝑟𝑟𝑒𝑛𝑡 𝐴𝑠𝑠𝑒𝑡
𝐶𝑢𝑟𝑟𝑒𝑛𝑡 𝐿𝑖𝑎𝑏𝑖𝑙𝑖𝑡𝑦
………………………….……………. Eq. 1.2.1
In this formula, if the current asset is twice the current liability, then the company will not have a
risk of bankrupt or difficulty to run the company in a normal situation.
𝑄𝑢𝑖𝑐𝑘(𝐴𝑐𝑖𝑑 𝑡𝑒𝑠𝑡) 𝑟𝑎𝑡𝑖𝑜 =
𝐶𝑢𝑟𝑟𝑒𝑛𝑡 𝐴𝑠𝑠𝑒𝑡−𝐼𝑛𝑣𝑒𝑛𝑡𝑜𝑟𝑦
𝐶𝑢𝑟𝑟𝑒𝑛𝑡 𝐿𝑖𝑎𝑏𝑖𝑙𝑖𝑡𝑦 ………………………. Eq. 1.2.2
Quick or Acid test ration evaluate the ratio of cash, account receivables or marketable securities
which are a very liquidate asset with that of current liability. Since inventory is somehow very
hard to convert it to cash in very short of time in this calculation, it is not considered. If this ratio
is 1, that means if the quick asset is equal to current liability, then the company is ok. But if the
ratio is less than this risk will be high. As the quick ratio is high then the strength of the company
will be high as well.
𝐶𝑎𝑠ℎ 𝑟𝑎𝑡𝑖𝑜 =
𝐶𝑎𝑠ℎ 𝑜𝑟 𝑀𝑎𝑟𝑘𝑒𝑡𝑎𝑏𝑙𝑒 𝑆𝑒𝑐𝑢𝑟𝑖𝑡𝑖𝑒𝑠
𝐶𝑢𝑟𝑟𝑒𝑛𝑡 𝐿𝑖𝑎𝑏𝑖𝑙𝑖𝑡𝑦 ……………………….………. Eq. 1.2.3
This is the third category of liquidity ratio, which is considered only cash and marketable securities
to measure the company performance. If this ratio is one then the company is strong position, the
numerator excludes inventory and account receivables as compare to current ratio.
1.2.2. Asset or Activity (efficiency) ratio
This Asset or Activity (efficiency) ratio, will evaluate how well the asset has been used to produce
a good profit. If the ratio is small then it indicates that a proper investment has not been done for
the company or the sales value is small and on the contrary if the value is too have it indicate there
is an ideal asset that has not been utilized. In this ratio we use fixed or total asset and net sale in
Paraphrase This Document
Need a fresh take? Get an instant paraphrase of this document with our AI Paraphraser
Financial Ratio Analysis, for Ethiopian Airline Annual Report of 2015 and 2016
receivables or payable are converted into cash during a year. The duration of time that takes to
receive or pay an account receivable or payable is called Average collection Period (ACP) or Day’s
sales outstanding and Account payable period (APP). Both of them have similar formula, ACP is
equal to 365 divided by A/R turn over and for APP, it is 365 divided to A/P turnover.
In addition to the above turnover, there is also Inventory turnover, Inventory conversion period
and Net working capital ratio. Inventory ratio measures how well the cost of good sold can get into
the market per annual and Net working capital ratio measures what percentage of the cost for
working capital has been incur in the sale. i, e if the Networking capital ratio is 2 then only half of
the cost in the working capital is go to the sale. Which indicate that the company is earning a good
revenue.
𝐹𝑖𝑥𝑒𝑑 𝐴𝑠𝑠𝑒𝑡 𝑇𝑢𝑟𝑛𝑜𝑣𝑒𝑟 =
𝑁𝑒𝑡 𝑠𝑎𝑙𝑒𝑠
𝑁𝑒𝑡 𝑓𝑖𝑥𝑒𝑑 𝑎𝑠𝑠𝑒𝑡
………………….……………. Eq. 1.2.4
𝑇𝑜𝑡𝑎𝑙 𝐴𝑠𝑠𝑒𝑡 𝑇𝑢𝑟𝑛𝑜𝑣𝑒𝑟 =
𝑁𝑒𝑡 𝑠𝑎𝑙𝑒𝑠
𝑇𝑜𝑡𝑎𝑙 𝑎𝑠𝑠𝑒𝑡
………………….……………. Eq. 1.2.5
The above formula, measures how efficiently the firm asset uses its plant and equipment (fixed
asset) as well as total asset to generate sales and profit. The high ratio indicates of overtrading
while a low ratio suggested idle capacity or excessive investment in fixed assets or the sales
capacity is lower than expected. Normally, a ratio of five times is taken as a standard.
𝐴𝑐𝑐𝑜𝑢𝑛𝑡 𝑟𝑒𝑐𝑒𝑖𝑣𝑎𝑏𝑙𝑒 (𝐷𝑒𝑏𝑡) 𝑇𝑢𝑟𝑛𝑜𝑣𝑒𝑟 =
𝐶𝑟𝑒𝑑𝑖𝑡 𝑆𝑎𝑙𝑒𝑠
𝐴𝑣𝑒𝑟𝑎𝑔𝑒 𝐴/𝑅
…………………. Eq. 1.2.6
𝐴𝑣𝑒𝑟𝑎𝑔𝑒 𝐶𝑜𝑙𝑙𝑒𝑐𝑡𝑖𝑜𝑛 𝑃𝑒𝑟𝑖𝑜𝑑 = 365
𝐴𝑐𝑐𝑜𝑢𝑛𝑡 𝑅𝑒𝑐𝑒𝑖𝑣𝑎𝑏𝑙𝑒 𝑇𝑢𝑟𝑛𝑜𝑣𝑒𝑟
…………………. Eq. 1.2.7
Account receivable measures how efficiently a firm’s accounts receivable is being managed, it
indicates how fast the account receivable can be converted to cash during a year.
Financial Ratio Analysis, for Ethiopian Airline Annual Report of 2015 and 2016
Account payable turnover measures how efficiently and effectively the firm is paying it net credit
purchase. APP tells the allowable time for the payment of the credit for the creditors. The longer
it is, the more time the company will get to college its financial strength.
𝐼𝑛𝑣𝑒𝑛𝑡𝑜𝑟𝑦 𝑇𝑢𝑟𝑛𝑜𝑣𝑒𝑟 =
𝐶𝑜𝑠𝑡 𝑜𝑓 𝐺𝑜𝑜𝑑 𝑆𝑜𝑙𝑑
𝐴𝑣𝑒𝑟𝑎𝑔𝑒 𝐼𝑛𝑣𝑒𝑛𝑡𝑜𝑟𝑦
………………………. Eq. 1.2.10
𝐼𝑛𝑣𝑒𝑟𝑛𝑡𝑜𝑟𝑦 𝐻𝑜𝑙𝑑𝑖𝑛𝑔 𝑃𝑒𝑟𝑖𝑜𝑑 (𝐼𝐻𝑃) =
365
𝐼𝑛𝑣𝑒𝑛𝑡𝑜𝑟𝑦 𝑇𝑢𝑟𝑛𝑜𝑣𝑒𝑟
…………………. Eq. 1.2.11
𝑁𝑒𝑡 𝑊𝑜𝑟𝑘𝑖𝑛𝑔 𝐶𝑎𝑝𝑖𝑡𝑎𝑙 𝑟𝑎𝑡𝑖𝑜 =
𝑁𝑒𝑡 𝑠𝑎𝑙𝑒𝑠
𝑊𝑜𝑟𝑘𝑖𝑛𝑔 𝑐𝑎𝑝𝑖𝑡𝑎𝑙
…………..……. Eq. 1.2.12
The shorter the inventory holding period implies that good inventory management. For Net
Working Capital ratio, the higher the value indicate that management is being extremely efficient
in using firm’s short-term assets and liabilities to support sales. If the ratio is too small it indicates
that the company is investing in too many account receivable and inventory asset to support the
sales. Working capital can be calculated by subtracting current liability from current asset.
1.2.3. Leverage Ratio, Solvency or Debt (Long term) Ratio
Leverage or capital structure ratio shows the mix of funds provided by owners and creditors.
Generally, there should be a mix of fund from owner in the form of stock holding contribution and
creditors to support the capital structure of the company.
For short term creditors like, bank, supplier of material and credit union need the ability of the firm
to pay its debt and this is called liquidity ration. But for long term debt, for bond a financial
institution needs long term financial strength of the firm or company instead of liquidity ratio. And
this value will be measured by Debt- Equity ratio, Debt ratio and by Time- Interest Ratio.
𝐷𝑒𝑏𝑡 − 𝐸𝑞𝑢𝑖𝑡𝑦 𝑟𝑎𝑡𝑖𝑜 =
𝑇𝑜𝑡𝑎𝑙 𝐷𝑒𝑏𝑡
𝑇𝑜𝑡𝑎𝑙 𝐸𝑞𝑢𝑖𝑡𝑦
……………………..……. Eq. 1.2.13
⊘ This is a preview!⊘
Do you want full access?
Subscribe today to unlock all pages.
Trusted by 1+ million students worldwide
Financial Ratio Analysis, for Ethiopian Airline Annual Report of 2015 and 2016
Thus, this ratio clearly indicates the status of the company, and any creditor will be confident
enough to support the company if this value is very small.
𝐷𝑒𝑏𝑡 𝑟𝑎𝑡𝑖𝑜 =
𝑇𝑜𝑡𝑎𝑙 𝐷𝑒𝑏𝑡
𝑇𝑜𝑡𝑎𝑙 𝐴𝑠𝑠𝑒𝑡
…………………………..……. Eq. 1.2.14
This ratio as compare to the above ratio, it must be much less. This is because the denominators
included the numerator value in it. If this value is high, it means most of the asset of the firm are
contributed by creditor, and the firm might face difficulty in raising additional debt, since the
creditor will not have a confidence of get back their loan. But if the value is small, it means most
of the asset is funned with equity sources, and if this is the situation creditor will be very happy to
give a loan for the company since the risk is low.
𝑇𝑖𝑚𝑒𝑠 𝐼𝑛𝑡𝑒𝑟𝑒𝑠𝑡 𝐸𝑎𝑟𝑛𝑒𝑑 𝑅𝑎𝑡𝑖𝑜 (𝑇𝐼𝐸) =
𝐸𝑎𝑟𝑛𝑖𝑛𝑔𝑠 𝑏𝑒𝑓𝑜𝑟𝑒 𝐼𝑛𝑡𝑒𝑟𝑒𝑠𝑡 𝑎𝑛𝑑 𝑇𝑎𝑠 (𝐸𝐵𝐼𝑇)
𝐼𝑛𝑡𝑒𝑟𝑒𝑠𝑡 𝐸𝑥𝑝𝑒𝑛𝑠𝑒 ……. Eq. 1.2.15
Time Interest Earned Ratio or Interest Coverage Ratio is the ratio which evaluate the ability of the
company to cover its interest on a timely basis. The higher the value the more confidence will be
the creditor, hence they will get their money with all the expected interest in the specified time. A
higher TIE ratio suggests the firm has sufficient margin of safety to cover its interest charges.
1.2.4. Profitability Ratio
In general, a profitability ratio can give us the percentage of profit out of the total sales, and the
higher the value means the better the profitability can be from the total sales. In other word, the
cost of good sold will be lower. Since total sale is the sum of cost of good sold and gross profit.
The profitability ratios show the combined effects of liquidity, asset management and debt
management on operating result. Profitability ratios are calculated to measure the profitability of
the firm and its operating efficiency.
𝐺𝑟𝑜𝑠𝑠 𝑝𝑟𝑜𝑓𝑖𝑡 𝑀𝑎𝑟𝑔𝑖𝑛 =
𝐺𝑟𝑜𝑠𝑠 𝑝𝑟𝑜𝑓𝑖𝑡
………………..…. Eq. 1.2.16
Paraphrase This Document
Need a fresh take? Get an instant paraphrase of this document with our AI Paraphraser
Financial Ratio Analysis, for Ethiopian Airline Annual Report of 2015 and 2016
𝑂𝑝𝑒𝑟𝑎𝑡𝑖𝑛 𝑃𝑟𝑜𝑓𝑖𝑡 𝑀𝑎𝑟𝑔𝑖𝑛 =
𝐸𝐵𝐼𝑇
𝑁𝑒𝑡 𝑠𝑎𝑙𝑒𝑠
………………..…. Eq. 1.2.17
The operating profit margin is the percent of sales left after all operating expenses are deducted.
𝑁𝑒𝑡 𝑃𝑟𝑜𝑓𝑖𝑡 𝑀𝑎𝑟𝑔𝑖𝑛 =
𝑁𝑒𝑡 𝐼𝑛𝑐𝑜𝑚𝑒
𝑁𝑒𝑡 𝑠𝑎𝑙𝑒𝑠
………………………. Eq. 1.2.18
The above value is the percentage of net income as compare to the net sales. The higher the value
is the company is in a good state. Net Income indicate that all the expenses are deducted from
gross profit, like tax, interest rate etc. A company with higher net profit margin is a company with
strong financial management.
𝐵𝑎𝑠𝑖𝑐 𝐸𝑎𝑟𝑛𝑖𝑛𝑔 𝑃𝑜𝑤𝑒𝑟 =
𝐸𝐵𝐼𝑇
𝑇𝑜𝑡𝑎𝑙 𝐴𝑠𝑠𝑒𝑡𝑠
………………..…. Eq. 1.2.19
The basic earning power ratio measures the operating return on the firm’s assets, regardless of
financial leverage and tax. This ratio measures the operating profit (EBIT) earned per total assets
on the firm’s balance sheet.
𝑅𝑒𝑡𝑢𝑟𝑛 𝑡𝑜 𝑇𝑜𝑡𝑎𝑙 𝐴𝑠𝑠𝑒𝑡𝑠 (𝑅𝑂𝐴) =
𝑁𝑒𝑡 𝐼𝑛𝑐𝑜𝑚𝑒
𝑇𝑜𝑡𝑎𝑙 𝐴𝑠𝑠𝑒𝑡𝑠
………………..…. Eq. 1.2.20
Return on Total Asset (ROA) is a basic financial ratio which measures the percentage of the total
net income the company obtained as compare to its’ total asset. This formula included all the
expenses, like tax, financial leverage. This ratio is the net income earned per dollar of assets on
firm’s balance sheet.
𝑅𝑒𝑡𝑢𝑟𝑛 𝑡𝑜 𝐸𝑞𝑢𝑖𝑡𝑦(𝑅𝑂𝐸) = 𝑁𝑒𝑡 𝐼𝑛𝑐𝑜𝑚𝑒 𝐴𝑣𝑎𝑖𝑙𝑎𝑏𝑙𝑒 𝑖𝑛 𝐶𝑜𝑚𝑚𝑜𝑛 𝐸𝑞𝑢𝑖𝑡𝑦
𝐶𝑜𝑚𝑚𝑜𝑛 𝐸𝑞𝑢𝑖𝑡𝑦 ……….…. Eq. 1.2.21
Return on Equity is the net income earned per dollar of common stockholders’ equity. If a company
has certain equity for the financial asset and if that equity with some leverage obtained a certain
Financial Ratio Analysis, for Ethiopian Airline Annual Report of 2015 and 2016
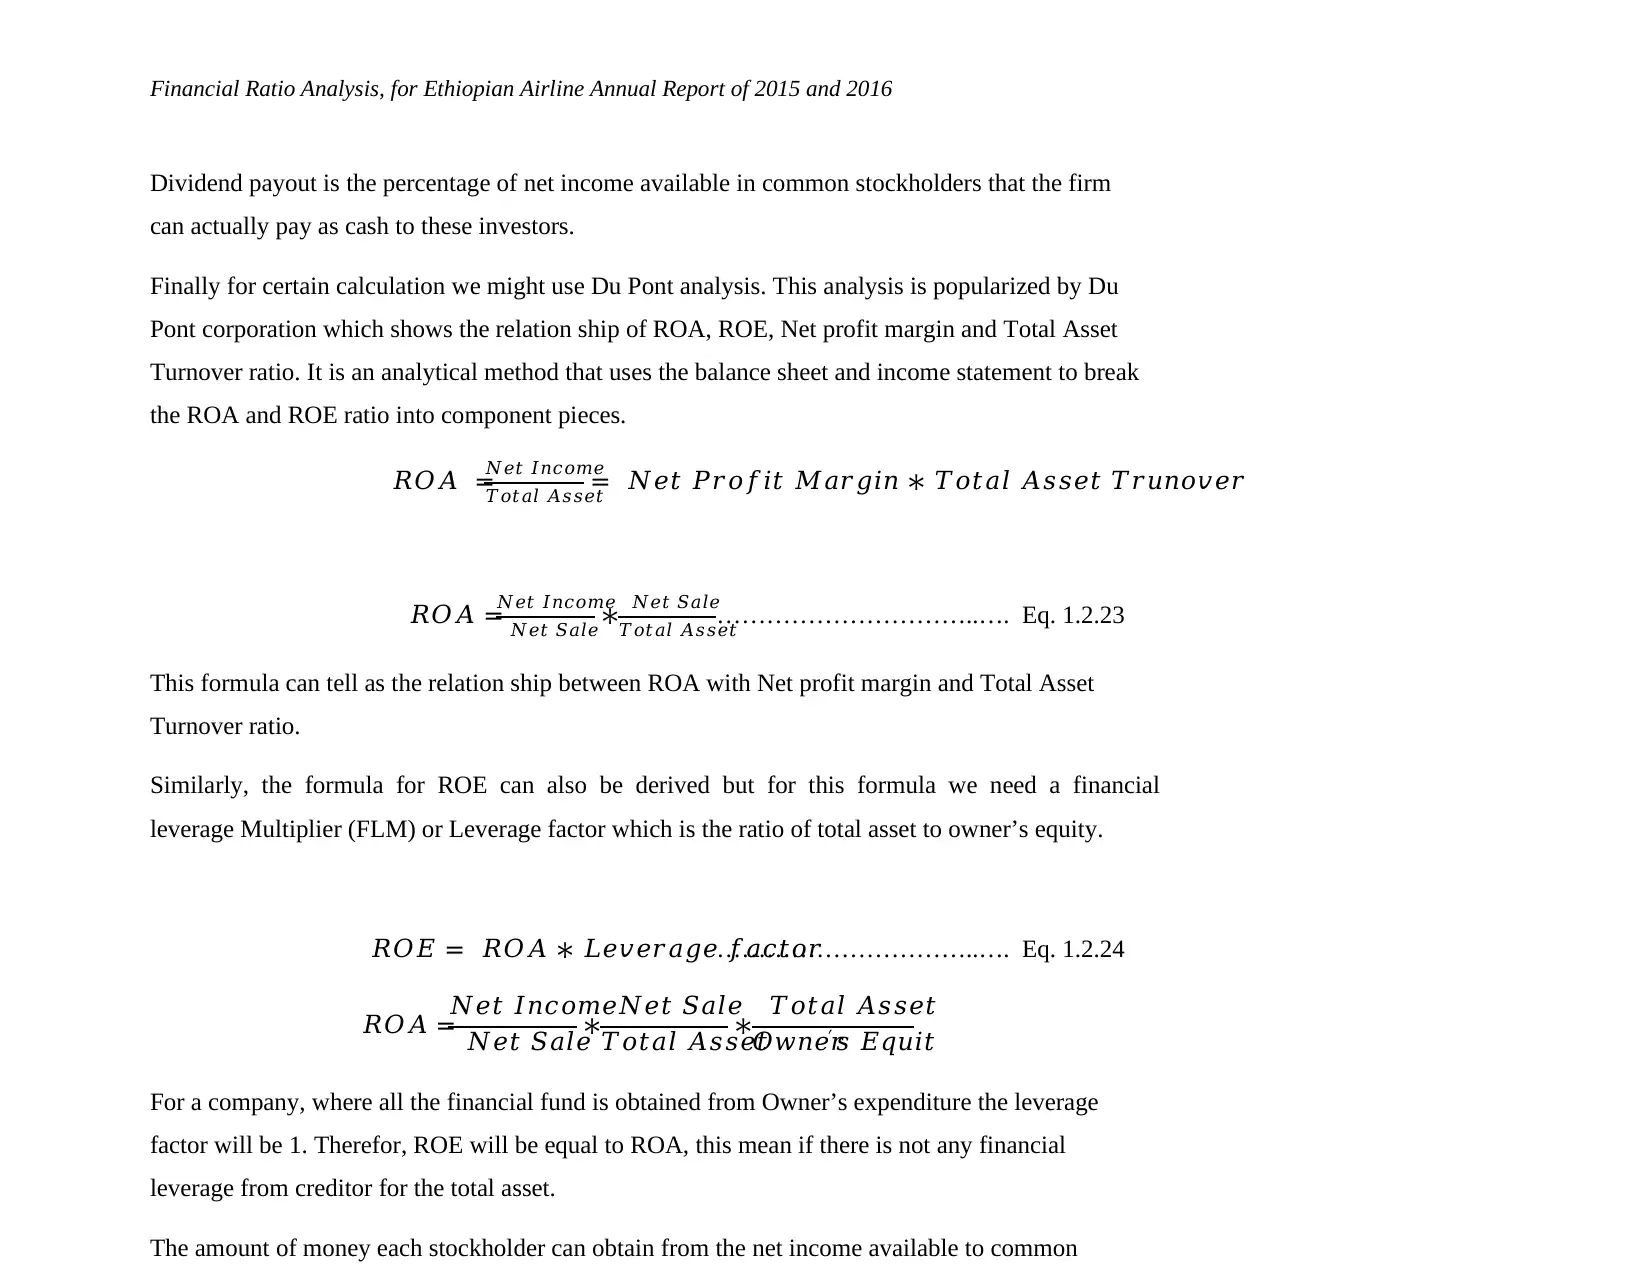
Dividend payout is the percentage of net income available in common stockholders that the firm
can actually pay as cash to these investors.
Finally for certain calculation we might use Du Pont analysis. This analysis is popularized by Du
Pont corporation which shows the relation ship of ROA, ROE, Net profit margin and Total Asset
Turnover ratio. It is an analytical method that uses the balance sheet and income statement to break
the ROA and ROE ratio into component pieces.
𝑅𝑂𝐴 =
𝑁𝑒𝑡 𝐼𝑛𝑐𝑜𝑚𝑒
𝑇𝑜𝑡𝑎𝑙 𝐴𝑠𝑠𝑒𝑡
= 𝑁𝑒𝑡 𝑃𝑟𝑜𝑓𝑖𝑡 𝑀𝑎𝑟𝑔𝑖𝑛 ∗ 𝑇𝑜𝑡𝑎𝑙 𝐴𝑠𝑠𝑒𝑡 𝑇𝑟𝑢𝑛𝑜𝑣𝑒𝑟
𝑅𝑂𝐴 =
𝑁𝑒𝑡 𝐼𝑛𝑐𝑜𝑚𝑒
𝑁𝑒𝑡 𝑆𝑎𝑙𝑒∗ 𝑁𝑒𝑡 𝑆𝑎𝑙𝑒
𝑇𝑜𝑡𝑎𝑙 𝐴𝑠𝑠𝑒𝑡
…………………………..…. Eq. 1.2.23
This formula can tell as the relation ship between ROA with Net profit margin and Total Asset
Turnover ratio.
Similarly, the formula for ROE can also be derived but for this formula we need a financial
leverage Multiplier (FLM) or Leverage factor which is the ratio of total asset to owner’s equity.
𝑅𝑂𝐸 = 𝑅𝑂𝐴 ∗ 𝐿𝑒𝑣𝑒𝑟𝑎𝑔𝑒 𝑓𝑎𝑐𝑡𝑜𝑟…………………………..…. Eq. 1.2.24
𝑅𝑂𝐴 =
𝑁𝑒𝑡 𝐼𝑛𝑐𝑜𝑚𝑒
𝑁𝑒𝑡 𝑆𝑎𝑙𝑒
∗ 𝑁𝑒𝑡 𝑆𝑎𝑙𝑒
𝑇𝑜𝑡𝑎𝑙 𝐴𝑠𝑠𝑒𝑡
∗ 𝑇𝑜𝑡𝑎𝑙 𝐴𝑠𝑠𝑒𝑡
𝑂𝑤𝑛𝑒𝑟′ 𝑠 𝐸𝑞𝑢𝑖𝑡
For a company, where all the financial fund is obtained from Owner’s expenditure the leverage
factor will be 1. Therefor, ROE will be equal to ROA, this mean if there is not any financial
leverage from creditor for the total asset.
The amount of money each stockholder can obtain from the net income available to common
⊘ This is a preview!⊘
Do you want full access?
Subscribe today to unlock all pages.
Trusted by 1+ million students worldwide
Financial Ratio Analysis, for Ethiopian Airline Annual Report of 2015 and 2016
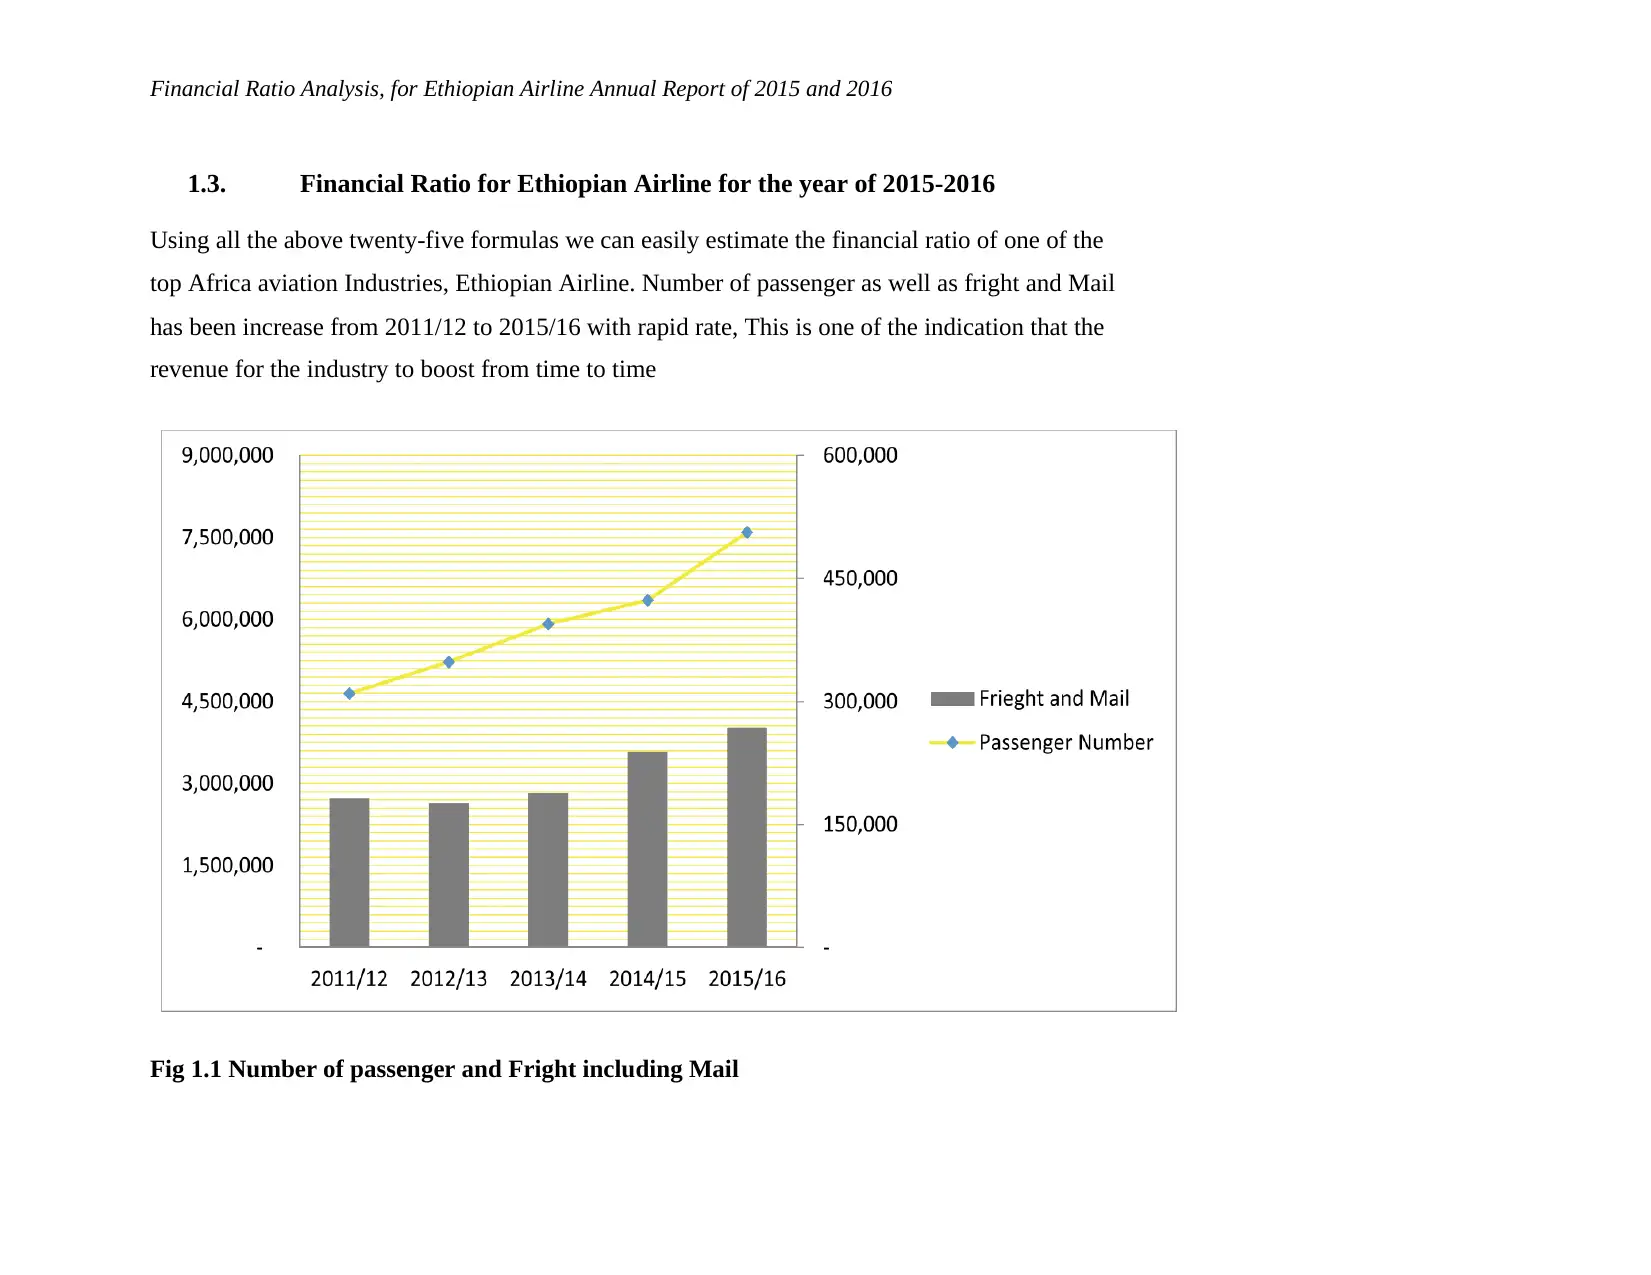
1.3. Financial Ratio for Ethiopian Airline for the year of 2015-2016
Using all the above twenty-five formulas we can easily estimate the financial ratio of one of the
top Africa aviation Industries, Ethiopian Airline. Number of passenger as well as fright and Mail
has been increase from 2011/12 to 2015/16 with rapid rate, This is one of the indication that the
revenue for the industry to boost from time to time
Fig 1.1 Number of passenger and Fright including Mail
Paraphrase This Document
Need a fresh take? Get an instant paraphrase of this document with our AI Paraphraser
Financial Ratio Analysis, for Ethiopian Airline Annual Report of 2015 and 2016
Investment Analysis and Financial Management pg. 9
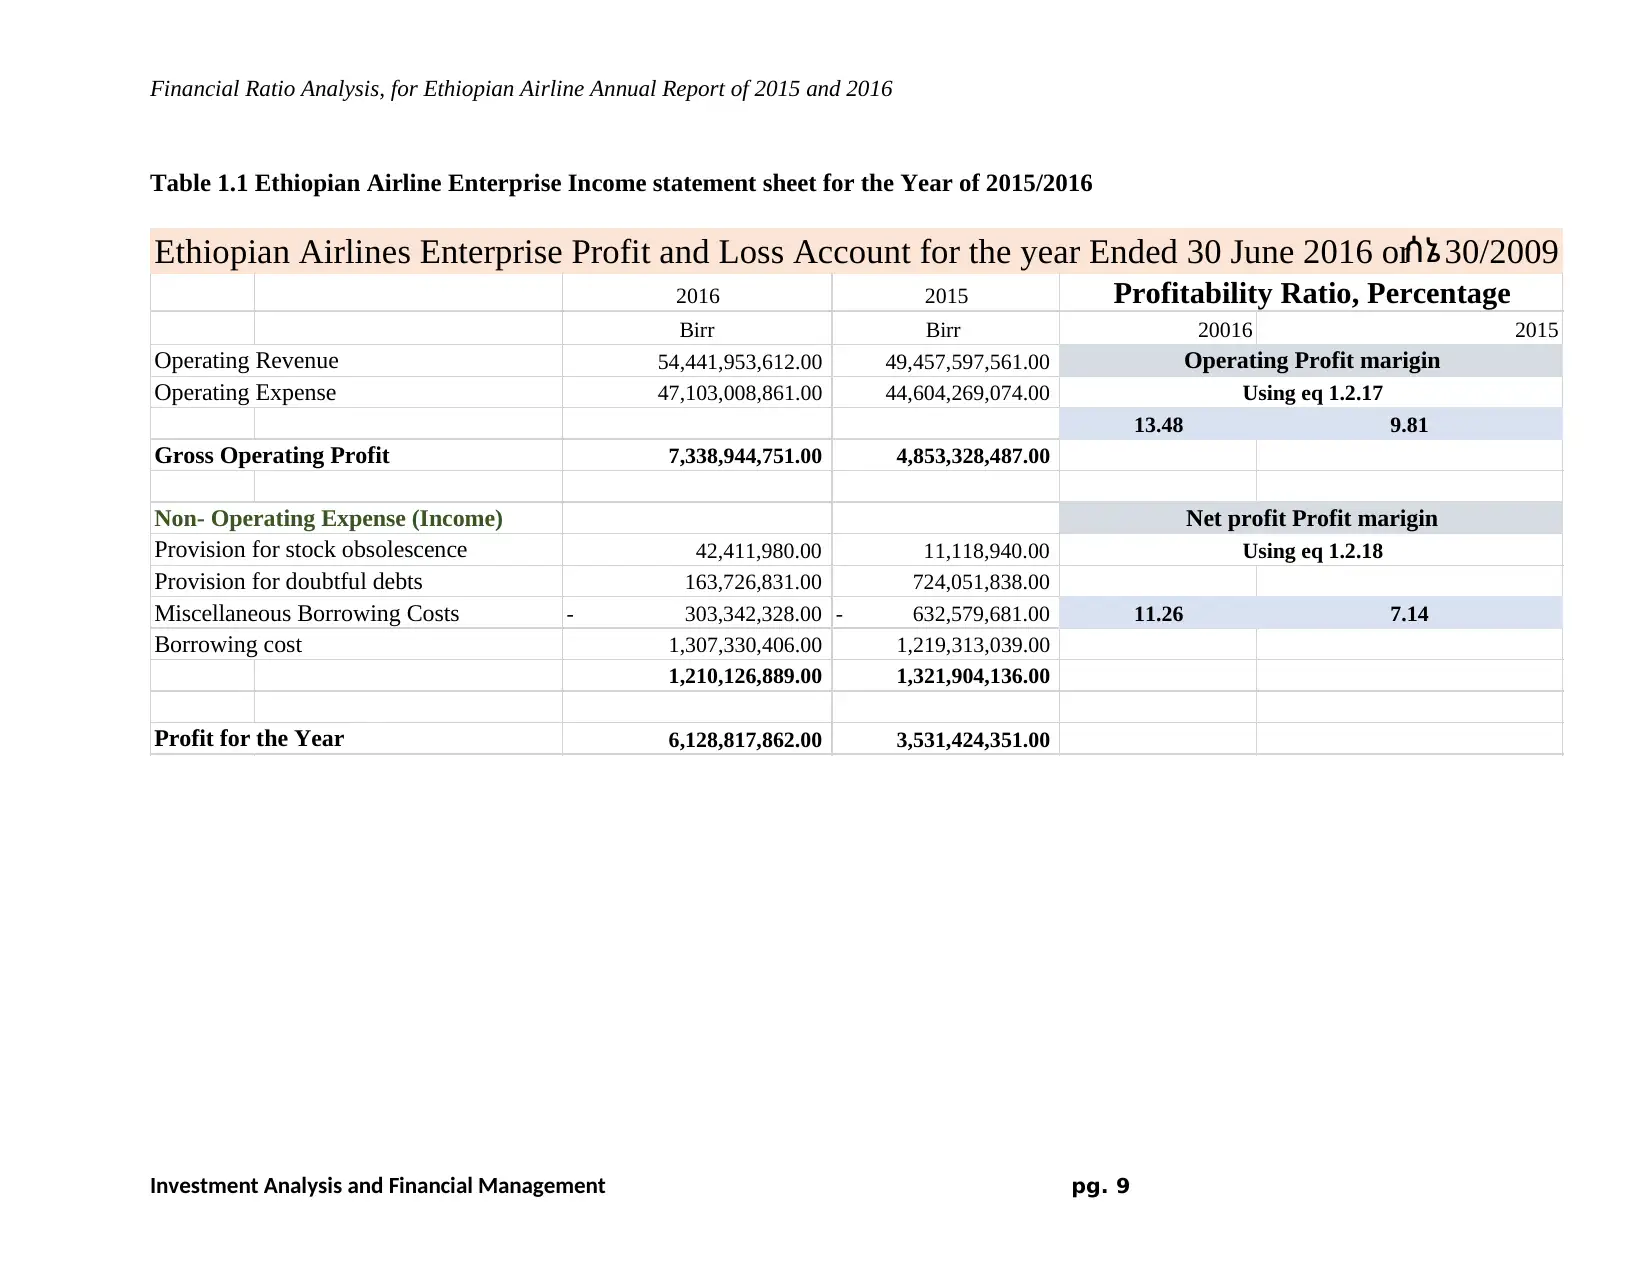
Table 1.1 Ethiopian Airline Enterprise Income statement sheet for the Year of 2015/2016
2016 2015
Birr Birr 20016 2015
Operating Revenue 54,441,953,612.00 49,457,597,561.00
Operating Expense 47,103,008,861.00 44,604,269,074.00
13.48 9.81
Gross Operating Profit 7,338,944,751.00 4,853,328,487.00
Non- Operating Expense (Income)
Provision for stock obsolescence 42,411,980.00 11,118,940.00
Provision for doubtful debts 163,726,831.00 724,051,838.00
Miscellaneous Borrowing Costs 303,342,328.00- 632,579,681.00- 11.26 7.14
Borrowing cost 1,307,330,406.00 1,219,313,039.00
1,210,126,889.00 1,321,904,136.00
Profit for the Year 6,128,817,862.00 3,531,424,351.00
Profitability Ratio, Percentage
Net profit Profit marigin
Using eq 1.2.18
Operating Profit marigin
Ethiopian Airlines Enterprise Profit and Loss Account for the year Ended 30 June 2016 orሰኔ 30/2009
Using eq 1.2.17
Investment Analysis and Financial Management pg. 9
Table 1.1 Ethiopian Airline Enterprise Income statement sheet for the Year of 2015/2016
2016 2015
Birr Birr 20016 2015
Operating Revenue 54,441,953,612.00 49,457,597,561.00
Operating Expense 47,103,008,861.00 44,604,269,074.00
13.48 9.81
Gross Operating Profit 7,338,944,751.00 4,853,328,487.00
Non- Operating Expense (Income)
Provision for stock obsolescence 42,411,980.00 11,118,940.00
Provision for doubtful debts 163,726,831.00 724,051,838.00
Miscellaneous Borrowing Costs 303,342,328.00- 632,579,681.00- 11.26 7.14
Borrowing cost 1,307,330,406.00 1,219,313,039.00
1,210,126,889.00 1,321,904,136.00
Profit for the Year 6,128,817,862.00 3,531,424,351.00
Profitability Ratio, Percentage
Net profit Profit marigin
Using eq 1.2.18
Operating Profit marigin
Ethiopian Airlines Enterprise Profit and Loss Account for the year Ended 30 June 2016 orሰኔ 30/2009
Using eq 1.2.17
Financial Ratio Analysis, for Ethiopian Airline Annual Report of 2015 and 2016
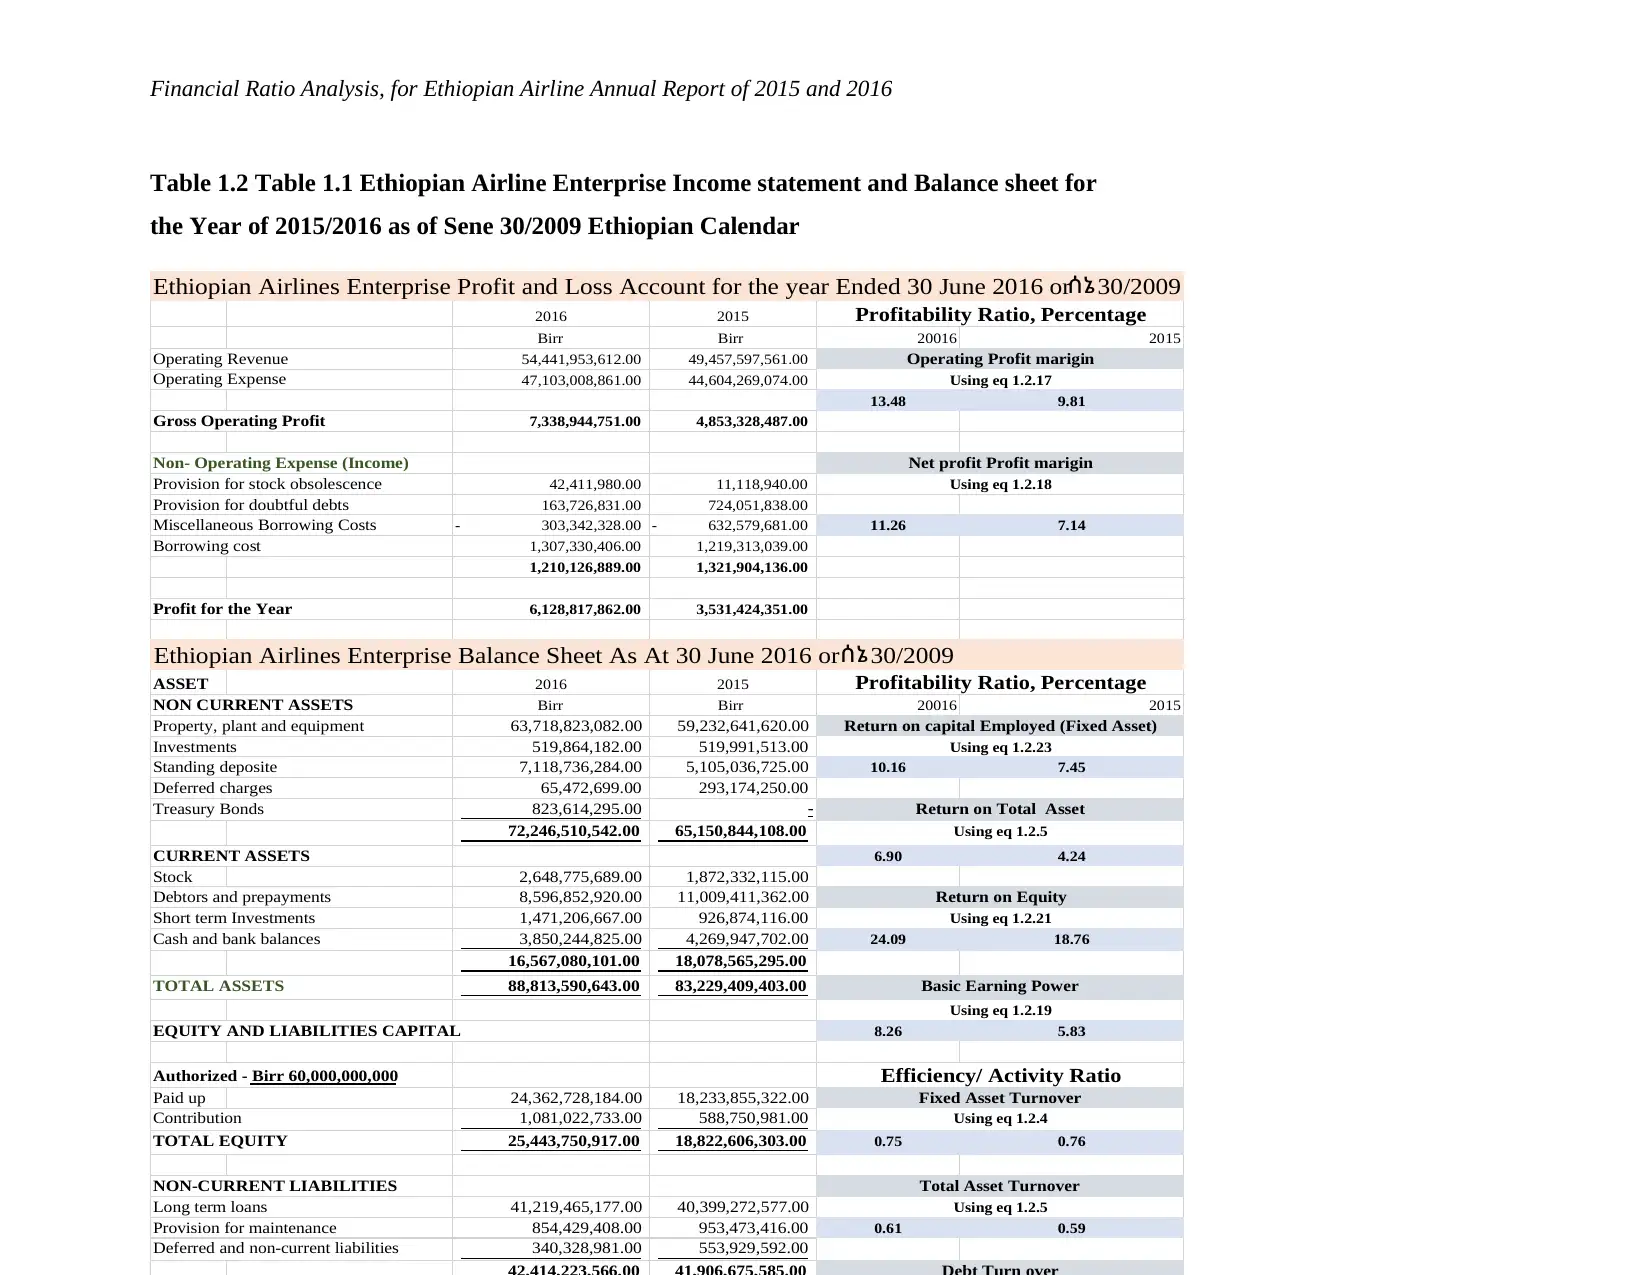
Table 1.2 Table 1.1 Ethiopian Airline Enterprise Income statement and Balance sheet for
the Year of 2015/2016 as of Sene 30/2009 Ethiopian Calendar
2016 2015
Birr Birr 20016 2015
Operating Revenue 54,441,953,612.00 49,457,597,561.00
Operating Expense 47,103,008,861.00 44,604,269,074.00
13.48 9.81
Gross Operating Profit 7,338,944,751.00 4,853,328,487.00
Non- Operating Expense (Income)
Provision for stock obsolescence 42,411,980.00 11,118,940.00
Provision for doubtful debts 163,726,831.00 724,051,838.00
Miscellaneous Borrowing Costs 303,342,328.00- 632,579,681.00- 11.26 7.14
Borrowing cost 1,307,330,406.00 1,219,313,039.00
1,210,126,889.00 1,321,904,136.00
Profit for the Year 6,128,817,862.00 3,531,424,351.00
ASSET 2016 2015
NON CURRENT ASSETS Birr Birr 20016 2015
Property, plant and equipment 63,718,823,082.00 59,232,641,620.00
Investments 519,864,182.00 519,991,513.00
Standing deposite 7,118,736,284.00 5,105,036,725.00 10.16 7.45
Deferred charges 65,472,699.00 293,174,250.00
Treasury Bonds 823,614,295.00 -
72,246,510,542.00 65,150,844,108.00
CURRENT ASSETS 6.90 4.24
Stock 2,648,775,689.00 1,872,332,115.00
Debtors and prepayments 8,596,852,920.00 11,009,411,362.00
Short term Investments 1,471,206,667.00 926,874,116.00
Cash and bank balances 3,850,244,825.00 4,269,947,702.00 24.09 18.76
16,567,080,101.00 18,078,565,295.00
TOTAL ASSETS 88,813,590,643.00 83,229,409,403.00
EQUITY AND LIABILITIES CAPITAL 8.26 5.83
Authorized - Birr 60,000,000,000
Paid up 24,362,728,184.00 18,233,855,322.00
Contribution 1,081,022,733.00 588,750,981.00
TOTAL EQUITY 25,443,750,917.00 18,822,606,303.00 0.75 0.76
NON-CURRENT LIABILITIES
Long term loans 41,219,465,177.00 40,399,272,577.00
Provision for maintenance 854,429,408.00 953,473,416.00 0.61 0.59
Deferred and non-current liabilities 340,328,981.00 553,929,592.00
Fixed Asset Turnover
Using eq 1.2.4
Total Asset Turnover
Using eq 1.2.5
Basic Earning Power
Profitability Ratio, Percentage
Profitability Ratio, Percentage
Efficiency/ Activity Ratio
Using eq 1.2.23
Using eq 1.2.5
Using eq 1.2.19
Using eq 1.2.21
Return on Total Asset
Return on Equity
Net profit Profit marigin
Using eq 1.2.18
Ethiopian Airlines Enterprise Balance Sheet As At 30 June 2016 orሰኔ 30/2009
Return on capital Employed (Fixed Asset)
Operating Profit marigin
Ethiopian Airlines Enterprise Profit and Loss Account for the year Ended 30 June 2016 orሰኔ 30/2009
Using eq 1.2.17
⊘ This is a preview!⊘
Do you want full access?
Subscribe today to unlock all pages.
Trusted by 1+ million students worldwide
1 out of 17
Related Documents


Your All-in-One AI-Powered Toolkit for Academic Success.
+13062052269
info@desklib.com
Available 24*7 on WhatsApp / Email
![[object Object]](/_next/static/media/star-bottom.7253800d.svg)
Unlock your academic potential
Copyright © 2020–2026 A2Z Services. All Rights Reserved. Developed and managed by ZUCOL.