Detailed Guide to Financial Ratio Analysis: Course Overview
VerifiedAdded on 2019/10/16
|21
|2752
|338
Homework Assignment
AI Summary
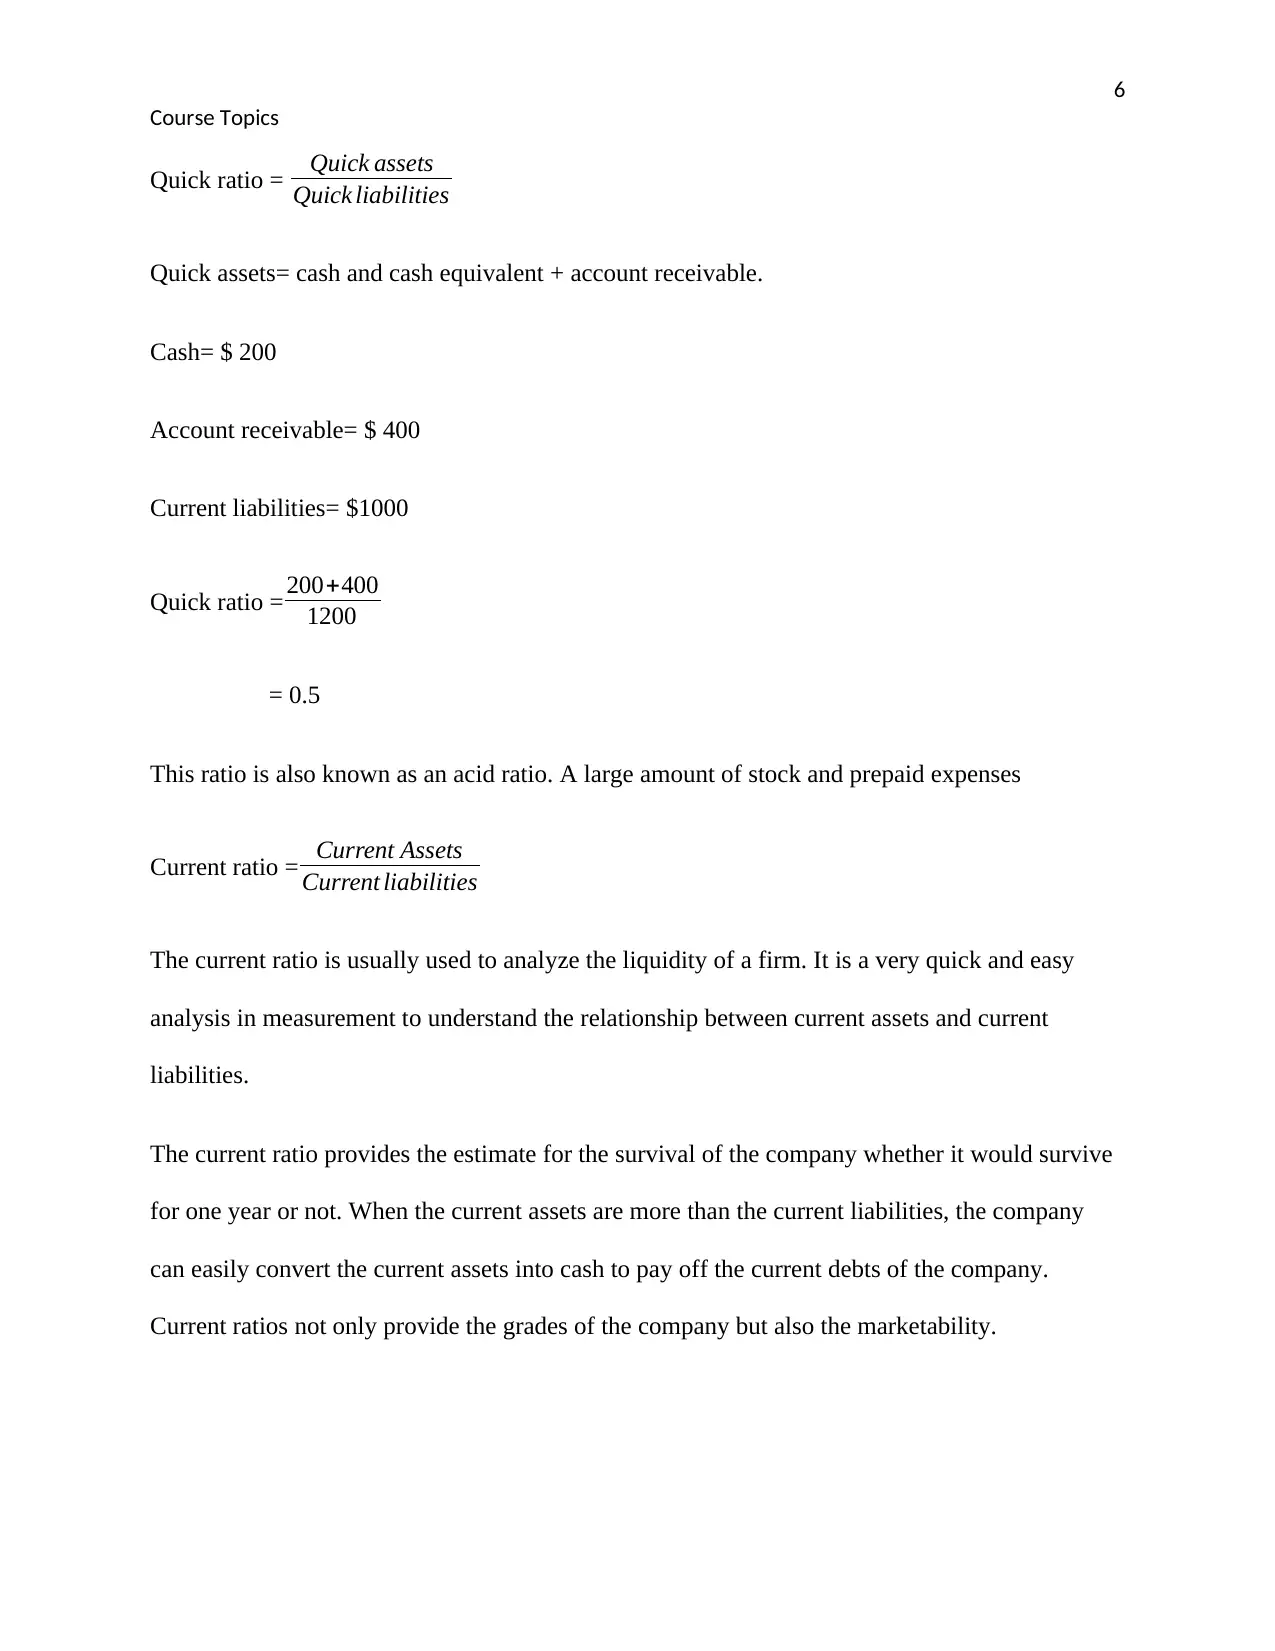
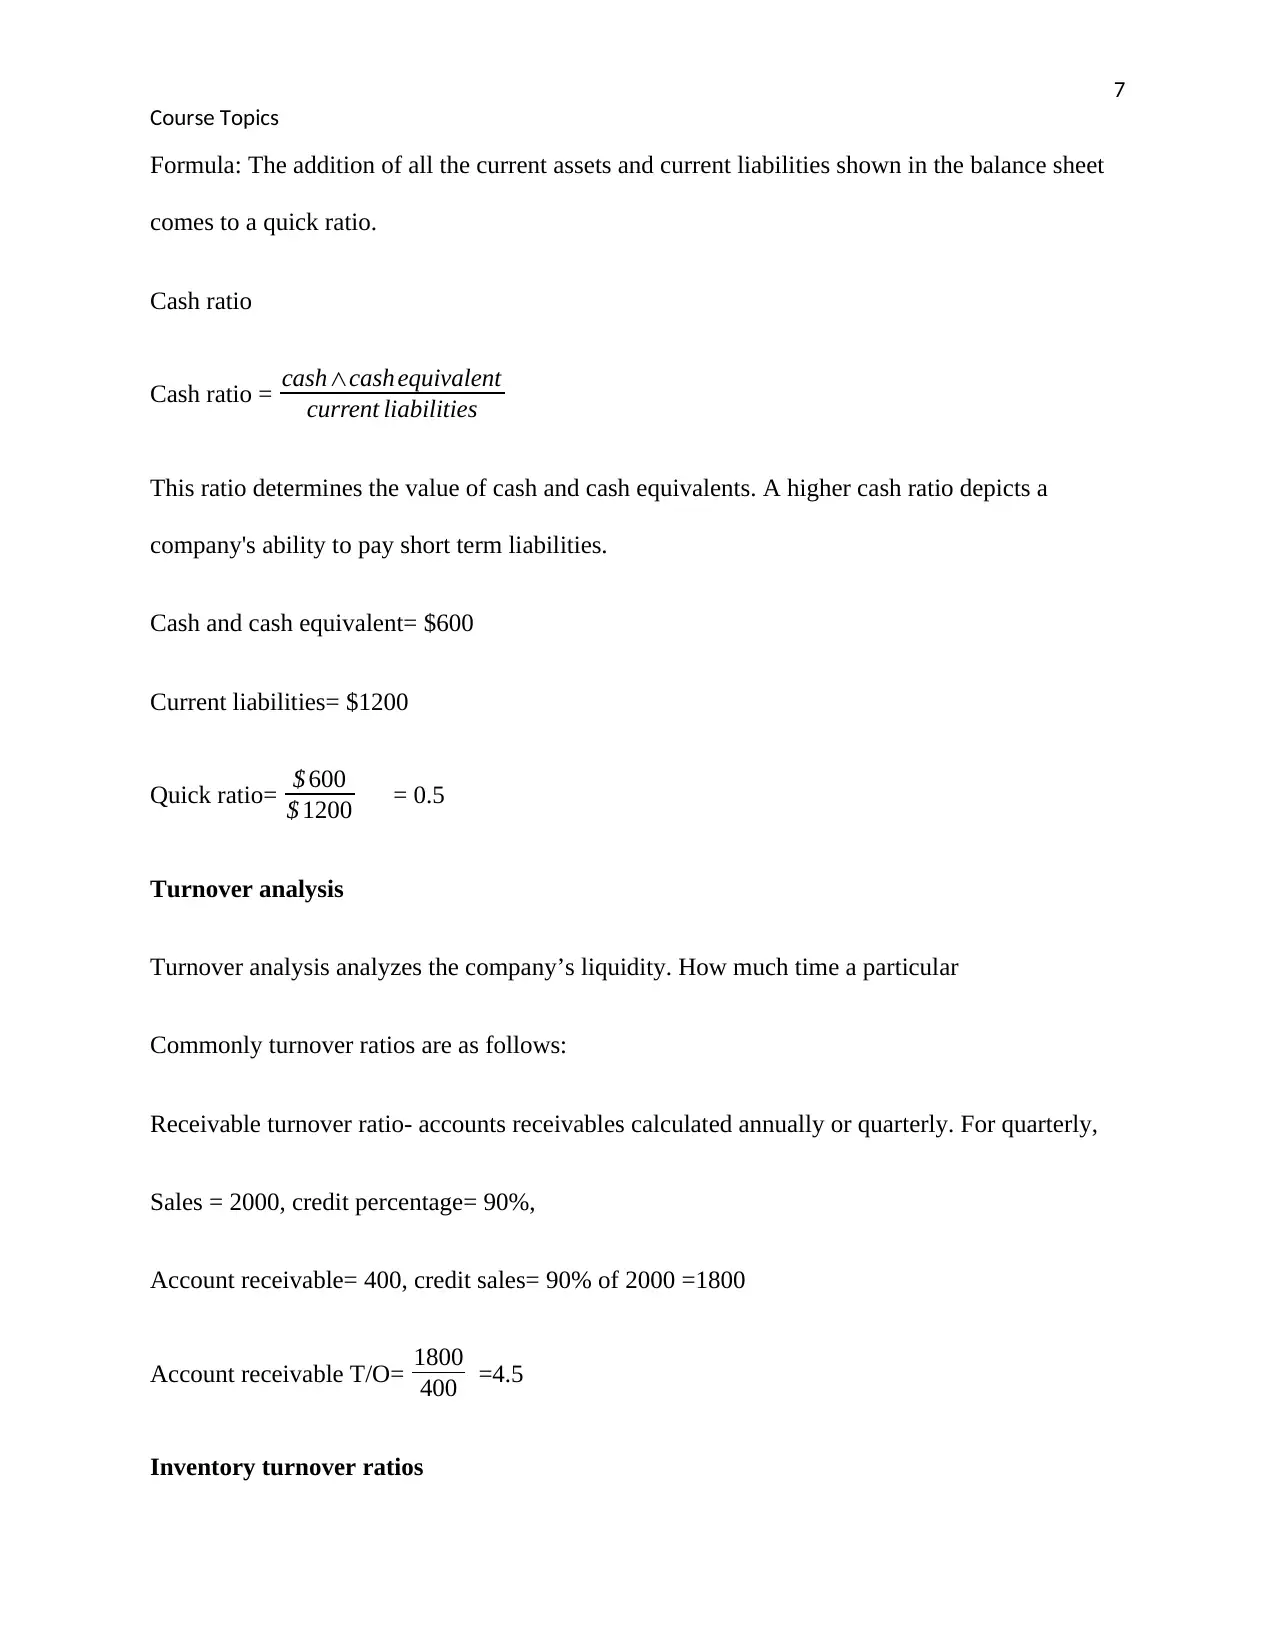
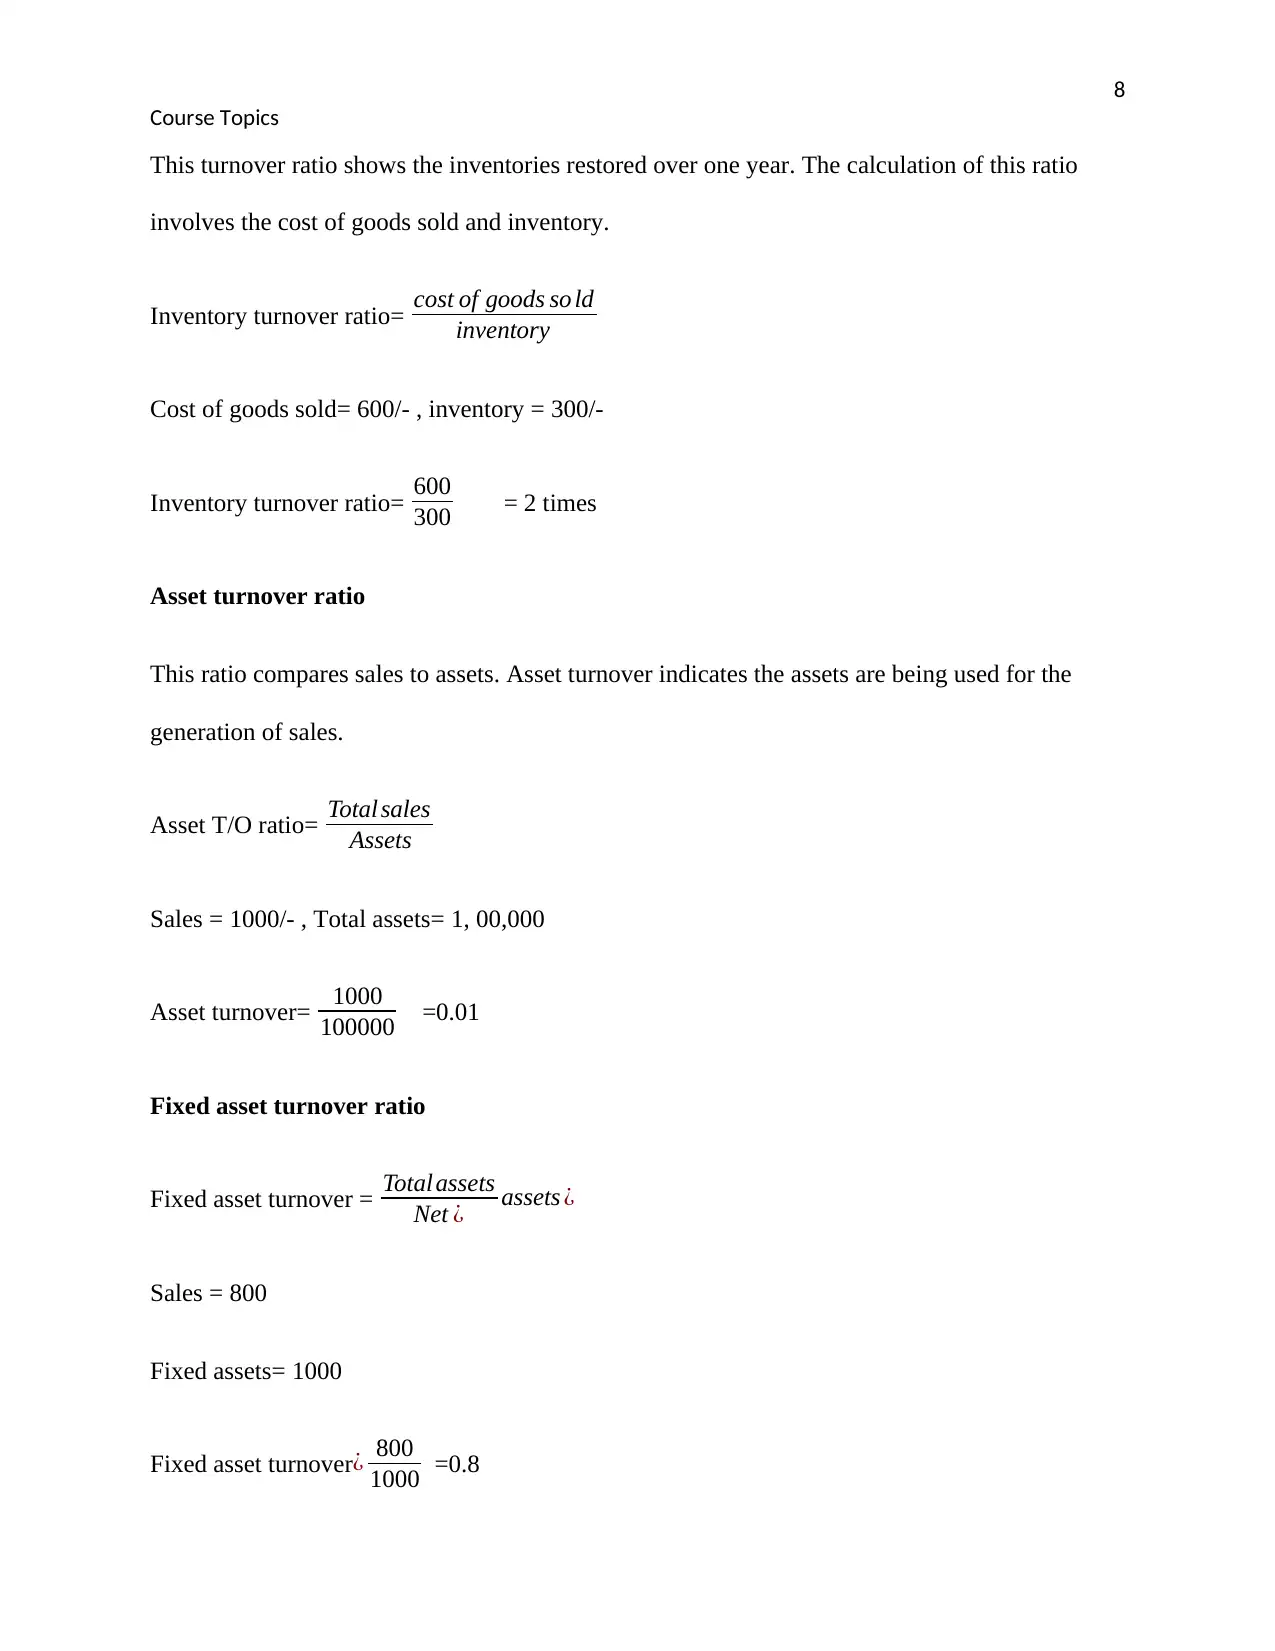
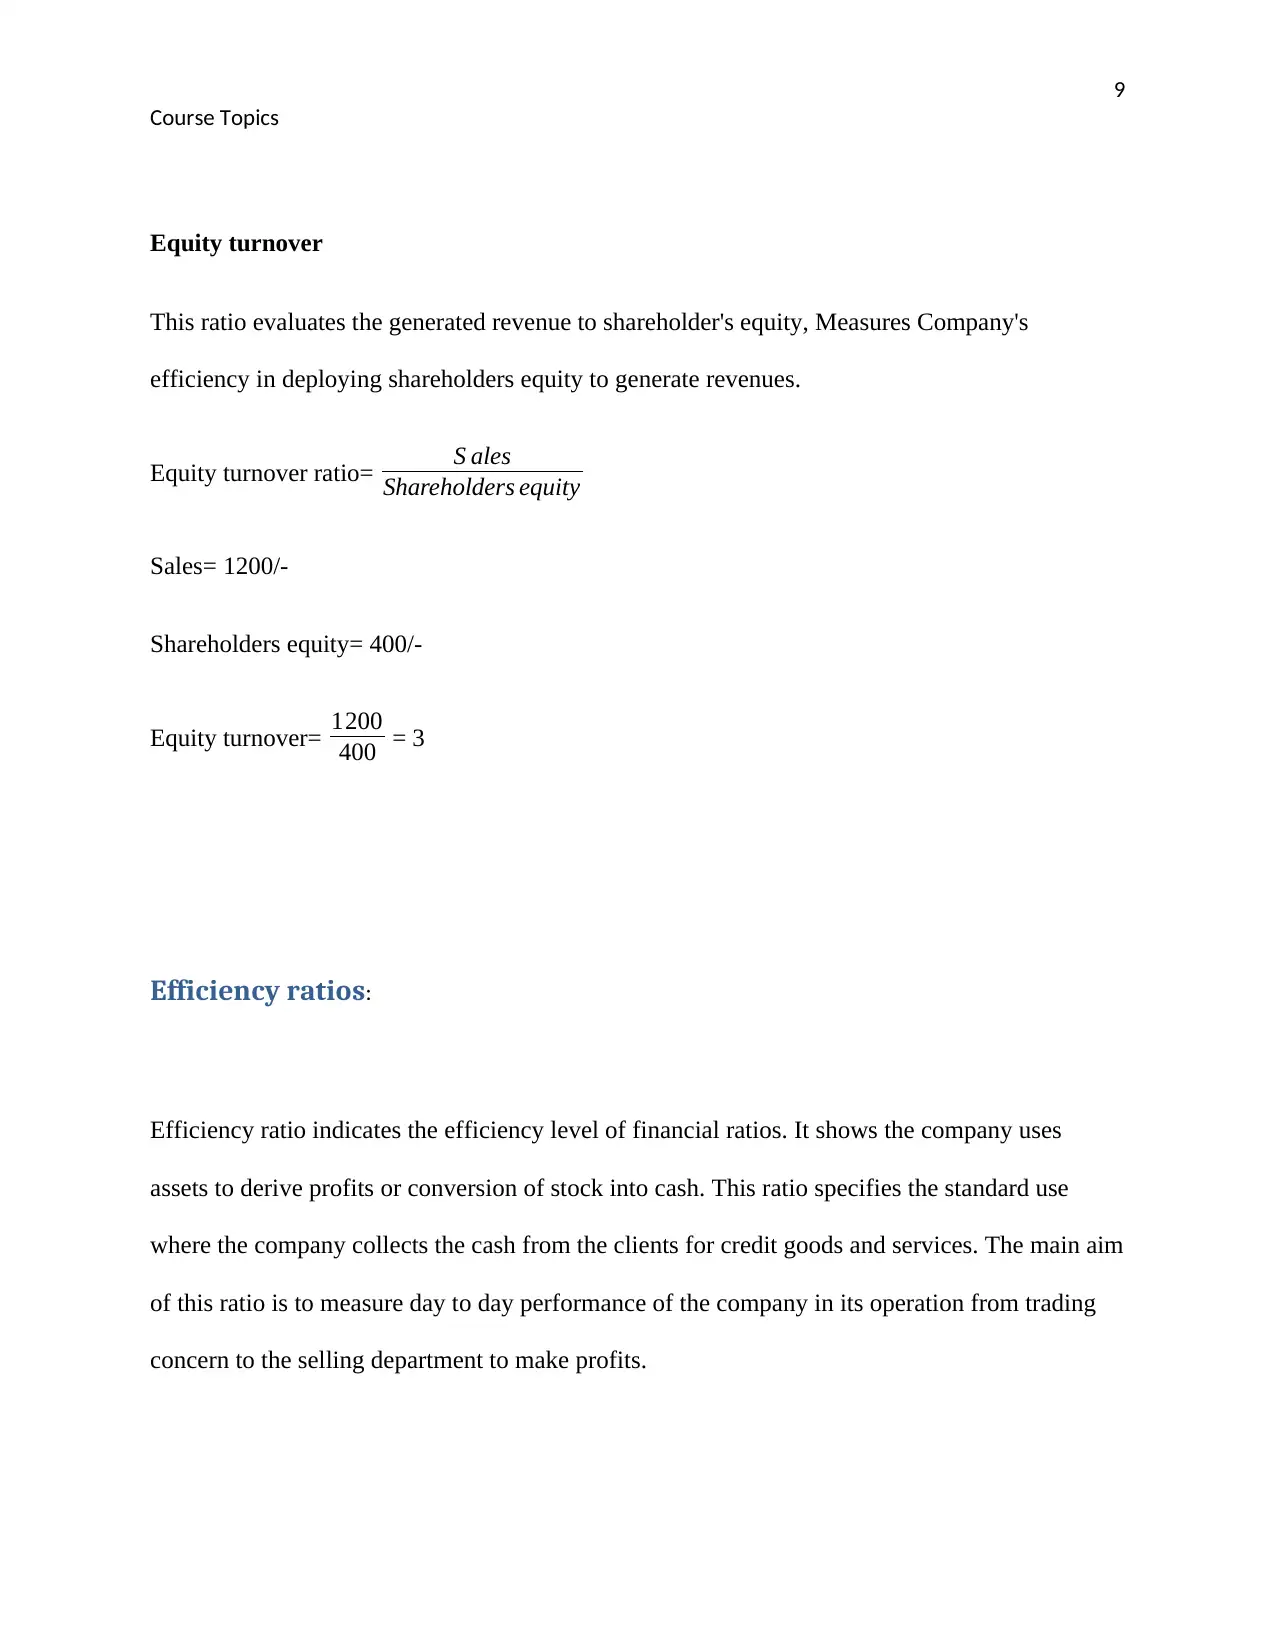
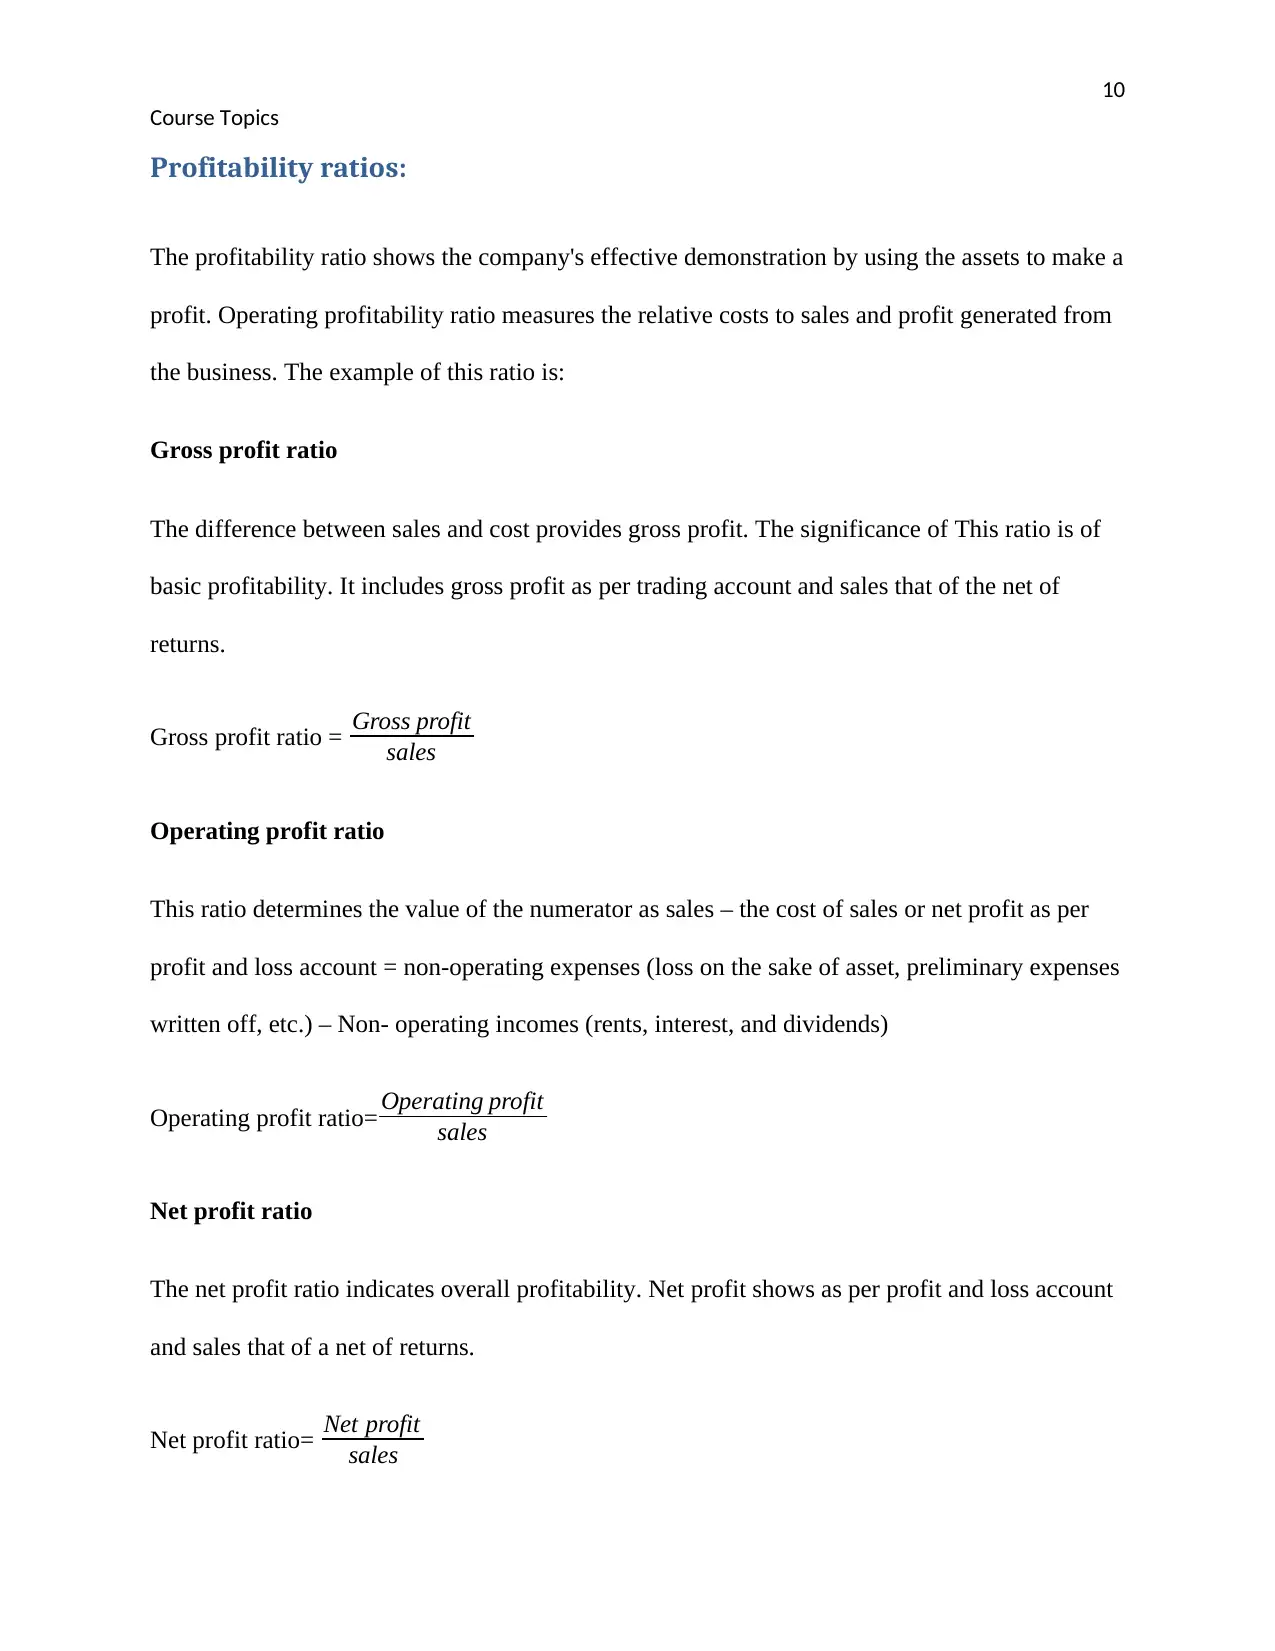
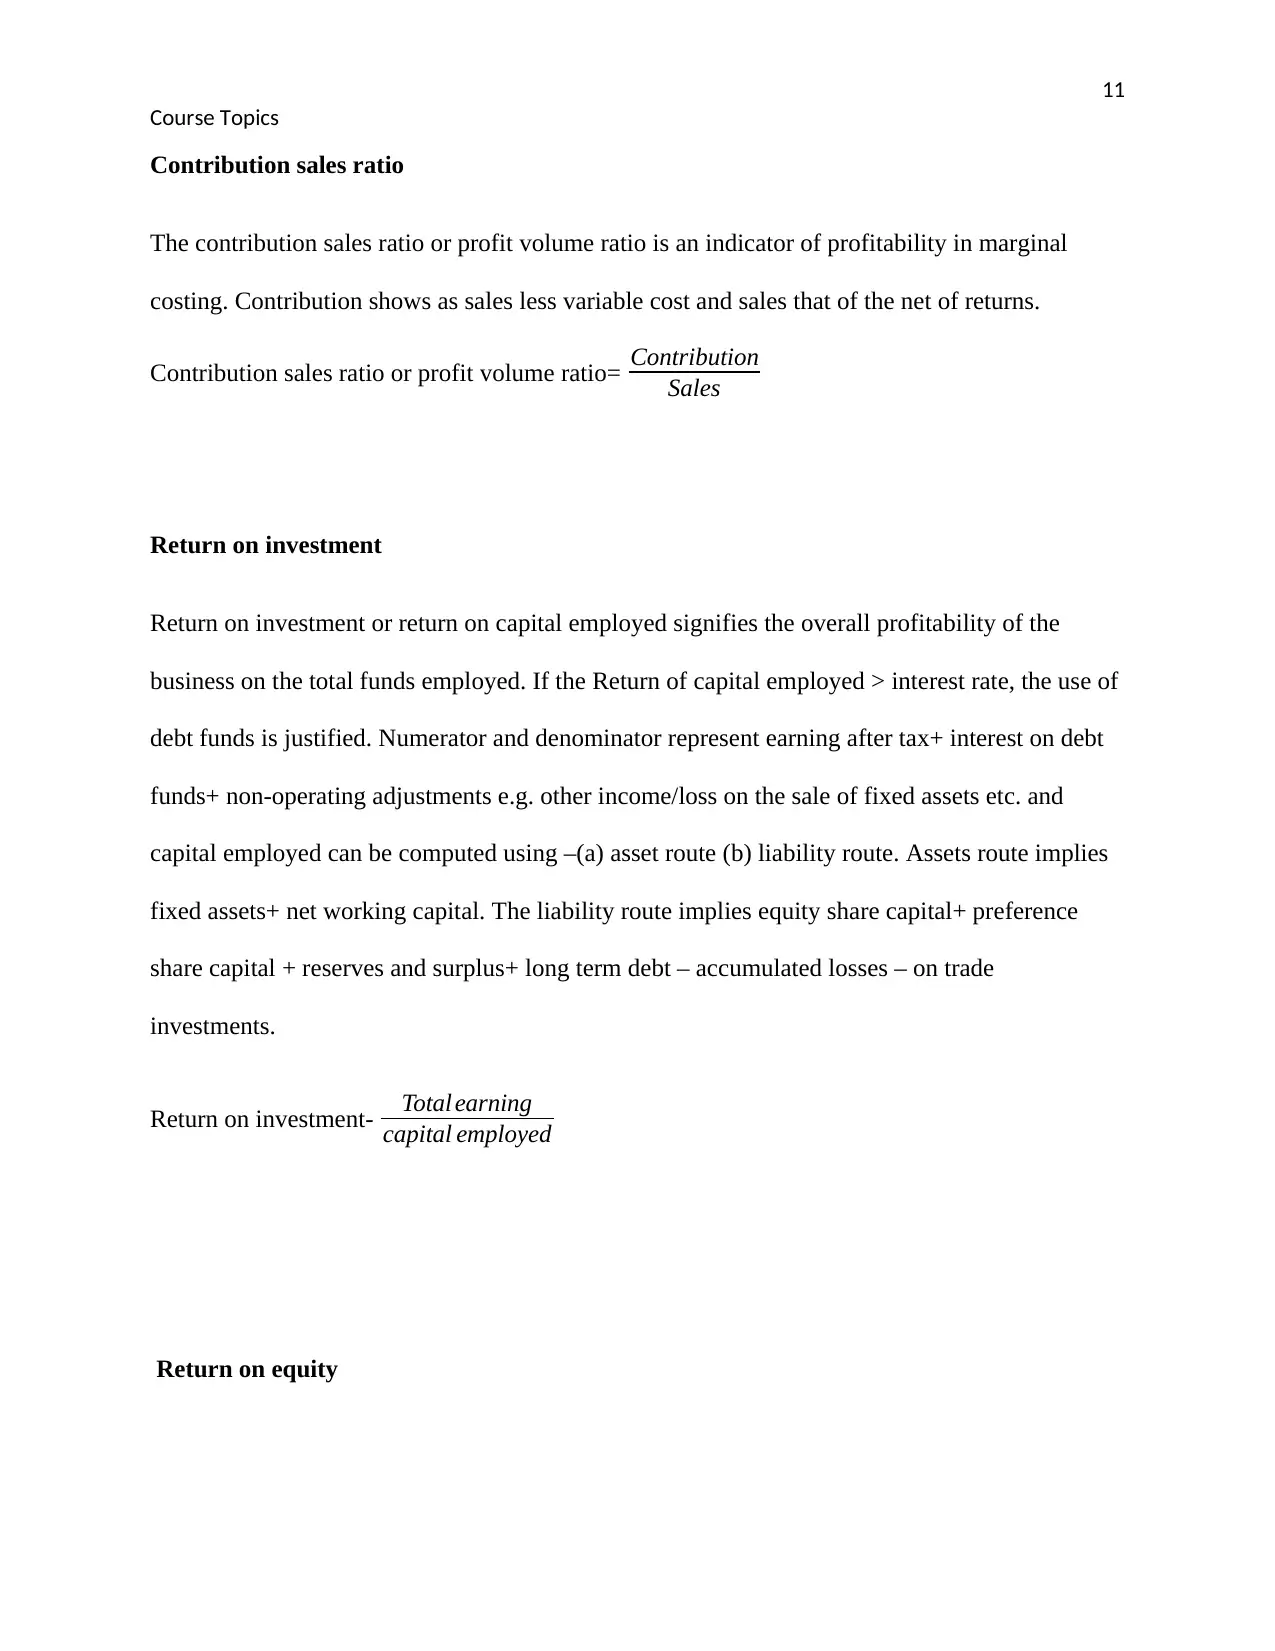
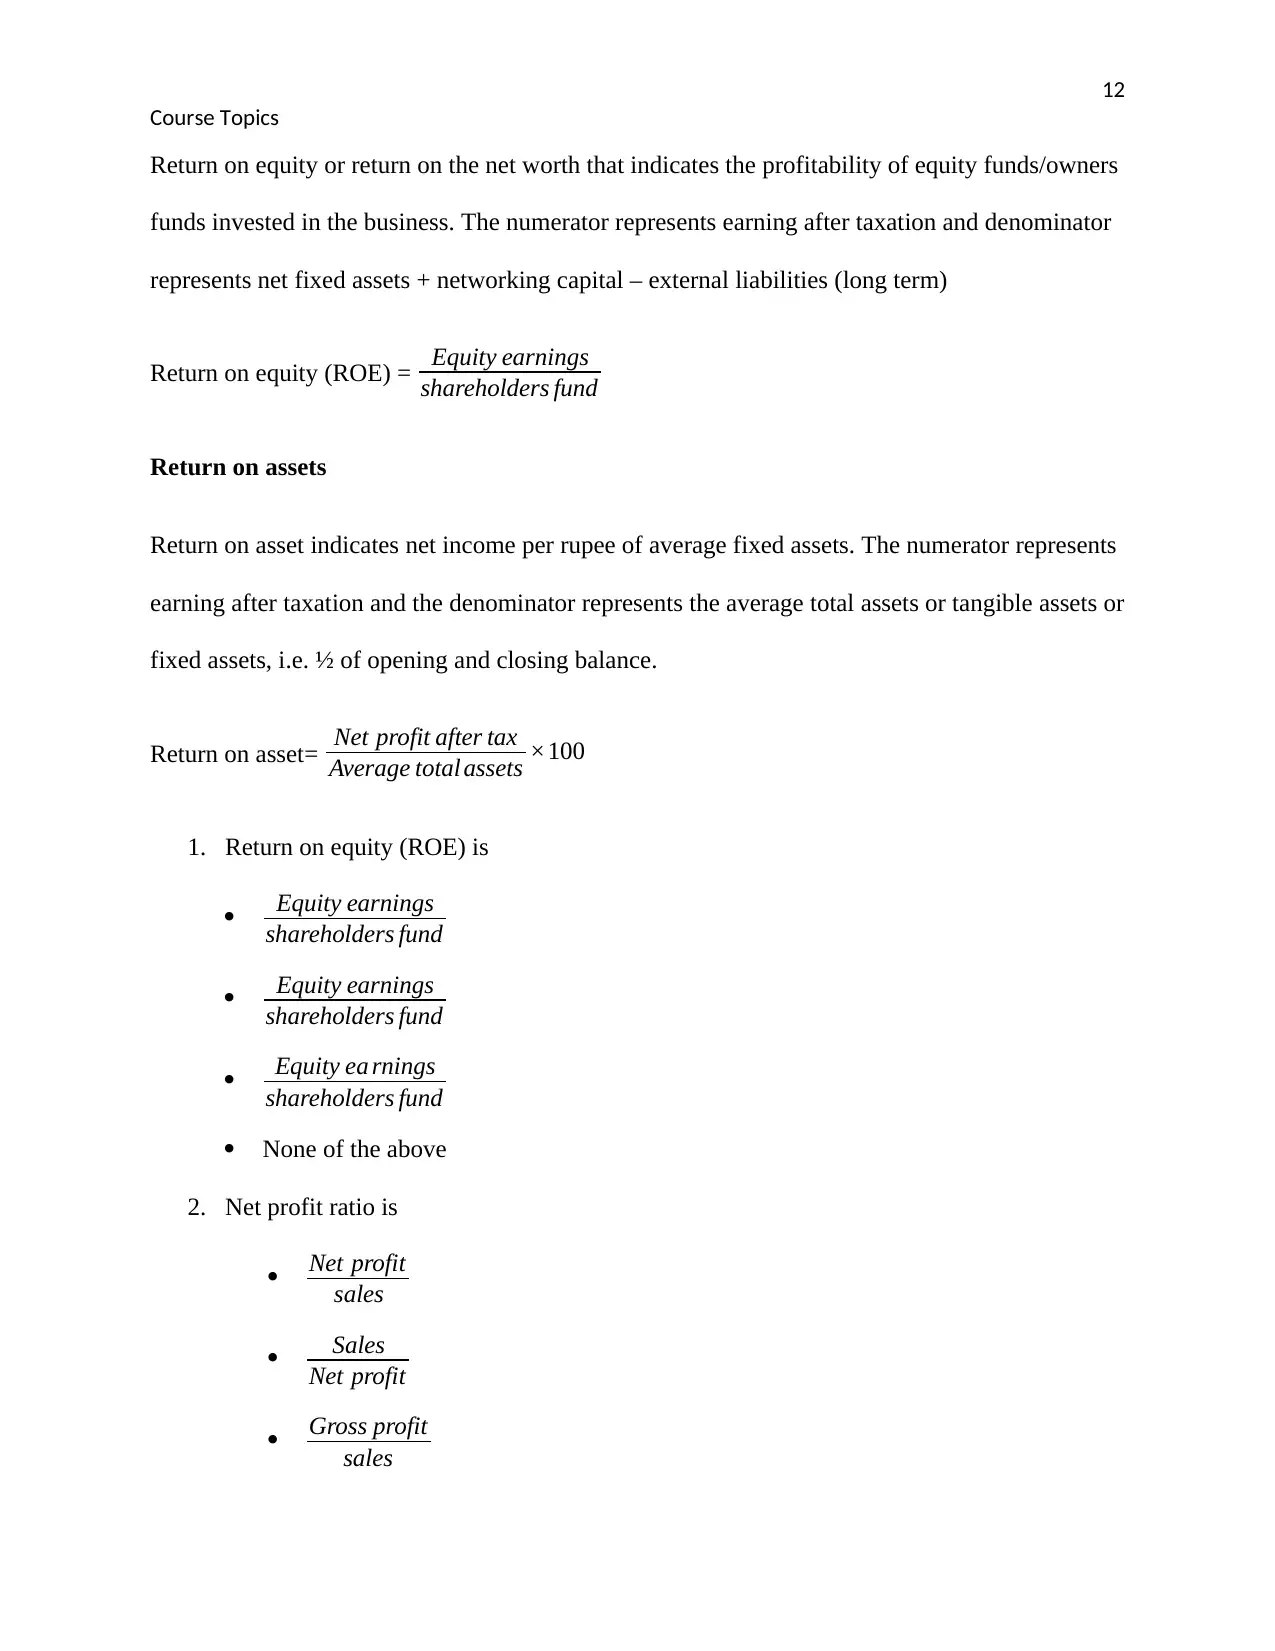
This document provides a comprehensive overview of financial ratio analysis, a crucial tool for interpreting financial statements. It begins with an introduction to ratio analysis, explaining its purpose and importance in evaluating a company's performance, including profitability, risk, and efficiency. The document then classifies various types of financial ratios, such as balance sheet ratios, revenue statement ratios, and combined ratios, using examples. It delves into specific categories, including solvency, liquidity, turnover, efficiency, profitability, and valuation ratios. Each category is explained with formulas and examples, such as debt-to-equity, current, quick, and cash ratios for liquidity, and gross profit, operating profit, and net profit ratios for profitability. The document also covers valuation ratios like price-earning ratio, earnings per share, and dividend per share. Finally, it concludes by emphasizing the interconnectedness of these ratios and their collective role in providing a holistic view of a company's financial health. This analysis is valuable for investors, managers, and anyone seeking to understand the financial performance of a business. The document also includes a quiz to test the understanding of the concepts.
Contribute Materials
Your contribution can guide someone’s learning journey. Share your
documents today.

qwertyuiopasdfghjklzxcvbnmqwertyui
opasdfghjklzxcvbnmqwertyuiopasdfgh
jklzxcvbnmqwertyuiopasdfghjklzxcvb
nmqwertyuiopasdfghjklzxcvbnmqwer
tyuiopasdfghjklzxcvbnmqwertyuiopas
dfghjklzxcvbnmqwertyuiopasdfghjklzx
cvbnmqwertyuiopasdfghjklzxcvbnmq
wertyuiopasdfghjklzxcvbnmqwertyuio
pasdfghjklzxcvbnmqwertyuiopasdfghj
klzxcvbnmqwertyuiopasdfghjklzxcvbn
mqwertyuiopasdfghjklzxcvbnmqwerty
uiopasdfghjklzxcvbnmqwertyuiopasdf
ghjklzxcvbnmqwertyuiopasdfghjklzxc
vbnmqwertyuiopasdfghjklzxcvbnmrty
uiopasdfghjklzxcvbnmqwertyuiopasdf
ghjklzxcvbnmqwertyuiopasdfghjklzxc
Course Topics
Secure Best Marks with AI Grader
Need help grading? Try our AI Grader for instant feedback on your assignments.

2
Course Topics
Overview
How to do ratio analysis for financial statements?
Financial statement analysis use ratio analysis formulas to draw a meaningful interpretation of
the data given in financial statements. This analysis helps investors to adopt a user-oriented
approach rather than traditional proprietary approach. Considering the various types of ratios
help investors to easily obtain the data from some ratios. This course aims to learn how to do
ratio analysis for the financial statement. This course first covers the meaning and definition of
ratio analysis in the introductory part and next to the various types of examples of financial
ratios. This course focuses on the purpose of the financial statement that is to evaluate its
performance in management's profitability, risk, and efficiency. The importance of ratio analysis
is to access the financial statement and analyze it. This analysis compares the company’s trends
with others over a specific period.
A ratio measures the relationship between two financial figures. In this corporate finance world,
ratios specify the company's standard performance and help the investors and managers to
analyze the operations. The ratios may be classified according to the financial statement on the
basic leading categories from which the ratios are derived.
Balance sheet ratios
Revenue statement ratios
Combined ratios
The ratio measures the relationship between two financial figures. Considering an example if
there are four cell phones and two calculators, now it can be said that cell phones and calculators

3
Course Topics
are in the ratio of 4:2. This shows that there are four cell phones for every two calculators. In the
corporate world of finance, ratios show the performance of companies. Ratio analysis helps the
investors and managers to analyze the various ratios and sustainability of the operations.
Ratios are used to simplify financial statement ratios. Without understanding the whole financial
statement ratio analysis helps the investor to obtain the information of a few data from the ratios.
Detection of problematic trend the analysis can also forecast the future performance of a
company. The profile of the company's business based on the geographical location where the
company operates, the category of product and services it provides, target customers, etc. Next is
financial profile included the size of the company, the upper limit to lower limit, etc. the
comparison in between companies through the implication of the ratios and that ratios can be PE
ratio, PB ratio. The
Introduction
Financial statements are essential for the internal and external investors of the company ever all the
stakeholders have their different tastes like equity shareholders are interested in the growth of the
dividend payment.
Profitability
Profitable return on assets ratio and return on equity ratio help to the shareholders or the stakeholders to
understand how many firms can generate the earnings. Return on assets means the total net income
divided by total assets. the margin rate help to analyze the firm's ability to translate sales to profit.
Operational efficiency
Some ratios help to analyze the efficiency. ratios

4
Course Topics
Vertical analysis:
Vertical analysis is known as a common size statement analysis compares to e.
Horizontal analysis
This analysis compares the income statement and balance sheet, both financial statements
determine the changes, the absolute change along with percentage changes.
Vertical analysis
This is a technique used to identify the resources where to apply the resources. The distribution
of resources in varied proportion has applied the determines this determine the
Vertical analysis- income statement
To measure the relative performance of the income statement.
Vertical analysis – balance sheet
These analyses manage the balance sheet and consider various items in the total assets and total
liabilities percentages. This
Horizontal analysis
This technique is used to access the trends relative proportion to a base year.
Trend analysis
Secure Best Marks with AI Grader
Need help grading? Try our AI Grader for instant feedback on your assignments.

5
Course Topics
Types of financial statement ratios
Solvency ratios:
Solvency ratios show companies feasibility on a long term basis. The comparison of debt
measures its earning, equity and assets. This analysis classified into two subcategories:
1) Liquidity ratio and
2) Turnover ratio
Examples of solvency ratios are:
According to its name debt –to- equity ratio shows its relationship with debt taken by the
company to equity. The proportion of fundraising from banks and creditors compared to the fund
from the investors. Debt -equity = Debts
Equity shareholders fund
This ratio depicts that lower the ratio of debt-equity, higher the company's position. The fund
taken from the company's shareholders and investors is always better than the fund from banks
and creditors.
Liquidity ratios:
Liquidity ratios indicate the cash available to business and its ability to meet current dues.
Liquidity ratios are an indicator of a company's capacity to clear its current liabilities (liabilities
need to be cleared in the year)
Liquidity ratio examples are discussed below

6
Course Topics
Quick ratio = Quick assets
Quick liabilities
Quick assets= cash and cash equivalent + account receivable.
Cash= $ 200
Account receivable= $ 400
Current liabilities= $1000
Quick ratio = 200+400
1200
= 0.5
This ratio is also known as an acid ratio. A large amount of stock and prepaid expenses
Current ratio = Current Assets
Current liabilities
The current ratio is usually used to analyze the liquidity of a firm. It is a very quick and easy
analysis in measurement to understand the relationship between current assets and current
liabilities.
The current ratio provides the estimate for the survival of the company whether it would survive
for one year or not. When the current assets are more than the current liabilities, the company
can easily convert the current assets into cash to pay off the current debts of the company.
Current ratios not only provide the grades of the company but also the marketability.

7
Course Topics
Formula: The addition of all the current assets and current liabilities shown in the balance sheet
comes to a quick ratio.
Cash ratio
Cash ratio = cash∧cash equivalent
current liabilities
This ratio determines the value of cash and cash equivalents. A higher cash ratio depicts a
company's ability to pay short term liabilities.
Cash and cash equivalent= $600
Current liabilities= $1200
Quick ratio= $ 600
$ 1200 = 0.5
Turnover analysis
Turnover analysis analyzes the company’s liquidity. How much time a particular
Commonly turnover ratios are as follows:
Receivable turnover ratio- accounts receivables calculated annually or quarterly. For quarterly,
Sales = 2000, credit percentage= 90%,
Account receivable= 400, credit sales= 90% of 2000 =1800
Account receivable T/O= 1800
400 =4.5
Inventory turnover ratios
Paraphrase This Document
Need a fresh take? Get an instant paraphrase of this document with our AI Paraphraser

8
Course Topics
This turnover ratio shows the inventories restored over one year. The calculation of this ratio
involves the cost of goods sold and inventory.
Inventory turnover ratio= cost of goods so ld
inventory
Cost of goods sold= 600/- , inventory = 300/-
Inventory turnover ratio= 600
300 = 2 times
Asset turnover ratio
This ratio compares sales to assets. Asset turnover indicates the assets are being used for the
generation of sales.
Asset T/O ratio= Total sales
Assets
Sales = 1000/- , Total assets= 1, 00,000
Asset turnover= 1000
100000 =0.01
Fixed asset turnover ratio
Fixed asset turnover = Total assets
Net ¿ assets ¿
Sales = 800
Fixed assets= 1000
Fixed asset turnover¿ 800
1000 =0.8

9
Course Topics
Equity turnover
This ratio evaluates the generated revenue to shareholder's equity, Measures Company's
efficiency in deploying shareholders equity to generate revenues.
Equity turnover ratio= S ales
Shareholders equity
Sales= 1200/-
Shareholders equity= 400/-
Equity turnover= 1200
400 = 3
Efficiency ratios:
Efficiency ratio indicates the efficiency level of financial ratios. It shows the company uses
assets to derive profits or conversion of stock into cash. This ratio specifies the standard use
where the company collects the cash from the clients for credit goods and services. The main aim
of this ratio is to measure day to day performance of the company in its operation from trading
concern to the selling department to make profits.

10
Course Topics
Profitability ratios:
The profitability ratio shows the company's effective demonstration by using the assets to make a
profit. Operating profitability ratio measures the relative costs to sales and profit generated from
the business. The example of this ratio is:
Gross profit ratio
The difference between sales and cost provides gross profit. The significance of This ratio is of
basic profitability. It includes gross profit as per trading account and sales that of the net of
returns.
Gross profit ratio = Gross profit
sales
Operating profit ratio
This ratio determines the value of the numerator as sales – the cost of sales or net profit as per
profit and loss account = non-operating expenses (loss on the sake of asset, preliminary expenses
written off, etc.) – Non- operating incomes (rents, interest, and dividends)
Operating profit ratio= Operating profit
sales
Net profit ratio
The net profit ratio indicates overall profitability. Net profit shows as per profit and loss account
and sales that of a net of returns.
Net profit ratio= Net profit
sales
Secure Best Marks with AI Grader
Need help grading? Try our AI Grader for instant feedback on your assignments.

11
Course Topics
Contribution sales ratio
The contribution sales ratio or profit volume ratio is an indicator of profitability in marginal
costing. Contribution shows as sales less variable cost and sales that of the net of returns.
Contribution sales ratio or profit volume ratio= Contribution
Sales
Return on investment
Return on investment or return on capital employed signifies the overall profitability of the
business on the total funds employed. If the Return of capital employed > interest rate, the use of
debt funds is justified. Numerator and denominator represent earning after tax+ interest on debt
funds+ non-operating adjustments e.g. other income/loss on the sale of fixed assets etc. and
capital employed can be computed using –(a) asset route (b) liability route. Assets route implies
fixed assets+ net working capital. The liability route implies equity share capital+ preference
share capital + reserves and surplus+ long term debt – accumulated losses – on trade
investments.
Return on investment- Total earning
capital employed
Return on equity

12
Course Topics
Return on equity or return on the net worth that indicates the profitability of equity funds/owners
funds invested in the business. The numerator represents earning after taxation and denominator
represents net fixed assets + networking capital – external liabilities (long term)
Return on equity (ROE) = Equity earnings
shareholders fund
Return on assets
Return on asset indicates net income per rupee of average fixed assets. The numerator represents
earning after taxation and the denominator represents the average total assets or tangible assets or
fixed assets, i.e. ½ of opening and closing balance.
Return on asset= Net profit after tax
Average total assets ×100
1. Return on equity (ROE) is
Equity earnings
shareholders fund
Equity earnings
shareholders fund
Equity ea rnings
shareholders fund
None of the above
2. Net profit ratio is
Net profit
sales
Sales
Net profit
Gross profit
sales

13
Course Topics
All of the above
3. Gross profit ratio is an indicator
Basic
Primary
Secondary
All of the above
4. Contribution sales ratio indicate the profitability of
Job costing
Contract costing
Marginal costing
Any of these
Valuation ratios:
Valuation ratios are for the company's investors, it helps them to measure whether the share to be
purchase, hold or sell. Using these ratio investors can also be able to forecast the future of the
shares and stock and the expected returns from the stock.
The example of valuation ratio:
Paraphrase This Document
Need a fresh take? Get an instant paraphrase of this document with our AI Paraphraser

14
Course Topics
Price earning ratio
For the earning from the price paid for the shares price earning ratio should be used. It indicates
the appraisal investment in the stock market and the valuation of share-based on the value of
earning from the share.
Price earning ratio= Market value per equity share
earnings pe r share
The PE ratio shows the expected share price based on the earning of share. Generally, these
ratios are calculated at the time of the financial year-end.
Earning per share
Earning per share signifies return or income per share, whether or not distributed as dividends.
The numerator represents the residual earnings i.e. EAT (-) Preference dividend and denominator
as the number of equity share outstanding= equity capital face value per share.
Earnings per share = EAT− preference dividend
Number of equity share
Dividend per share
The dividend per share signifies the number of profits distributed per share. The numerator
represents the profit distributed to equity shareholders and denominator like the number of equity
share outstanding= equity capital face value per share.
Dividend per share= Total equity dividend
Number of equity shares
Dividend Yield (%)

15
Course Topics
This ratio signifies the true return on investment based on the market value of shares.
Conclusion
Ratio analysis for financial statements includes all the ratios discussed above those studies from
various dimensions. An individual ratio does not provide the whole information of the company.
These ratios are interlinked and connected for the evaluation of a company's performance.
Quiz
1) Category wise classification of financial ratios
Liquidity, solvency, efficiency, profitability, valuation
Solvency, liquidity, efficiency, valuation, profitability
Efficiency, valuation, profitability, liquidity, solvency
Any of the above
2) The quick ratio is also known as-

16
Course Topics
Acid test ratio
Working capital ratio
Current ratio
All of the above
3) The working capital ratio is also known as
Quick ratio
Current ratio
Working capital ratio
Acid test ratio
4) Quick ratio formula -
Current Assets
Current liabilities
Quick assets
Quick liabilities
Both (A) and (B)
None of the above
5) Debt -equity ratio implies
Debts
Equity shareholders fund
Current Assets
Current liabilities
All of the above
None of the above
Limitations of financial ratios are as follows:
The primary data on which ratios are based must be reliable and non-manipulated.
Secure Best Marks with AI Grader
Need help grading? Try our AI Grader for instant feedback on your assignments.

17
Course Topics
The difference in accounting policies, interpretation of financial terms and accounting
periods make accounting data two firms non-comparable as also the accounting ratios.
Adjustments are needed to sort out such differences.
There is no standard set of ratios.
Seasonal factor may influence financial data.
Window dressing can change the character of financial ratios.
In the case of diversified product lines, aggregate data cannot be used for inter-firm
comparison.
Financial data are badly distorted by inflation.
Financial ratios are interrelated or not independent.
Timely ratio analysis provides clues but not conclusions. These are tools in the hands of
experts for their interpretations.
Final quiz:
1) Limitation of financial ratios include following are:
Seasonal factor may influence financial data.
Window dressing can change the character of financial ratios.
In the case of diversified product lines, aggregate data cannot be used for inter-firm
comparison.
Financial data are badly distorted by inflation.
All of the above
2) Current ratio formula -
Current Assets
Current liabilities
Quick assets
Quick liabilities

18
Course Topics
Both (A) and (B)
None of the above
3) Return on asset=
Net profit before tax
total assets ×100
Net profit
total assets ×100
Both (A) and (B)
None of the above
4) Price earning ratio=
Market value per equity share
earnings per share
Earning per share
Market value per equity share ×100
Longterm assets
¿ assets × 100
None of the above
5) Inventory turnover ratio
C ost of goods sold
I nventory
C ost of goods sold
Average inventory
Sales
Average inventory
None of the above
6) Objectives of the analysis financial statements analysis can be:

19
Course Topics
Long term and short term
Medium-term
Short term
Long term
7) Capital turnover ratio is equal to
Capital employed
Ne t sales
Net sales
capital employed
Net sales
total assets
None of these
8) Total asset turnover ratio is equal to
total asse
ssment sales
Net sales
total assets
C urrent sales
total assets
None of the above
9) Earnings per share numerator represent
EAT (-) Preference dividend
EAT (-) Equity dividend
Both (A) and (B)
None of the above
Paraphrase This Document
Need a fresh take? Get an instant paraphrase of this document with our AI Paraphraser

20
Course Topics
Reference
Liang, D., Lu, C. C., Tsai, C. F., & Shih, G. A. (2016). Financial ratios and corporate governance
indicators in bankruptcy prediction: A comprehensive study. European Journal of Operational
Research, 252(2), 561-572.
Lecy, J. D., & Searing, E. A. (2015). Anatomy of the nonprofit starvation cycle: An analysis of
falling overhead ratios in the nonprofit sector. Nonprofit and Voluntary Sector Quarterly, 44(3),
539-563.
Flower, J., & Ebbers, G. (2018). Global financial reporting. Macmillan International Higher
Education.
Das, S. (2017). MEASURING THE PERFORMANCE THROUGH CASH FLOW RATIOS-A
STUDY ON CMC. Journal of Commerce & Accounting Research, 6(4).

21
Course Topics
Lewellen, J. (2004). Predicting returns with financial ratios. Journal of Financial
Economics, 74(2), 209-235.
Penman, S. H. (2015). Financial Ratios and Equity Valuation. Wiley Encyclopedia of
Management, 1-7.
Course Topics
Lewellen, J. (2004). Predicting returns with financial ratios. Journal of Financial
Economics, 74(2), 209-235.
Penman, S. H. (2015). Financial Ratios and Equity Valuation. Wiley Encyclopedia of
Management, 1-7.
1 out of 21
Related Documents

Your All-in-One AI-Powered Toolkit for Academic Success.
+13062052269
info@desklib.com
Available 24*7 on WhatsApp / Email
Unlock your academic potential
© 2024 | Zucol Services PVT LTD | All rights reserved.