Accounting Principles: Cash Flow, Ratio Analysis, Homework

Verified

Added on  2023/01/13

|8
|1314
|64
Homework Assignment
AI Summary
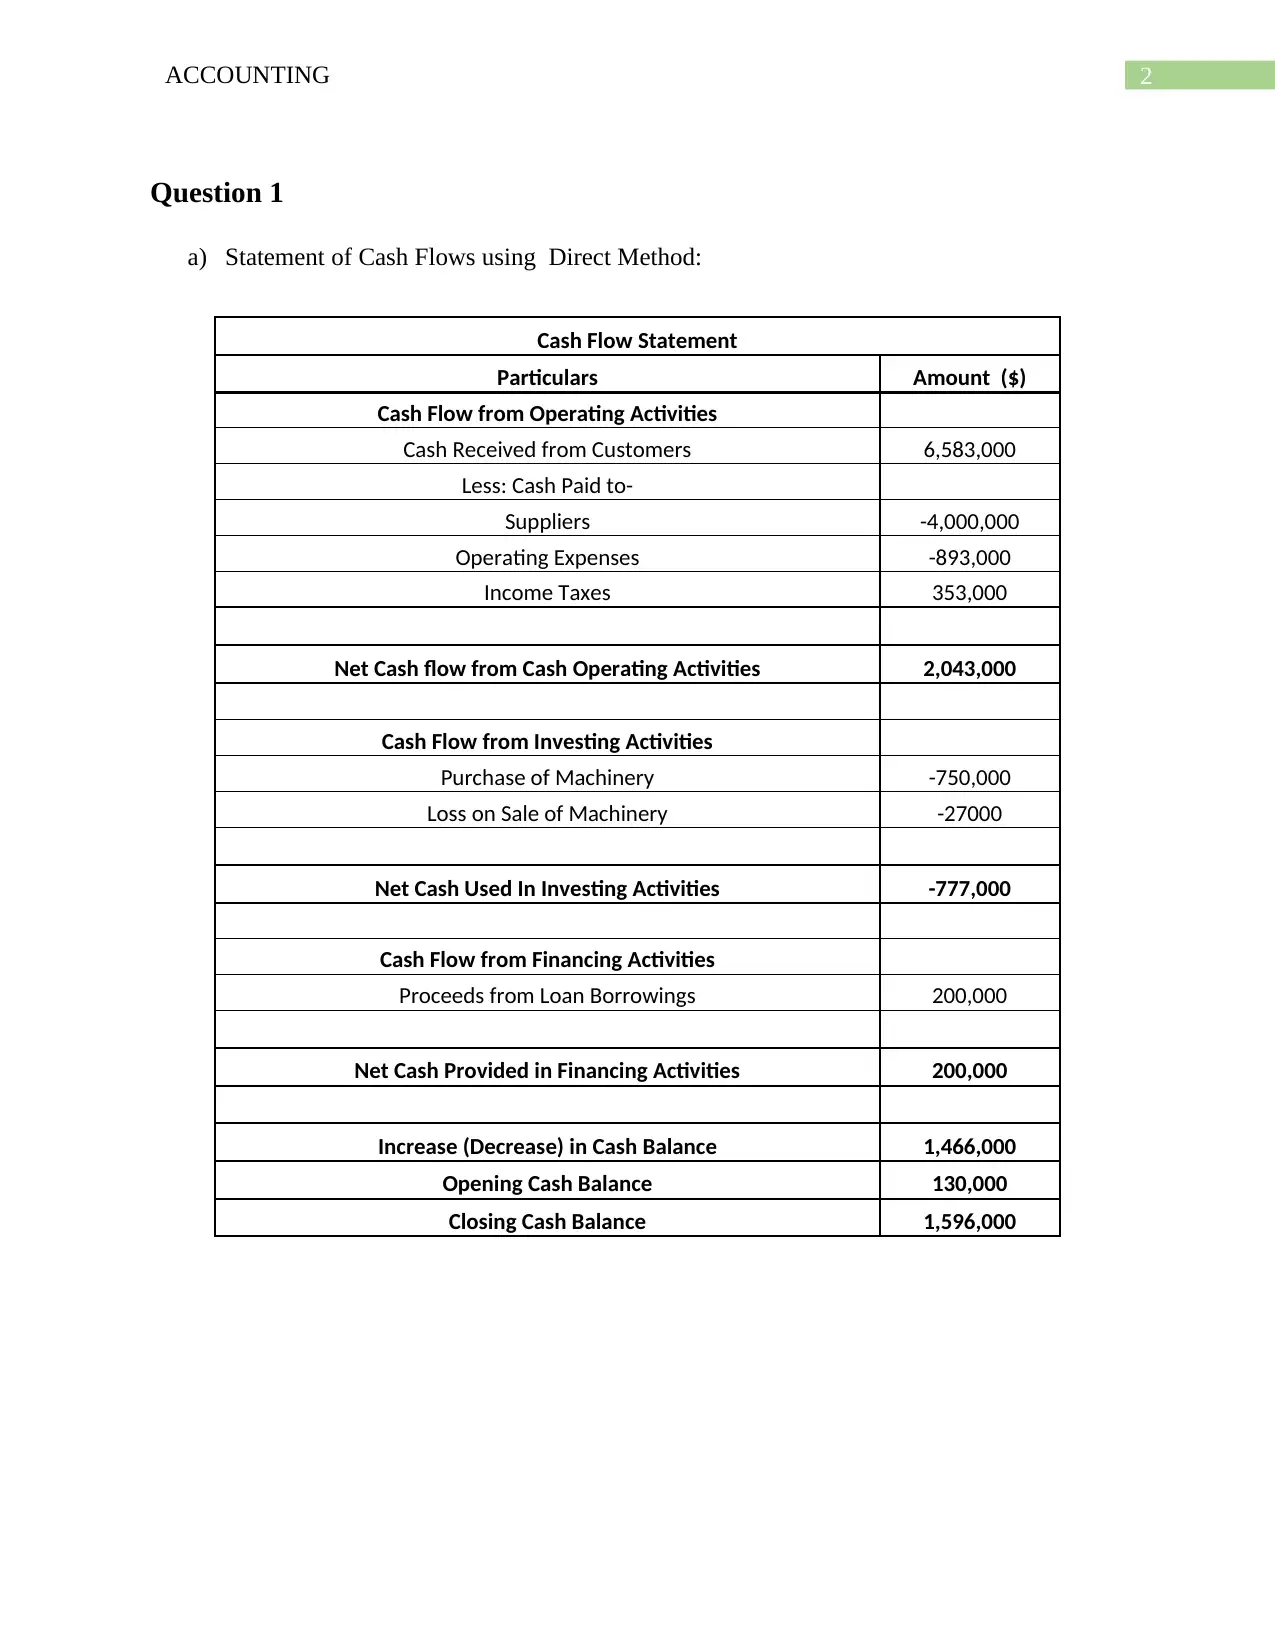
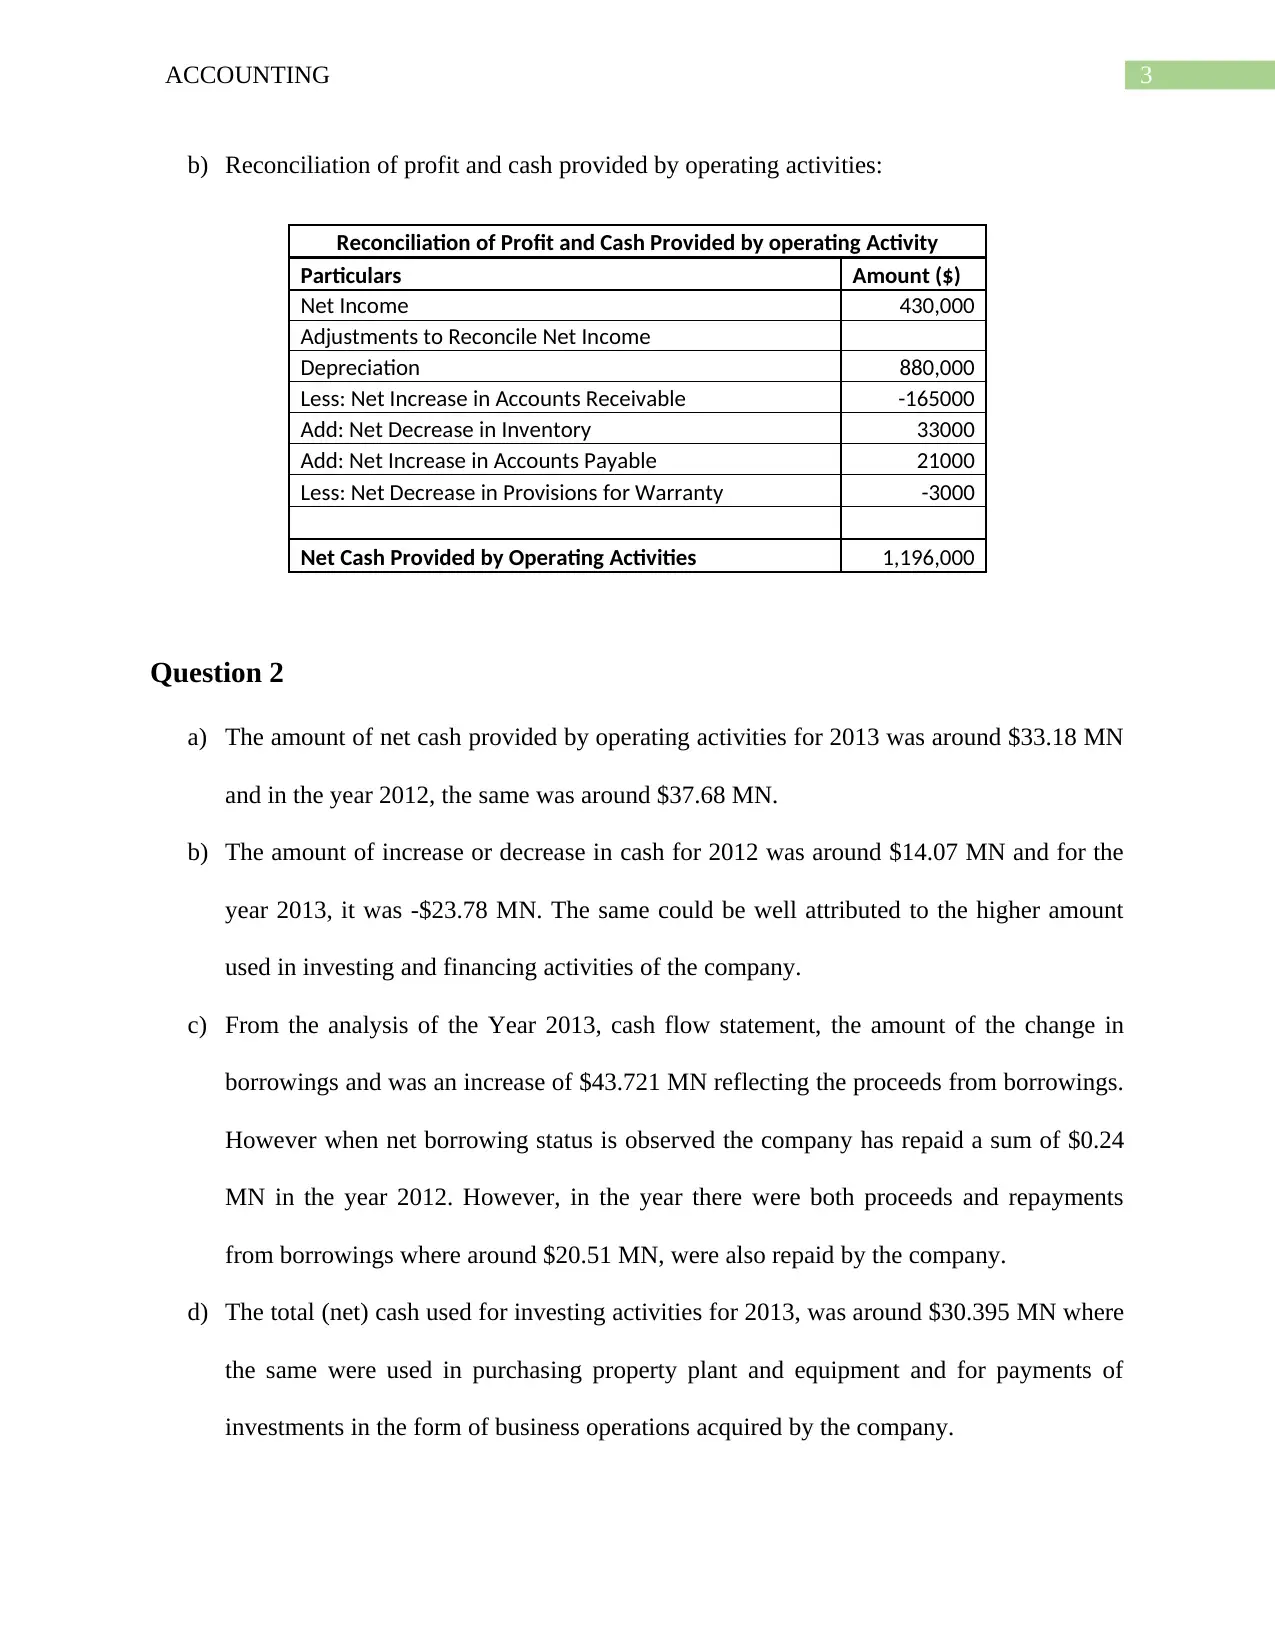
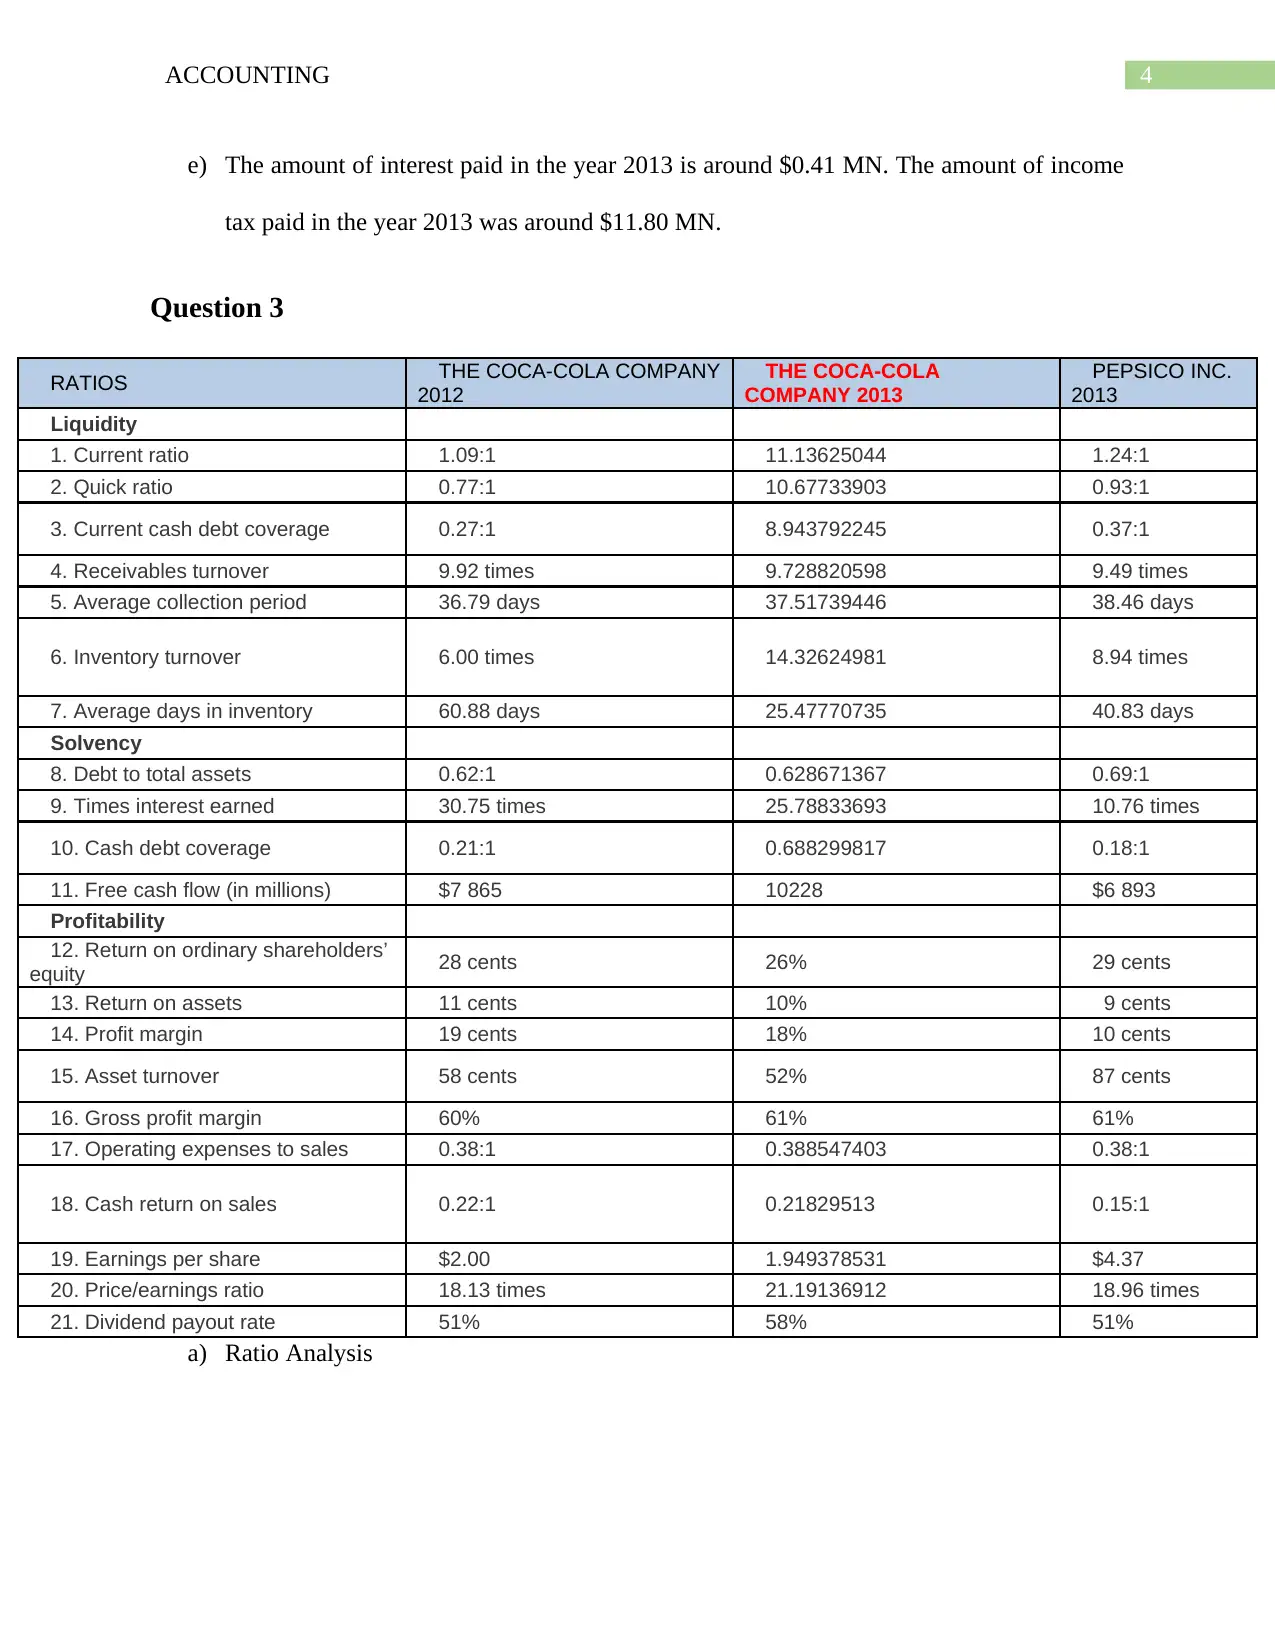
This accounting assignment solution addresses key concepts in financial accounting. Question 1 involves the preparation of a cash flow statement using the direct method and a reconciliation of profit with cash provided by operating activities for Spears Manufacturing Ltd. Question 2 analyzes the cash flow statements of Domino’s Pizza Enterprises Ltd. Question 3 focuses on ratio analysis, comparing the financial performance of The Coca-Cola Company and PepsiCo Inc., evaluating their liquidity, solvency, and profitability based on provided financial data. The analysis includes calculations of various financial ratios and interpretations of company performance, including discussions on trends and implications of financial metrics.
Document Page
Running head: PRINCIPLES OF ACCOUNTING
Accounting
Name of the Student:
Name of the University:
Author’s Note:
tabler-icon-diamond-filled.svg

Paraphrase This Document

Need a fresh take? Get an instant paraphrase of this document with our AI Paraphraser
Document Page
1ACCOUNTING
Table of Contents
Question 1........................................................................................................................................2
Question 2........................................................................................................................................3
Question 3........................................................................................................................................4
References........................................................................................................................................7
Document Page
2ACCOUNTING
Question 1
a) Statement of Cash Flows using Direct Method:
Cash Flow Statement
Particulars Amount ($)
Cash Flow from Operating Activities
Cash Received from Customers 6,583,000
Less: Cash Paid to-
Suppliers -4,000,000
Operating Expenses -893,000
Income Taxes 353,000
Net Cash flow from Cash Operating Activities 2,043,000
Cash Flow from Investing Activities
Purchase of Machinery -750,000
Loss on Sale of Machinery -27000
Net Cash Used In Investing Activities -777,000
Cash Flow from Financing Activities
Proceeds from Loan Borrowings 200,000
Net Cash Provided in Financing Activities 200,000
Increase (Decrease) in Cash Balance 1,466,000
Opening Cash Balance 130,000
Closing Cash Balance 1,596,000
Document Page
3ACCOUNTING
b) Reconciliation of profit and cash provided by operating activities:
Reconciliation of Profit and Cash Provided by operating Activity
Particulars Amount ($)
Net Income 430,000
Adjustments to Reconcile Net Income
Depreciation 880,000
Less: Net Increase in Accounts Receivable -165000
Add: Net Decrease in Inventory 33000
Add: Net Increase in Accounts Payable 21000
Less: Net Decrease in Provisions for Warranty -3000
Net Cash Provided by Operating Activities 1,196,000
Question 2
a) The amount of net cash provided by operating activities for 2013 was around $33.18 MN
and in the year 2012, the same was around $37.68 MN.
b) The amount of increase or decrease in cash for 2012 was around $14.07 MN and for the
year 2013, it was -$23.78 MN. The same could be well attributed to the higher amount
used in investing and financing activities of the company.
c) From the analysis of the Year 2013, cash flow statement, the amount of the change in
borrowings and was an increase of $43.721 MN reflecting the proceeds from borrowings.
However when net borrowing status is observed the company has repaid a sum of $0.24
MN in the year 2012. However, in the year there were both proceeds and repayments
from borrowings where around $20.51 MN, were also repaid by the company.
d) The total (net) cash used for investing activities for 2013, was around $30.395 MN where
the same were used in purchasing property plant and equipment and for payments of
investments in the form of business operations acquired by the company.
tabler-icon-diamond-filled.svg

Paraphrase This Document

Need a fresh take? Get an instant paraphrase of this document with our AI Paraphraser
Document Page
4ACCOUNTING
e) The amount of interest paid in the year 2013 is around $0.41 MN. The amount of income
tax paid in the year 2013 was around $11.80 MN.
Question 3
RATIOS THE COCA-COLA COMPANY
2012
THE COCA-COLA
COMPANY 2013
PEPSICO INC.
2013
Liquidity
1. Current ratio 1.09:1 11.13625044 1.24:1
2. Quick ratio 0.77:1 10.67733903 0.93:1
3. Current cash debt coverage 0.27:1 8.943792245 0.37:1
4. Receivables turnover 9.92 times 9.728820598 9.49 times
5. Average collection period 36.79 days 37.51739446 38.46 days
6. Inventory turnover 6.00 times 14.32624981 8.94 times
7. Average days in inventory 60.88 days 25.47770735 40.83 days
Solvency
8. Debt to total assets 0.62:1 0.628671367 0.69:1
9. Times interest earned 30.75 times 25.78833693 10.76 times
10. Cash debt coverage 0.21:1 0.688299817 0.18:1
11. Free cash flow (in millions) $7 865 10228 $6 893
Profitability
12. Return on ordinary shareholders’
equity 28 cents 26% 29 cents
13. Return on assets 11 cents 10% 9 cents
14. Profit margin 19 cents 18% 10 cents
15. Asset turnover 58 cents 52% 87 cents
16. Gross profit margin 60% 61% 61%
17. Operating expenses to sales 0.38:1 0.388547403 0.38:1
18. Cash return on sales 0.22:1 0.21829513 0.15:1
19. Earnings per share $2.00 1.949378531 $4.37
20. Price/earnings ratio 18.13 times 21.19136912 18.96 times
21. Dividend payout rate 51% 58% 51%
a) Ratio Analysis
Document Page
5ACCOUNTING
b) Coca-Cola Company Year wise financial analysis could be well based on the liquidity,
profitability and the solvency position of the company. The liquidity position for the
company has increased consistently for the company where it was found that from the
year 2012-2013 the current liabilities for the company has fallen significantly for the
company and the same could be well indicated to the reduction in short term liabilities
and accounts payables of the company. The company has maintained enough amount of
current assets coverage with respect to the current liability of the company. On the other
hand the solvency position of the company on the contrary side has somewhat degraded
for the company and the same could be well attributed to the increase in the long-term
borrowings of the company (Uechi et al. 2015). The increase in the long-term debt of the
company also worsened the times interest earned ratio which felt from 30.75 times to
25.78 times, it shows that there is consistent pressure on the EBIT of the company with
the higher amount of debt or financial risk in the company. Profitability of the company
is well linked to the amount of sales and to the amount of expenses done by the company
for earning profitability of the same. While analyzing the profitability of the company
from the financial statement of the company it can be well seen that the revenue for the
company has fallen significantly for the company. From the year 2012-2013 and on the
other hand side the costs associated with the same also increased this lead to a decrease in
various aspects of the profitability of the company (Zainudin and Hashim 2016).
c) The financial analysis of the PepsiCo and Coca-Cola Company can be well done with the
help of the ratio analysis where financial analysis could be well based on the liquidity,
profitability and the solvency position of the companies. In terms of liquidity the Coca-
Cola company has a wider coverage of current assets and the same could be well said
Document Page
6ACCOUNTING
because of the lower amount of current liability the company has in its financial
statements. The activity ratio’s including the average collection period, receivables
turnover and the inventory turnover ratio for the companies were much efficient for the
Coca-Cola Company. The same indicates that the Coca-Cola Company is applying better
techniques for handling the operations of the company. The debt to total asset reflecting
the solvency position was also comparatively less for Coca-Cola Company then Pepsi-Co
Inc reflecting lower amount of financial risk associated with the company. However
when comparing the key financial ratio that is the profitability it shows that the return on
shareholder’s equity for the Pepsi-Co Inc. was much higher than Coca-Cola Company
reflecting better profitability return generated by the company (Robinson et al. 2015).
tabler-icon-diamond-filled.svg

Paraphrase This Document

Need a fresh take? Get an instant paraphrase of this document with our AI Paraphraser
Document Page
7ACCOUNTING
References
Robinson, T.R., Henry, E., Pirie, W.L. and Broihahn, M.A., 2015. International financial
statement analysis. John Wiley & Sons.
Uechi, L., Akutsu, T., Stanley, H.E., Marcus, A.J. and Kenett, D.Y., 2015. Sector dominance
ratio analysis of financial markets. Physica A: Statistical Mechanics and its Applications, 421,
pp.488-509.
Zainudin, E.F. and Hashim, H.A., 2016. Detecting fraudulent financial reporting using financial
ratio. Journal of Financial Reporting and Accounting, 14(2), pp.266-278.
chevron_up_icon
1 out of 8
circle_padding
hide_on_mobile
zoom_out_icon
[object Object]