Detailed Financial Ratio Analysis Report on IBM (2013-2017)
VerifiedAdded on 2023/06/03
|14
|2718
|373
Report
AI Summary
This report provides a comprehensive financial analysis of IBM Corporation from 2013 to 2017 using various financial ratios. It assesses the company's strategy, liquidity, efficiency, leverage, and profitability. The analysis reveals a deterioration in IBM's financial performance over the five-year period, with declining profitability and liquidity positions. While the company demonstrates sound efficiency ratios, it lags behind industry averages and competitors in several key areas. The report concludes with recommendations for IBM to improve its liquidity and leverage positions by strategically investing in potential growth areas and utilizing existing assets more judiciously. The analysis assumes that by addressing its weaknesses and capitalizing on its strengths, IBM can regain its competitive edge and improve its overall financial health. The report references multiple sources to support its findings and recommendations.
Running Head: IBM ANALYSIS 0
IBM Analysis
IBM Analysis
Paraphrase This Document
Need a fresh take? Get an instant paraphrase of this document with our AI Paraphraser
IBM ANALYSIS 1
Table of Contents
Overview....................................................................................................................................2
Strategy......................................................................................................................................2
Financial Ratio Analysis............................................................................................................2
Liquidity Ratios......................................................................................................................3
Efficiency and Management Ratios........................................................................................4
Leverage Ratios......................................................................................................................5
Profitability Ratios..................................................................................................................6
Conclusion..................................................................................................................................8
Recommendation and Assumption............................................................................................9
References................................................................................................................................10
Appendix 1...............................................................................................................................12
IBM ANALYSIS 2
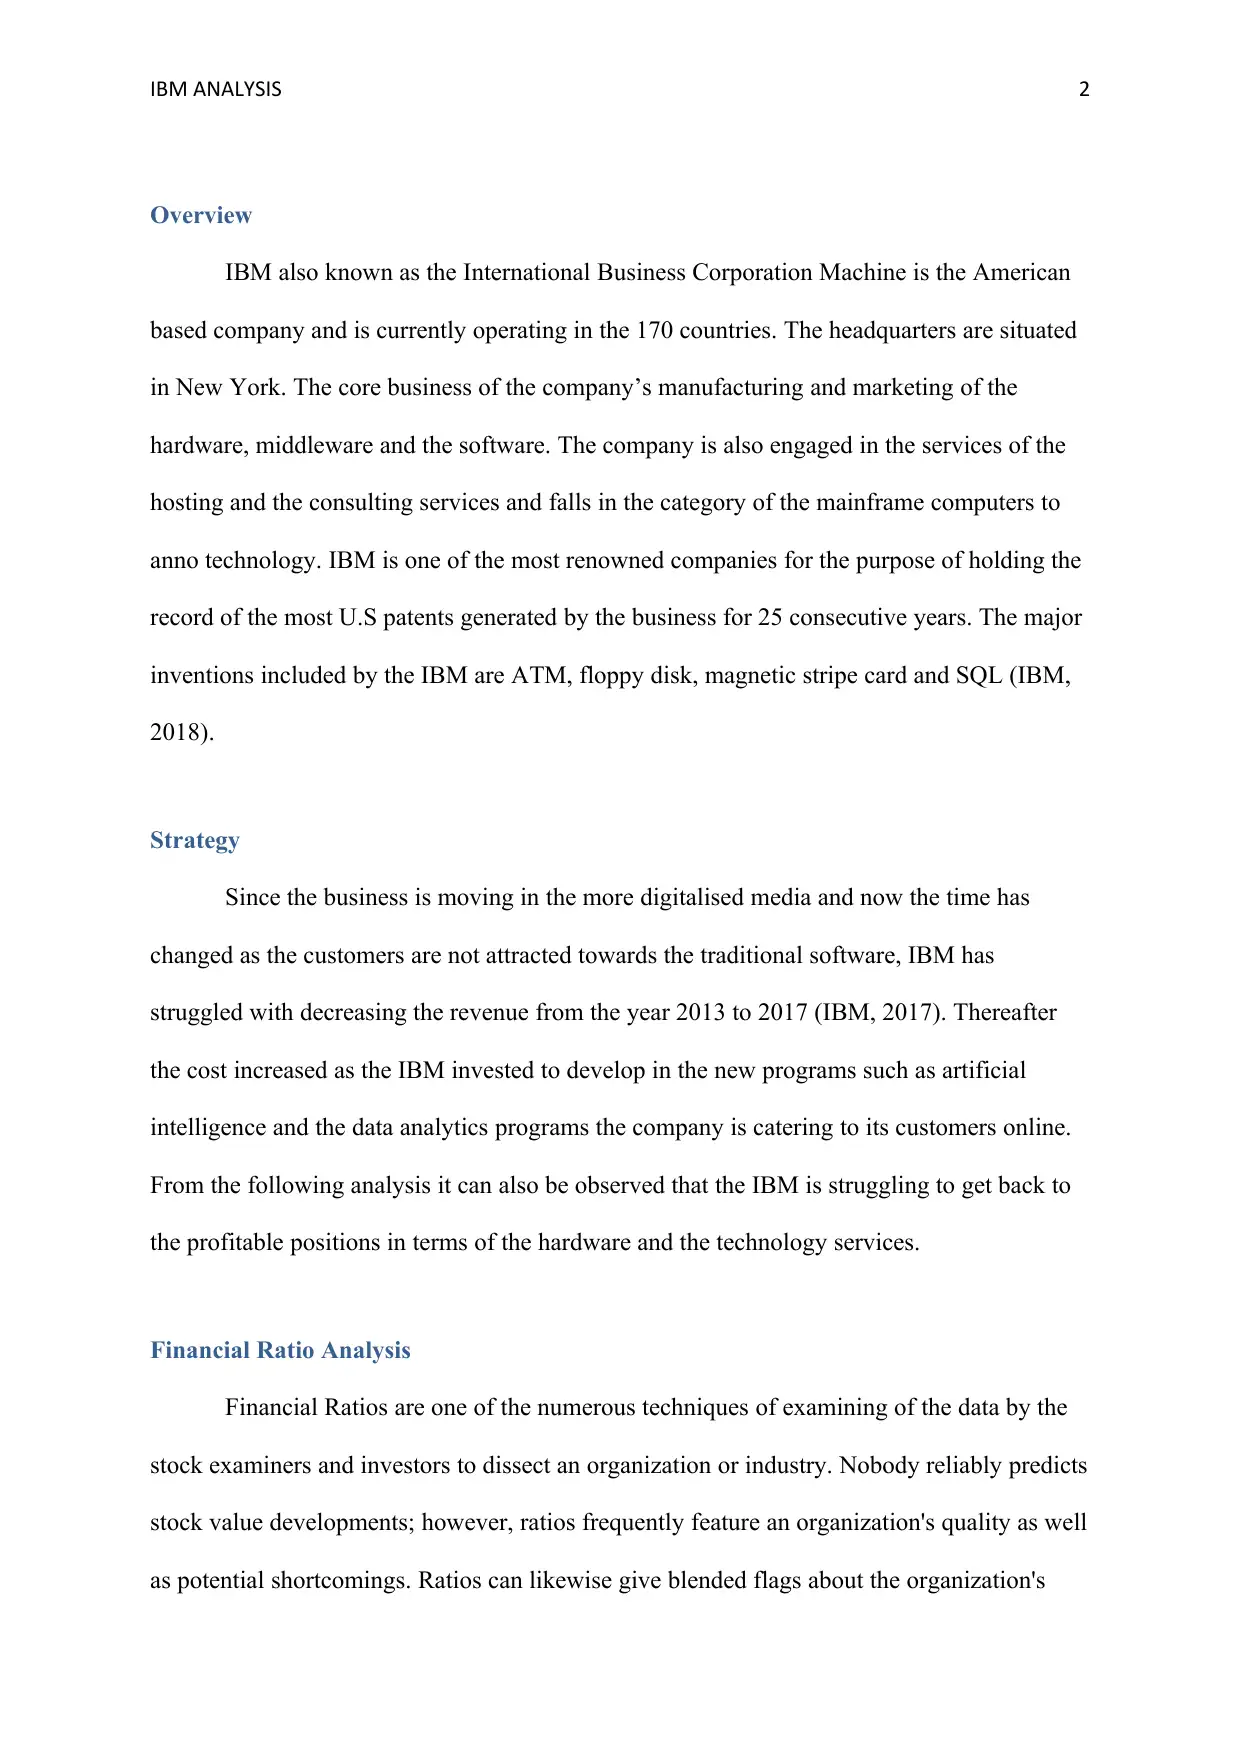
Overview
IBM also known as the International Business Corporation Machine is the American
based company and is currently operating in the 170 countries. The headquarters are situated
in New York. The core business of the company’s manufacturing and marketing of the
hardware, middleware and the software. The company is also engaged in the services of the
hosting and the consulting services and falls in the category of the mainframe computers to
anno technology. IBM is one of the most renowned companies for the purpose of holding the
record of the most U.S patents generated by the business for 25 consecutive years. The major
inventions included by the IBM are ATM, floppy disk, magnetic stripe card and SQL (IBM,
2018).
Strategy
Since the business is moving in the more digitalised media and now the time has
changed as the customers are not attracted towards the traditional software, IBM has
struggled with decreasing the revenue from the year 2013 to 2017 (IBM, 2017). Thereafter
the cost increased as the IBM invested to develop in the new programs such as artificial
intelligence and the data analytics programs the company is catering to its customers online.
From the following analysis it can also be observed that the IBM is struggling to get back to
the profitable positions in terms of the hardware and the technology services.
Financial Ratio Analysis
Financial Ratios are one of the numerous techniques of examining of the data by the
stock examiners and investors to dissect an organization or industry. Nobody reliably predicts
stock value developments; however, ratios frequently feature an organization's quality as well
as potential shortcomings. Ratios can likewise give blended flags about the organization's
⊘ This is a preview!⊘
Do you want full access?
Subscribe today to unlock all pages.
Trusted by 1+ million students worldwide
IBM ANALYSIS 3
budgetary wellbeing and can vary differently among organizations, enterprises, and over the
period of the 5 years as it has been reported.
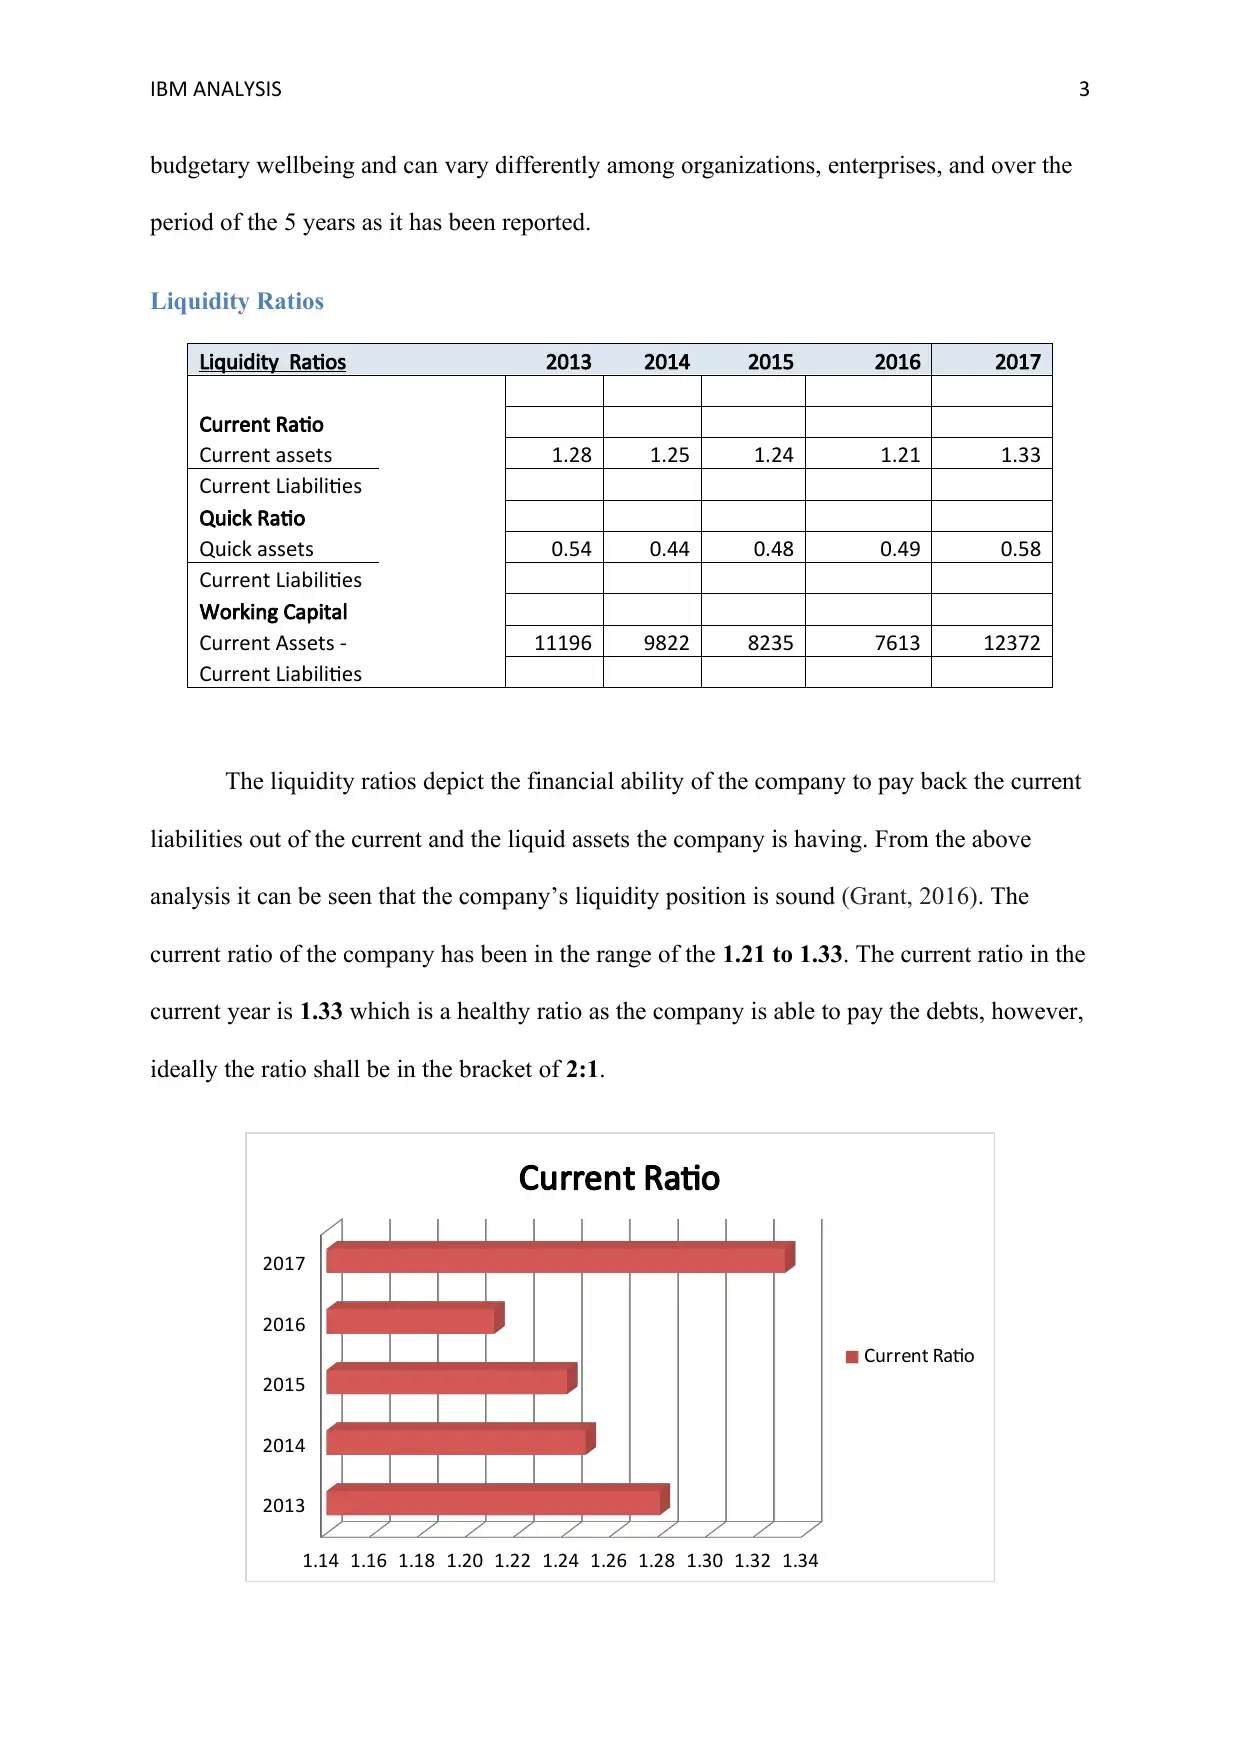
Liquidity Ratios
Liquidity Ratios 2013 2014 2015 2016 2017
Current Ratio
Current assets 1.28 1.25 1.24 1.21 1.33
Current Liabilities
Quick Ratio
Quick assets 0.54 0.44 0.48 0.49 0.58
Current Liabilities
Working Capital
Current Assets - 11196 9822 8235 7613 12372
Current Liabilities
The liquidity ratios depict the financial ability of the company to pay back the current
liabilities out of the current and the liquid assets the company is having. From the above
analysis it can be seen that the company’s liquidity position is sound (Grant, 2016). The
current ratio of the company has been in the range of the 1.21 to 1.33. The current ratio in the
current year is 1.33 which is a healthy ratio as the company is able to pay the debts, however,
ideally the ratio shall be in the bracket of 2:1.
2013
2014
2015
2016
2017
1.14 1.16 1.18 1.20 1.22 1.24 1.26 1.28 1.30 1.32 1.34
Current Ratio
Current Ratio
budgetary wellbeing and can vary differently among organizations, enterprises, and over the
period of the 5 years as it has been reported.
Liquidity Ratios
Liquidity Ratios 2013 2014 2015 2016 2017
Current Ratio
Current assets 1.28 1.25 1.24 1.21 1.33
Current Liabilities
Quick Ratio
Quick assets 0.54 0.44 0.48 0.49 0.58
Current Liabilities
Working Capital
Current Assets - 11196 9822 8235 7613 12372
Current Liabilities
The liquidity ratios depict the financial ability of the company to pay back the current
liabilities out of the current and the liquid assets the company is having. From the above
analysis it can be seen that the company’s liquidity position is sound (Grant, 2016). The
current ratio of the company has been in the range of the 1.21 to 1.33. The current ratio in the
current year is 1.33 which is a healthy ratio as the company is able to pay the debts, however,
ideally the ratio shall be in the bracket of 2:1.
2013
2014
2015
2016
2017
1.14 1.16 1.18 1.20 1.22 1.24 1.26 1.28 1.30 1.32 1.34
Current Ratio
Current Ratio
Paraphrase This Document
Need a fresh take? Get an instant paraphrase of this document with our AI Paraphraser
IBM ANALYSIS 4
(Source: By Author)
Also in comparison to the industry ratio the company’ s ratio is low and in
comparison to its competitors the IBM is better than the Accenture, HP but not sound than
the Oracle corporation, which was 1.13, 1.23 and 3.96 respectively. Also while assessing the
position of the company in terms of the liquidity the Quick ratio of the company indicates the
ability of the company to convert the assets into the liquid cash to pay off the debts and other
expenses. The quick ratio of the company has decreased from 0.54 to 0.44 in the year 2014
and then again increased from 0.48 to 0.58 which means that the company is able to pay but
still needs to improve the strategy. Moreover the working capital is positive in all the years
yet it fell down and increased again (Goldman, 2017). Therefore from the above results it can
be interpreted that the company needs to improve the ratio to reach at par in comparison to
the industry ratios.
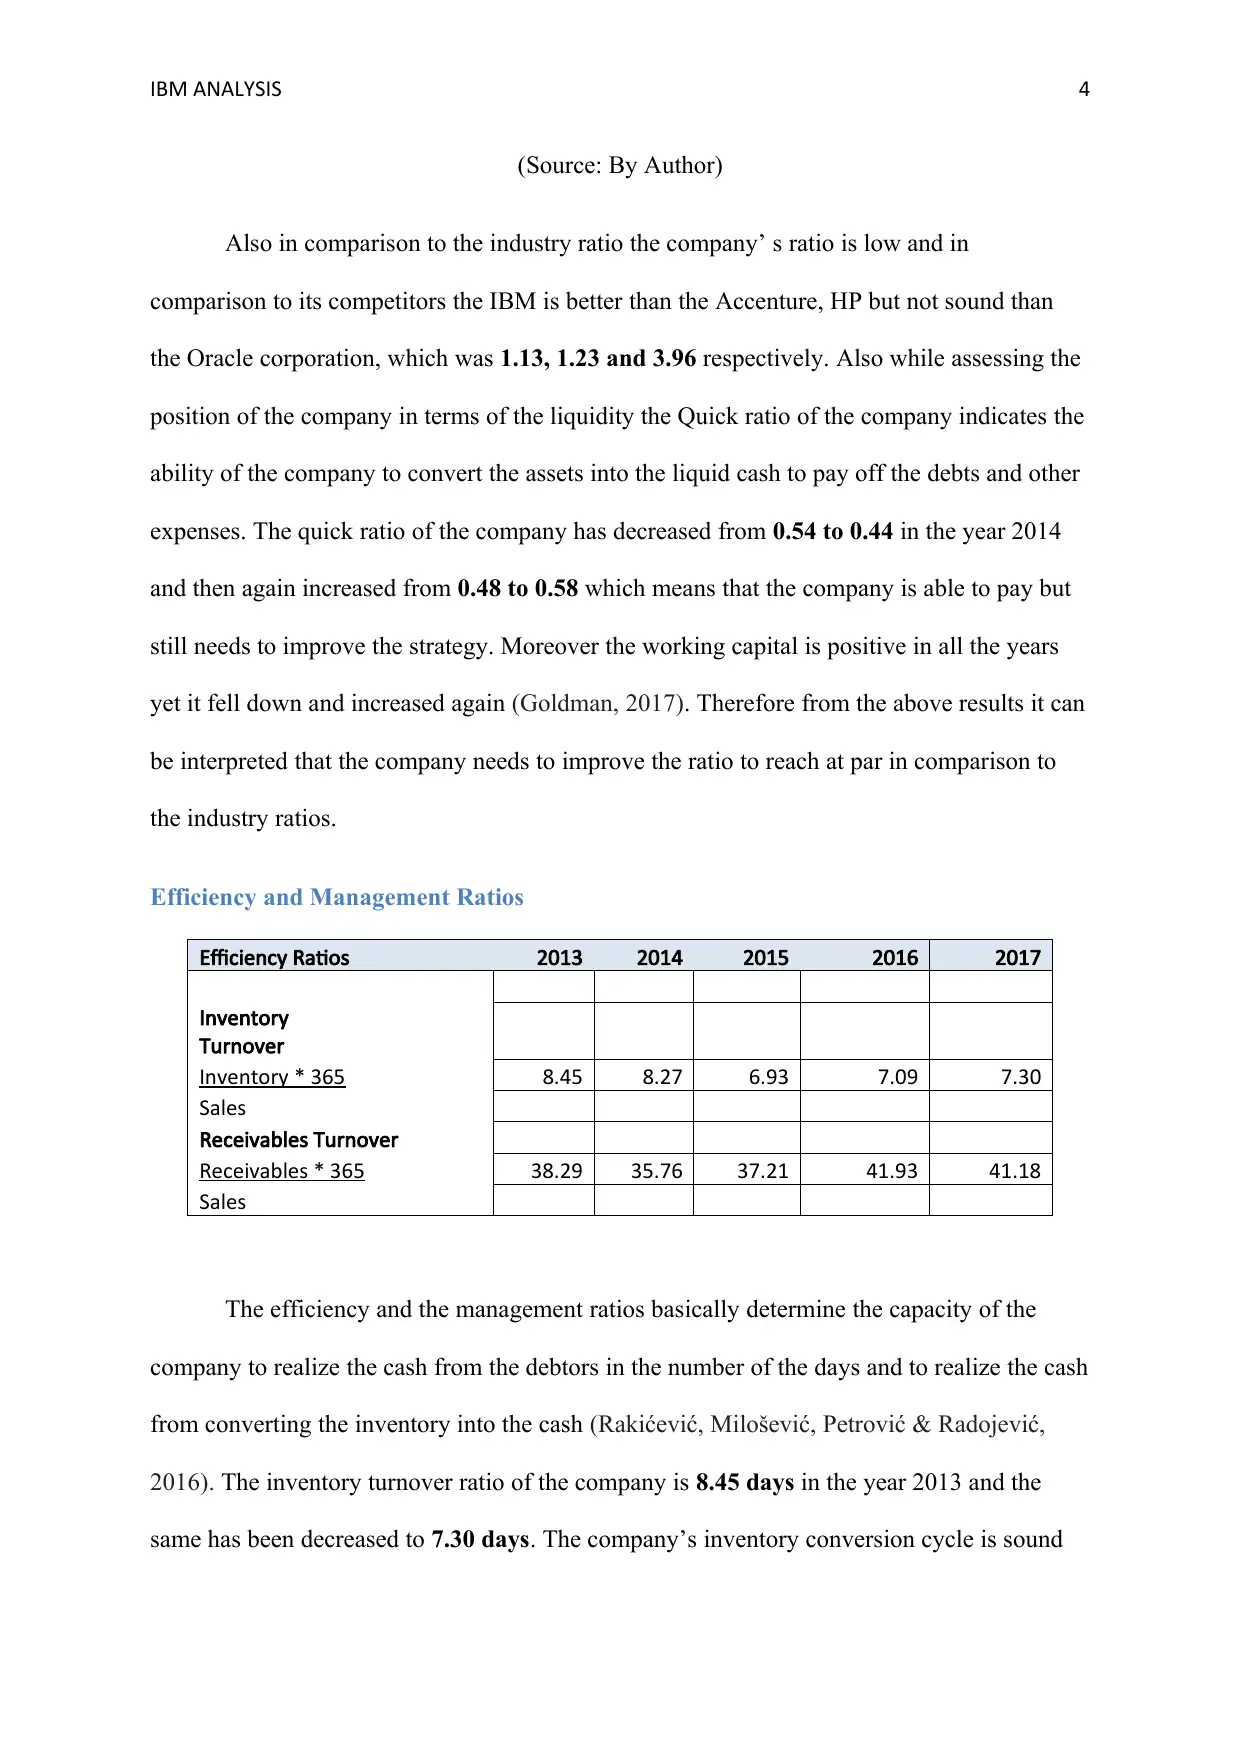
Efficiency and Management Ratios
Efficiency Ratios 2013 2014 2015 2016 2017
Inventory
Turnover
Inventory * 365 8.45 8.27 6.93 7.09 7.30
Sales
Receivables Turnover
Receivables * 365 38.29 35.76 37.21 41.93 41.18
Sales
The efficiency and the management ratios basically determine the capacity of the
company to realize the cash from the debtors in the number of the days and to realize the cash
from converting the inventory into the cash (Rakićević, Milošević, Petrović & Radojević,
2016). The inventory turnover ratio of the company is 8.45 days in the year 2013 and the
same has been decreased to 7.30 days. The company’s inventory conversion cycle is sound
(Source: By Author)
Also in comparison to the industry ratio the company’ s ratio is low and in
comparison to its competitors the IBM is better than the Accenture, HP but not sound than
the Oracle corporation, which was 1.13, 1.23 and 3.96 respectively. Also while assessing the
position of the company in terms of the liquidity the Quick ratio of the company indicates the
ability of the company to convert the assets into the liquid cash to pay off the debts and other
expenses. The quick ratio of the company has decreased from 0.54 to 0.44 in the year 2014
and then again increased from 0.48 to 0.58 which means that the company is able to pay but
still needs to improve the strategy. Moreover the working capital is positive in all the years
yet it fell down and increased again (Goldman, 2017). Therefore from the above results it can
be interpreted that the company needs to improve the ratio to reach at par in comparison to
the industry ratios.
Efficiency and Management Ratios
Efficiency Ratios 2013 2014 2015 2016 2017
Inventory
Turnover
Inventory * 365 8.45 8.27 6.93 7.09 7.30
Sales
Receivables Turnover
Receivables * 365 38.29 35.76 37.21 41.93 41.18
Sales
The efficiency and the management ratios basically determine the capacity of the
company to realize the cash from the debtors in the number of the days and to realize the cash
from converting the inventory into the cash (Rakićević, Milošević, Petrović & Radojević,
2016). The inventory turnover ratio of the company is 8.45 days in the year 2013 and the
same has been decreased to 7.30 days. The company’s inventory conversion cycle is sound
IBM ANALYSIS 5
and is able to get the cash back in hands in the fewer days as compared to the earlier years.
However, in terms of the industry the company is still performing better and also better than
its competitors like HP, Accenture and Oracle majorly whose stock conversion cycle is of
29.18 days (Moutinho, 2016). The Receivables ratio on the other hand is also better in terms
of the industry ratio but in comparison to its competitors the company needs to improve the
cycle of the receivables and also when compared to the previous years, the company’s ratio
has been increased due to the additional receivables.
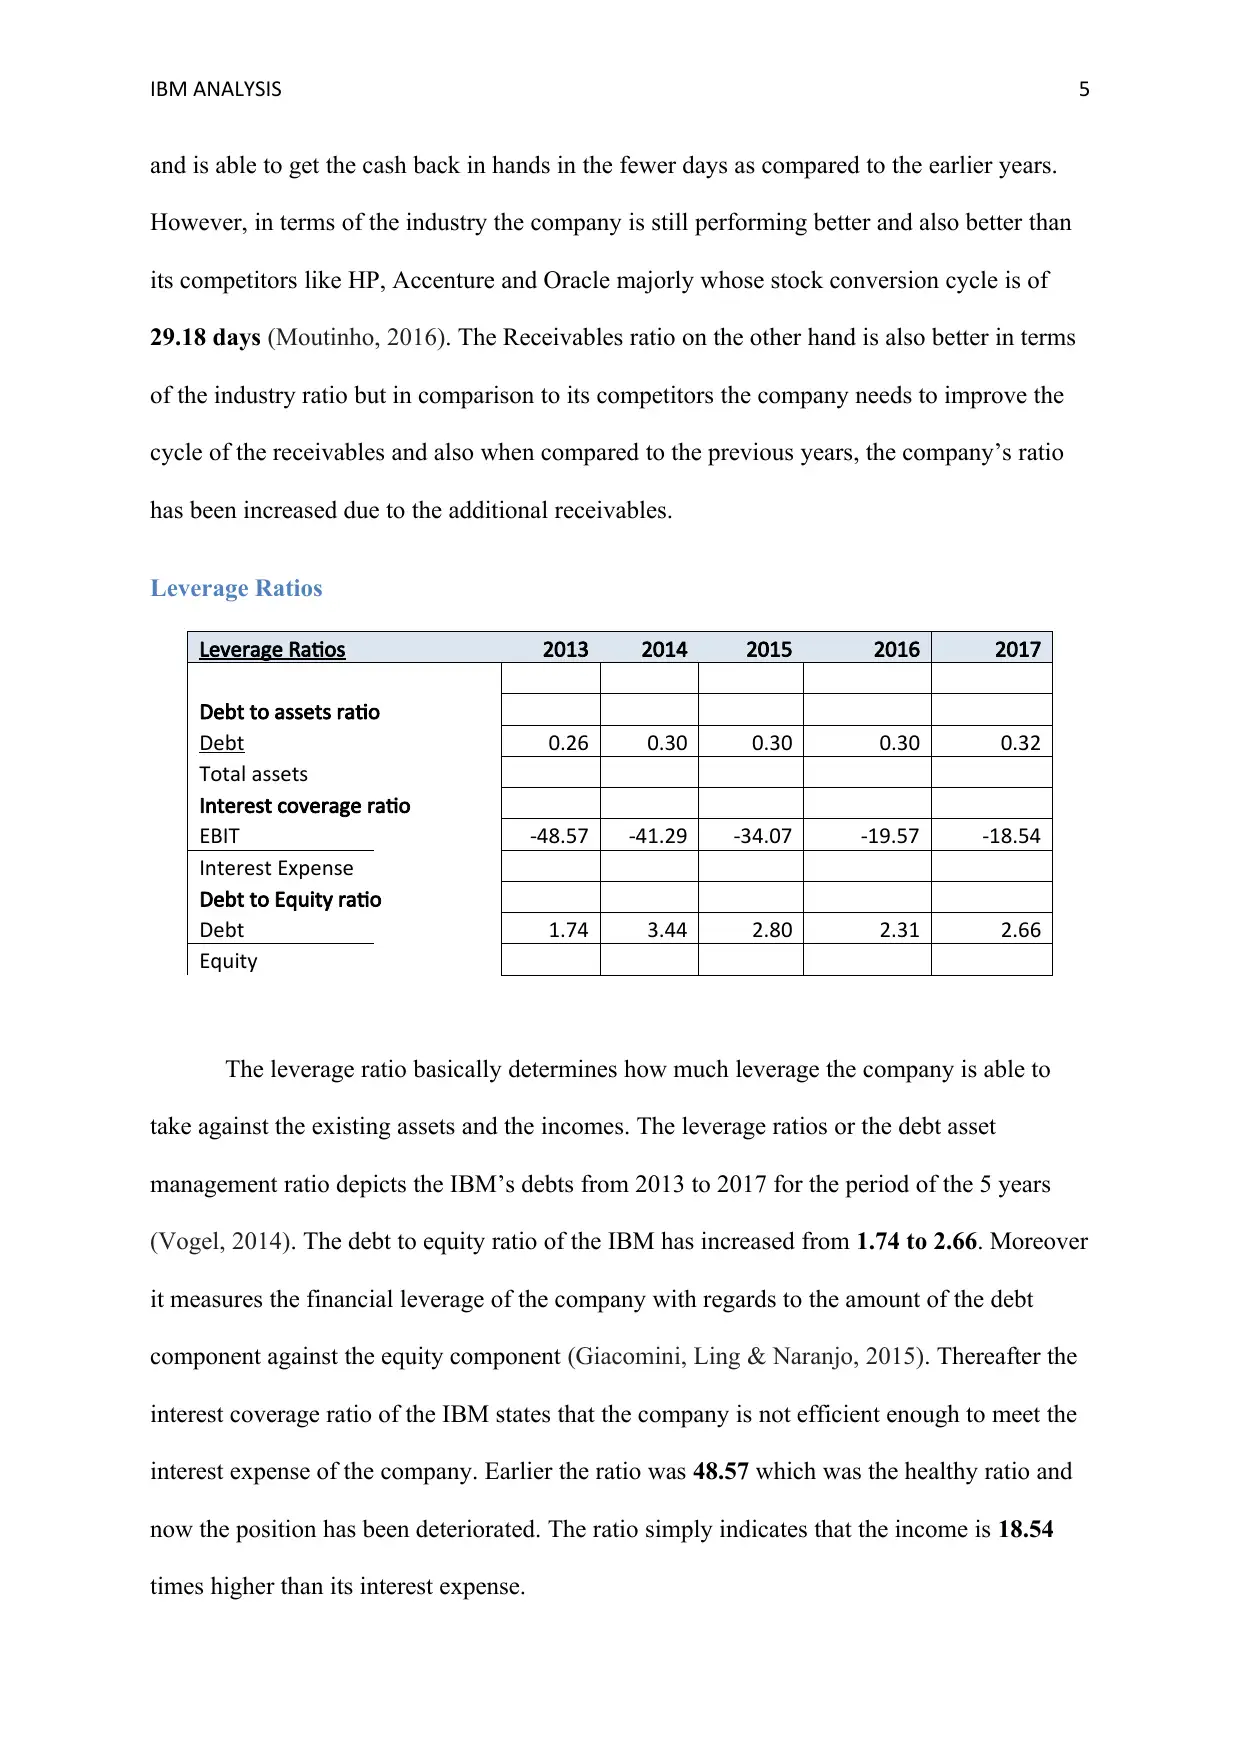
Leverage Ratios
Leverage Ratios 2013 2014 2015 2016 2017
Debt to assets ratio
Debt 0.26 0.30 0.30 0.30 0.32
Total assets
Interest coverage ratio
EBIT -48.57 -41.29 -34.07 -19.57 -18.54
Interest Expense
Debt to Equity ratio
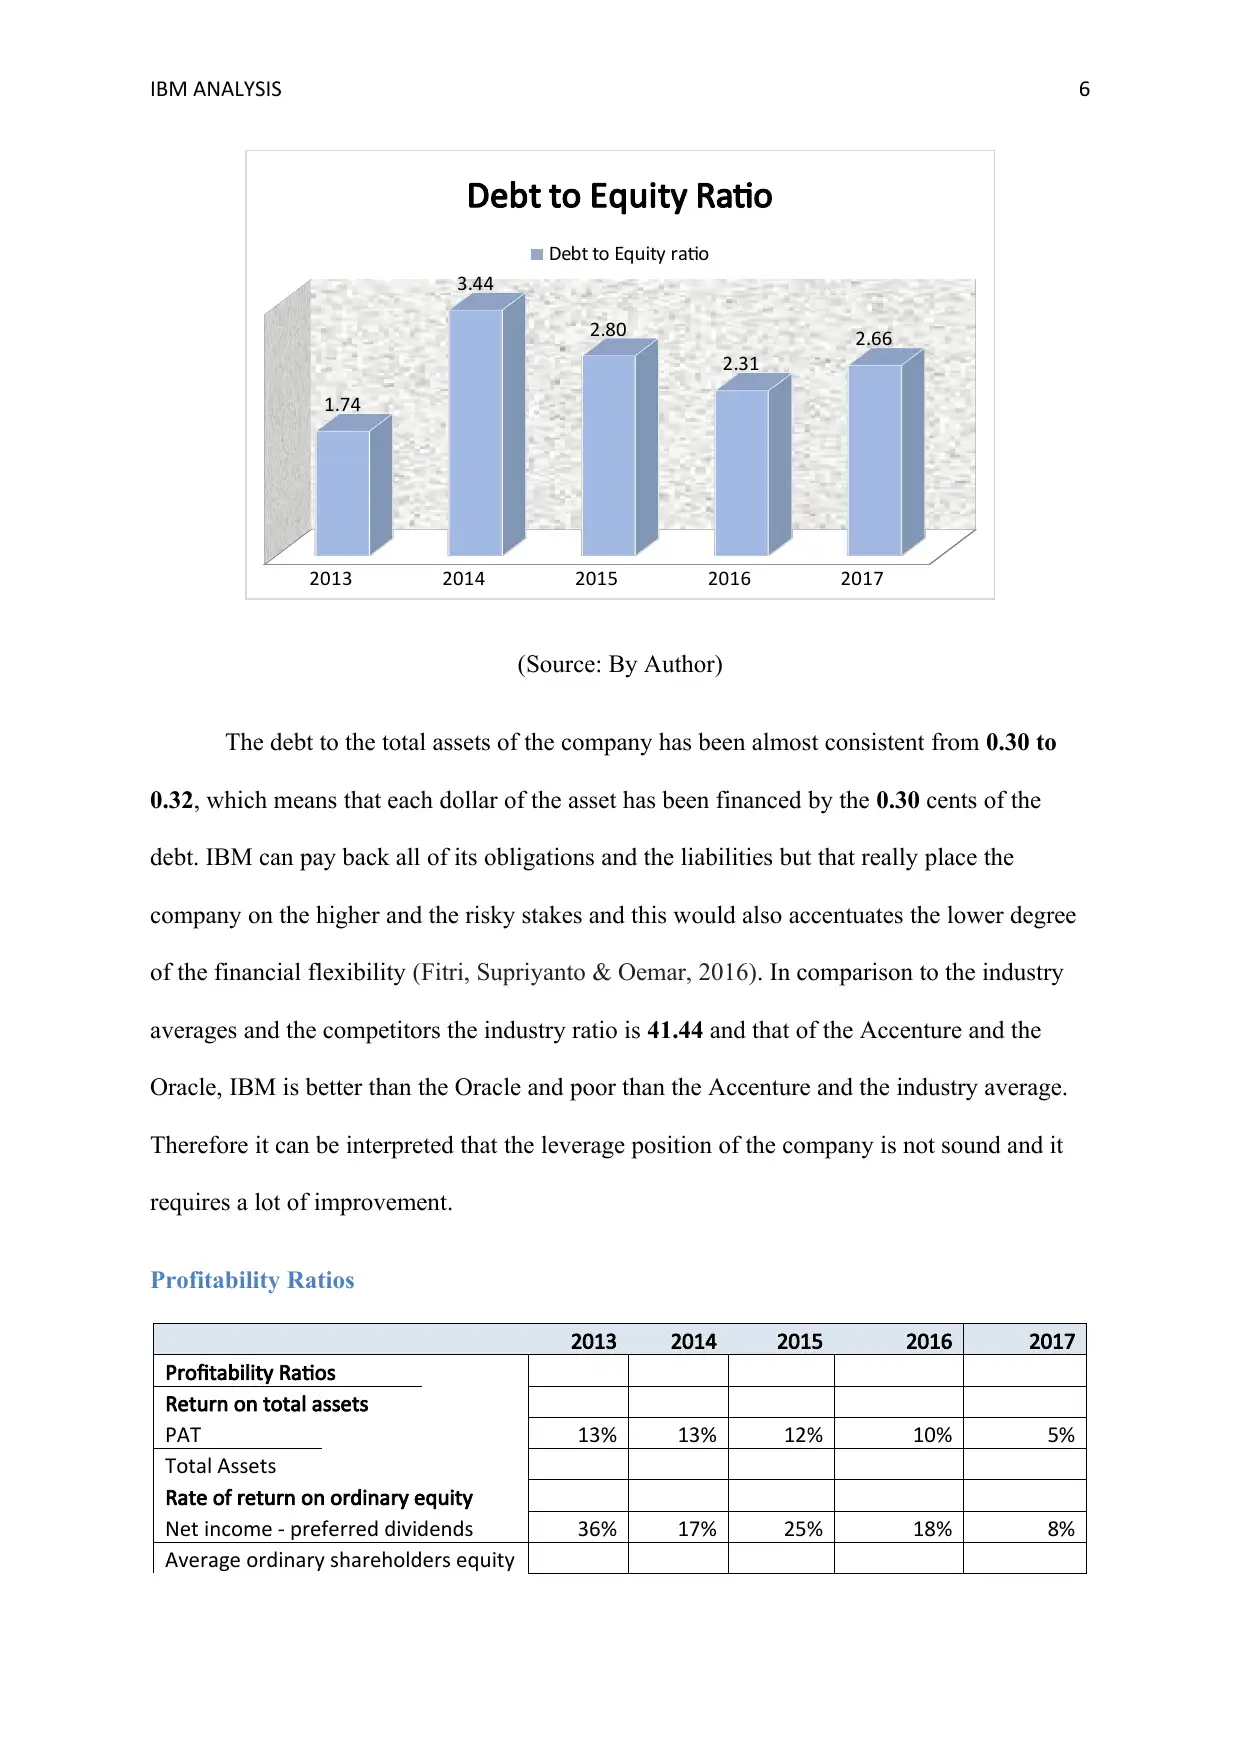
Debt 1.74 3.44 2.80 2.31 2.66
Equity
The leverage ratio basically determines how much leverage the company is able to
take against the existing assets and the incomes. The leverage ratios or the debt asset
management ratio depicts the IBM’s debts from 2013 to 2017 for the period of the 5 years
(Vogel, 2014). The debt to equity ratio of the IBM has increased from 1.74 to 2.66. Moreover
it measures the financial leverage of the company with regards to the amount of the debt
component against the equity component (Giacomini, Ling & Naranjo, 2015). Thereafter the
interest coverage ratio of the IBM states that the company is not efficient enough to meet the
interest expense of the company. Earlier the ratio was 48.57 which was the healthy ratio and
now the position has been deteriorated. The ratio simply indicates that the income is 18.54
times higher than its interest expense.
and is able to get the cash back in hands in the fewer days as compared to the earlier years.
However, in terms of the industry the company is still performing better and also better than
its competitors like HP, Accenture and Oracle majorly whose stock conversion cycle is of
29.18 days (Moutinho, 2016). The Receivables ratio on the other hand is also better in terms
of the industry ratio but in comparison to its competitors the company needs to improve the
cycle of the receivables and also when compared to the previous years, the company’s ratio
has been increased due to the additional receivables.
Leverage Ratios
Leverage Ratios 2013 2014 2015 2016 2017
Debt to assets ratio
Debt 0.26 0.30 0.30 0.30 0.32
Total assets
Interest coverage ratio
EBIT -48.57 -41.29 -34.07 -19.57 -18.54
Interest Expense
Debt to Equity ratio
Debt 1.74 3.44 2.80 2.31 2.66
Equity
The leverage ratio basically determines how much leverage the company is able to
take against the existing assets and the incomes. The leverage ratios or the debt asset
management ratio depicts the IBM’s debts from 2013 to 2017 for the period of the 5 years
(Vogel, 2014). The debt to equity ratio of the IBM has increased from 1.74 to 2.66. Moreover
it measures the financial leverage of the company with regards to the amount of the debt
component against the equity component (Giacomini, Ling & Naranjo, 2015). Thereafter the
interest coverage ratio of the IBM states that the company is not efficient enough to meet the
interest expense of the company. Earlier the ratio was 48.57 which was the healthy ratio and
now the position has been deteriorated. The ratio simply indicates that the income is 18.54
times higher than its interest expense.
⊘ This is a preview!⊘
Do you want full access?
Subscribe today to unlock all pages.
Trusted by 1+ million students worldwide
IBM ANALYSIS 6
2013 2014 2015 2016 2017
1.74
3.44
2.80
2.31
2.66
Debt to Equity Ratio
Debt to Equity ratio
(Source: By Author)
The debt to the total assets of the company has been almost consistent from 0.30 to
0.32, which means that each dollar of the asset has been financed by the 0.30 cents of the
debt. IBM can pay back all of its obligations and the liabilities but that really place the
company on the higher and the risky stakes and this would also accentuates the lower degree
of the financial flexibility (Fitri, Supriyanto & Oemar, 2016). In comparison to the industry
averages and the competitors the industry ratio is 41.44 and that of the Accenture and the
Oracle, IBM is better than the Oracle and poor than the Accenture and the industry average.
Therefore it can be interpreted that the leverage position of the company is not sound and it
requires a lot of improvement.
Profitability Ratios
2013 2014 2015 2016 2017
Profitability Ratios
Return on total assets
PAT 13% 13% 12% 10% 5%
Total Assets
Rate of return on ordinary equity
Net income - preferred dividends 36% 17% 25% 18% 8%
Average ordinary shareholders equity
2013 2014 2015 2016 2017
1.74
3.44
2.80
2.31
2.66
Debt to Equity Ratio
Debt to Equity ratio
(Source: By Author)
The debt to the total assets of the company has been almost consistent from 0.30 to
0.32, which means that each dollar of the asset has been financed by the 0.30 cents of the
debt. IBM can pay back all of its obligations and the liabilities but that really place the
company on the higher and the risky stakes and this would also accentuates the lower degree
of the financial flexibility (Fitri, Supriyanto & Oemar, 2016). In comparison to the industry
averages and the competitors the industry ratio is 41.44 and that of the Accenture and the
Oracle, IBM is better than the Oracle and poor than the Accenture and the industry average.
Therefore it can be interpreted that the leverage position of the company is not sound and it
requires a lot of improvement.
Profitability Ratios
2013 2014 2015 2016 2017
Profitability Ratios
Return on total assets
PAT 13% 13% 12% 10% 5%
Total Assets
Rate of return on ordinary equity
Net income - preferred dividends 36% 17% 25% 18% 8%
Average ordinary shareholders equity
Paraphrase This Document
Need a fresh take? Get an instant paraphrase of this document with our AI Paraphraser
IBM ANALYSIS 7
Net profit Margin
Net Income *
100 17% 13% 16% 15% 7%
Sales
Gross profit margin
Gross profit 49% 50% 50% 48% 46%
Sales
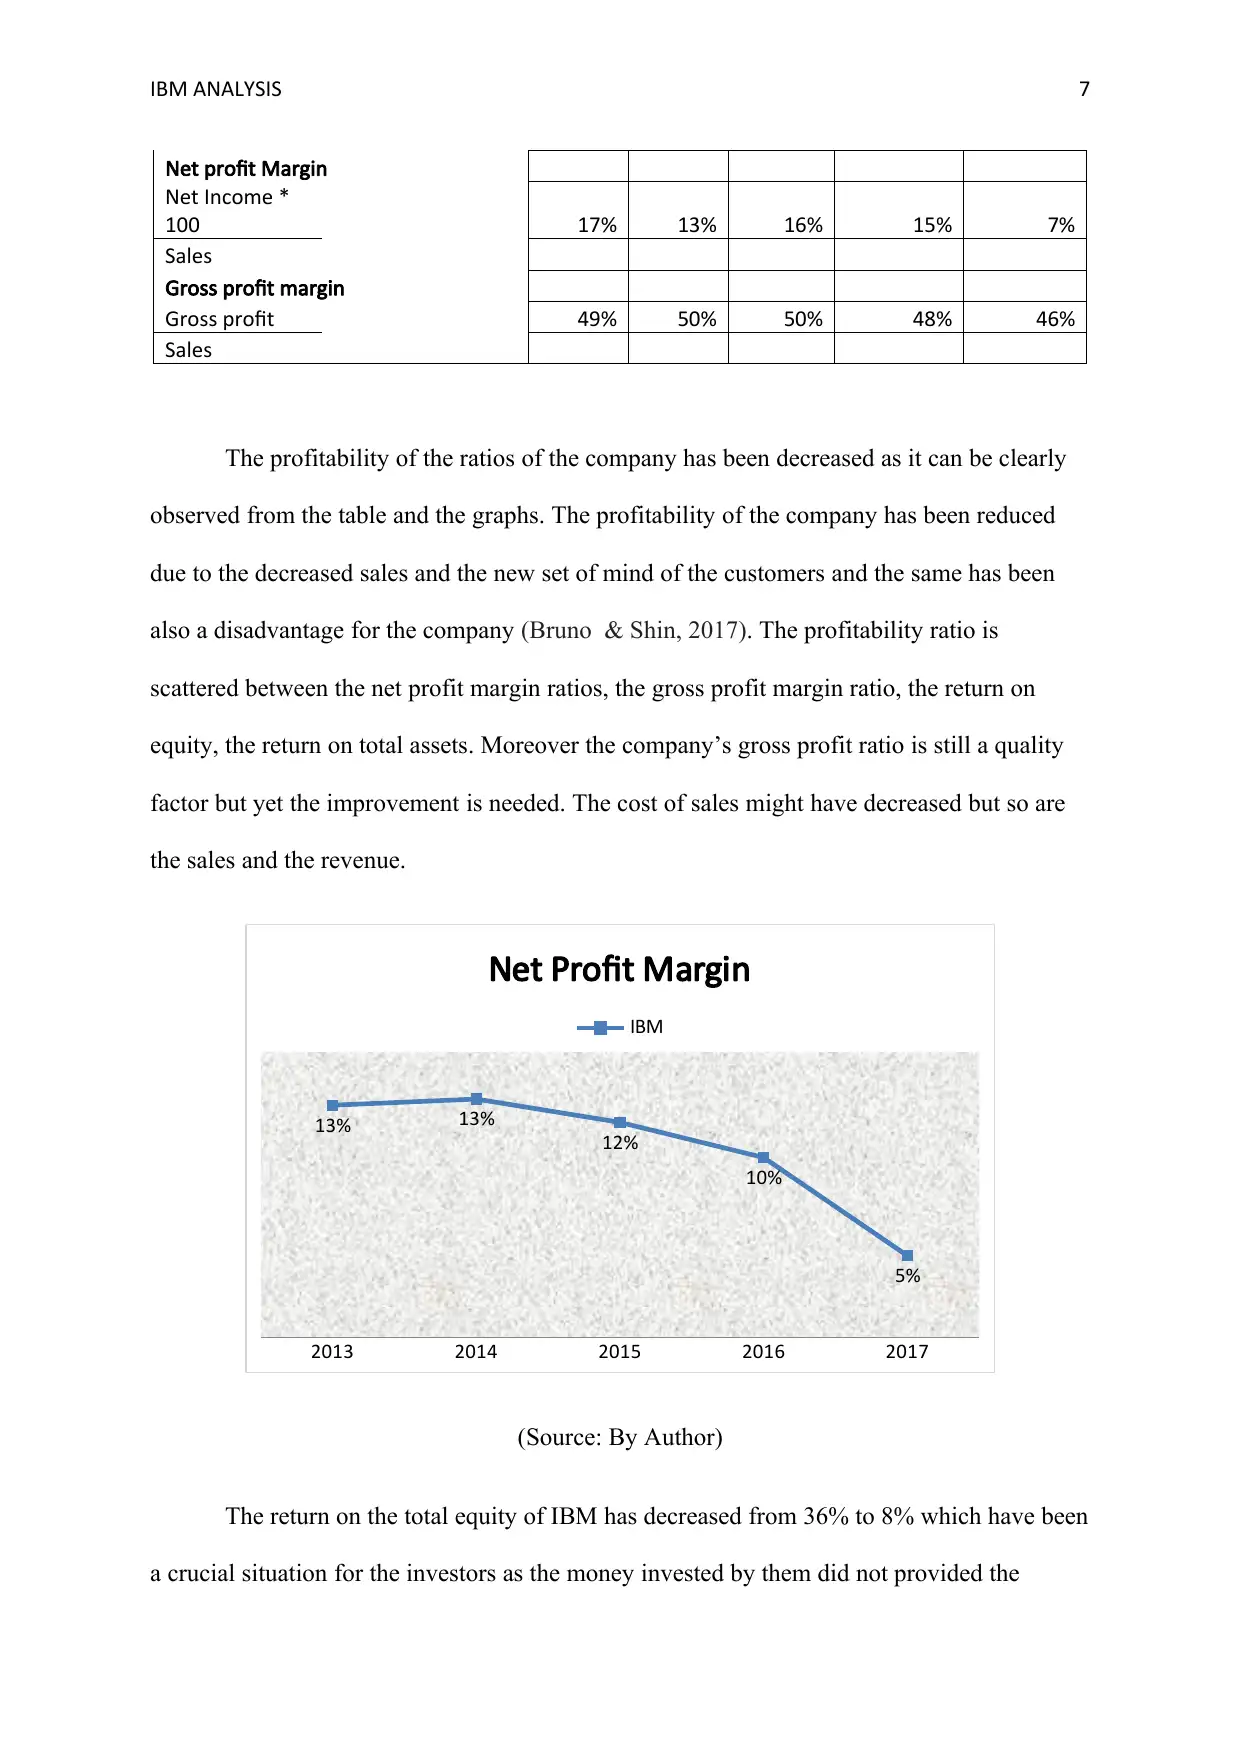
The profitability of the ratios of the company has been decreased as it can be clearly
observed from the table and the graphs. The profitability of the company has been reduced
due to the decreased sales and the new set of mind of the customers and the same has been
also a disadvantage for the company (Bruno & Shin, 2017). The profitability ratio is
scattered between the net profit margin ratios, the gross profit margin ratio, the return on
equity, the return on total assets. Moreover the company’s gross profit ratio is still a quality
factor but yet the improvement is needed. The cost of sales might have decreased but so are
the sales and the revenue.
2013 2014 2015 2016 2017
13% 13%
12%
10%
5%
Net Profit Margin
IBM
(Source: By Author)
The return on the total equity of IBM has decreased from 36% to 8% which have been
a crucial situation for the investors as the money invested by them did not provided the
Net profit Margin
Net Income *
100 17% 13% 16% 15% 7%
Sales
Gross profit margin
Gross profit 49% 50% 50% 48% 46%
Sales
The profitability of the ratios of the company has been decreased as it can be clearly
observed from the table and the graphs. The profitability of the company has been reduced
due to the decreased sales and the new set of mind of the customers and the same has been
also a disadvantage for the company (Bruno & Shin, 2017). The profitability ratio is
scattered between the net profit margin ratios, the gross profit margin ratio, the return on
equity, the return on total assets. Moreover the company’s gross profit ratio is still a quality
factor but yet the improvement is needed. The cost of sales might have decreased but so are
the sales and the revenue.
2013 2014 2015 2016 2017
13% 13%
12%
10%
5%
Net Profit Margin
IBM
(Source: By Author)
The return on the total equity of IBM has decreased from 36% to 8% which have been
a crucial situation for the investors as the money invested by them did not provided the
IBM ANALYSIS 8
quality returns. On the other hand the return on the total assets of the company has also been
decreased from 13% to 5%. The return on the total assets of the company depicts the returns
the IBM can get with the use of the existing assets usefully and judiciously. In comparison to
the industry and the competitor analysis the company needs to improve a lot. IBM’s net profit
ratio is 7% for the current year whereas in comparison to the HP, Accenture and the Oracle,
the net profit margin of the HP is 4.85% and the 9.37 for the Accenture. Oracle poses the
highest ratio among the three and industry ratio is 17% and IBM is far behind it (Noor &
Lodhi, 2015). Therefore from the above results it can be interpreted that IBM needs to
improve the sales pattern to reach near to the industry ratio (Yu, Barros, Tsai & Liao, 2014).
Conclusion
From the above analysis it can be concluded that the financial performance of the
company has been deteriorated as compared over the period of the 5 years. Furthermore the
profitability position as well as the liquidity position of the company, it has been screwed up
and the company needs to take the immediate actions to resolve the scene. The IBM though is
sound in case of the efficiency ratios yet the company needs to analyse the market risks as
well the position of the company with respect to the industry ratios and the competitor ratios
as well. The company is lower than the industry ratios in every aspect and in terms of the
competitors few areas of the HP are better and few areas of the Accenture are poor than the
IBM. Therefore it can be interpreted that the IBM needs to be improved.
Recommendation and Assumption
Form the above analysis it can be recommended that the company needs to improve
the liquidity position of the company by purchasing more assets and utilising the existing
⊘ This is a preview!⊘
Do you want full access?
Subscribe today to unlock all pages.
Trusted by 1+ million students worldwide
IBM ANALYSIS 9
assets more judiciously. Moreover the leverage position of the company can also be improved
by investing the funds on the potential areas and financing through debt to get the benefit of
the tax reduction. Further the efficiency of IBM is sound and therefore the company can work
upon the weaknesses and can convert the IBM into all together a new company on the basis
of the above assumptions.
Paraphrase This Document
Need a fresh take? Get an instant paraphrase of this document with our AI Paraphraser
IBM ANALYSIS 10
References
Bruno, V., & Shin, H. S. (2017). Global dollar credit and carry trades: a firm-level
analysis. The Review of Financial Studies, 30(3), 703-749.
Fitri, M. C., Supriyanto, A., & Oemar, A. (2016). Analysis of debt to equity ratio, firm size,
inventory turnover, cash turnover, working capital turnover and current ratio to
profitability company (study on mining companies listed in bei period 2010-
2013). Journal Of Accounting, 2(2).
Giacomini, E., Ling, D. C., & Naranjo, A. (2015). Leverage and returns: A cross-country
analysis of public real estate markets. The Journal of Real Estate Finance and
Economics, 51(2), 125-159.
Goldmann, K. (2017). Financial liquidity and profitability management in practice of polish
business. In Financial Environment and Business Development . New York: Springer.
Grant, R. M. (2016). Contemporary strategy analysis: Text and cases edition. United States:
John Wiley & Sons.
IBM, (2017). Annual Report. Retrieved from https://www.ibm.com/annualreport/index.html
IBM, (2017). Industry Ratios. Retrieved from
https://www.reuters.com/finance/stocks/financial-highlights/IBM
IBM, (2018). Strategy and Transformation. Retrieved from.
https://www-935.ibm.com/services/in/gbs/strategy/
Moutinho, S., Martínez-Llorens, S., Tomás-Vidal, A., Jover-Cerdá, M., Oliva-Teles, A., &
Peres, H. (2017). Meat and bone meal as partial replacement for fish meal in diets for
IBM ANALYSIS 11
gilthead seabream (Sparus aurata) juveniles: Growth, feed efficiency, amino acid
utilization, and economic efficiency. Aquaculture, 468, 271-277.
Noor, A., & Lodhi, S. (2015). Impact of Liquidity Ratio on Profitability: An Empirical Study
of Automobile Sector in Karachi. International Journal of Scientific and Research
Publications, 639.
Rakićević, A., Milošević, P., Petrović, B., & Radojević, D. G. (2016). DuPont financial ratio
analysis using logical aggregation. In Soft Computing Applications New York:
Springer.
Vogel, H. L. (2014). Entertainment industry economics: A guide for financial analysis.
Cambridge: Cambridge University Press.
Yu, Y. S., Barros, A., Tsai, C. H., & Liao, K. H. (2014). A comparison of ratios and data
envelopment analysis: Efficiency assessment of Taiwan public listed
companies. International Journal of Academic Research in Accounting, Finance and
Management Sciences, 4(1), 212-219.
⊘ This is a preview!⊘
Do you want full access?
Subscribe today to unlock all pages.
Trusted by 1+ million students worldwide
1 out of 14
Related Documents


Your All-in-One AI-Powered Toolkit for Academic Success.
+13062052269
info@desklib.com
Available 24*7 on WhatsApp / Email
![[object Object]](/_next/static/media/star-bottom.7253800d.svg)
Unlock your academic potential
Copyright © 2020–2026 A2Z Services. All Rights Reserved. Developed and managed by ZUCOL.