Comparative Financial Ratio Analysis of Boral and CSR Limited

Verified

Added on  2020/02/24

|10
|1161
|40
Report
AI Summary
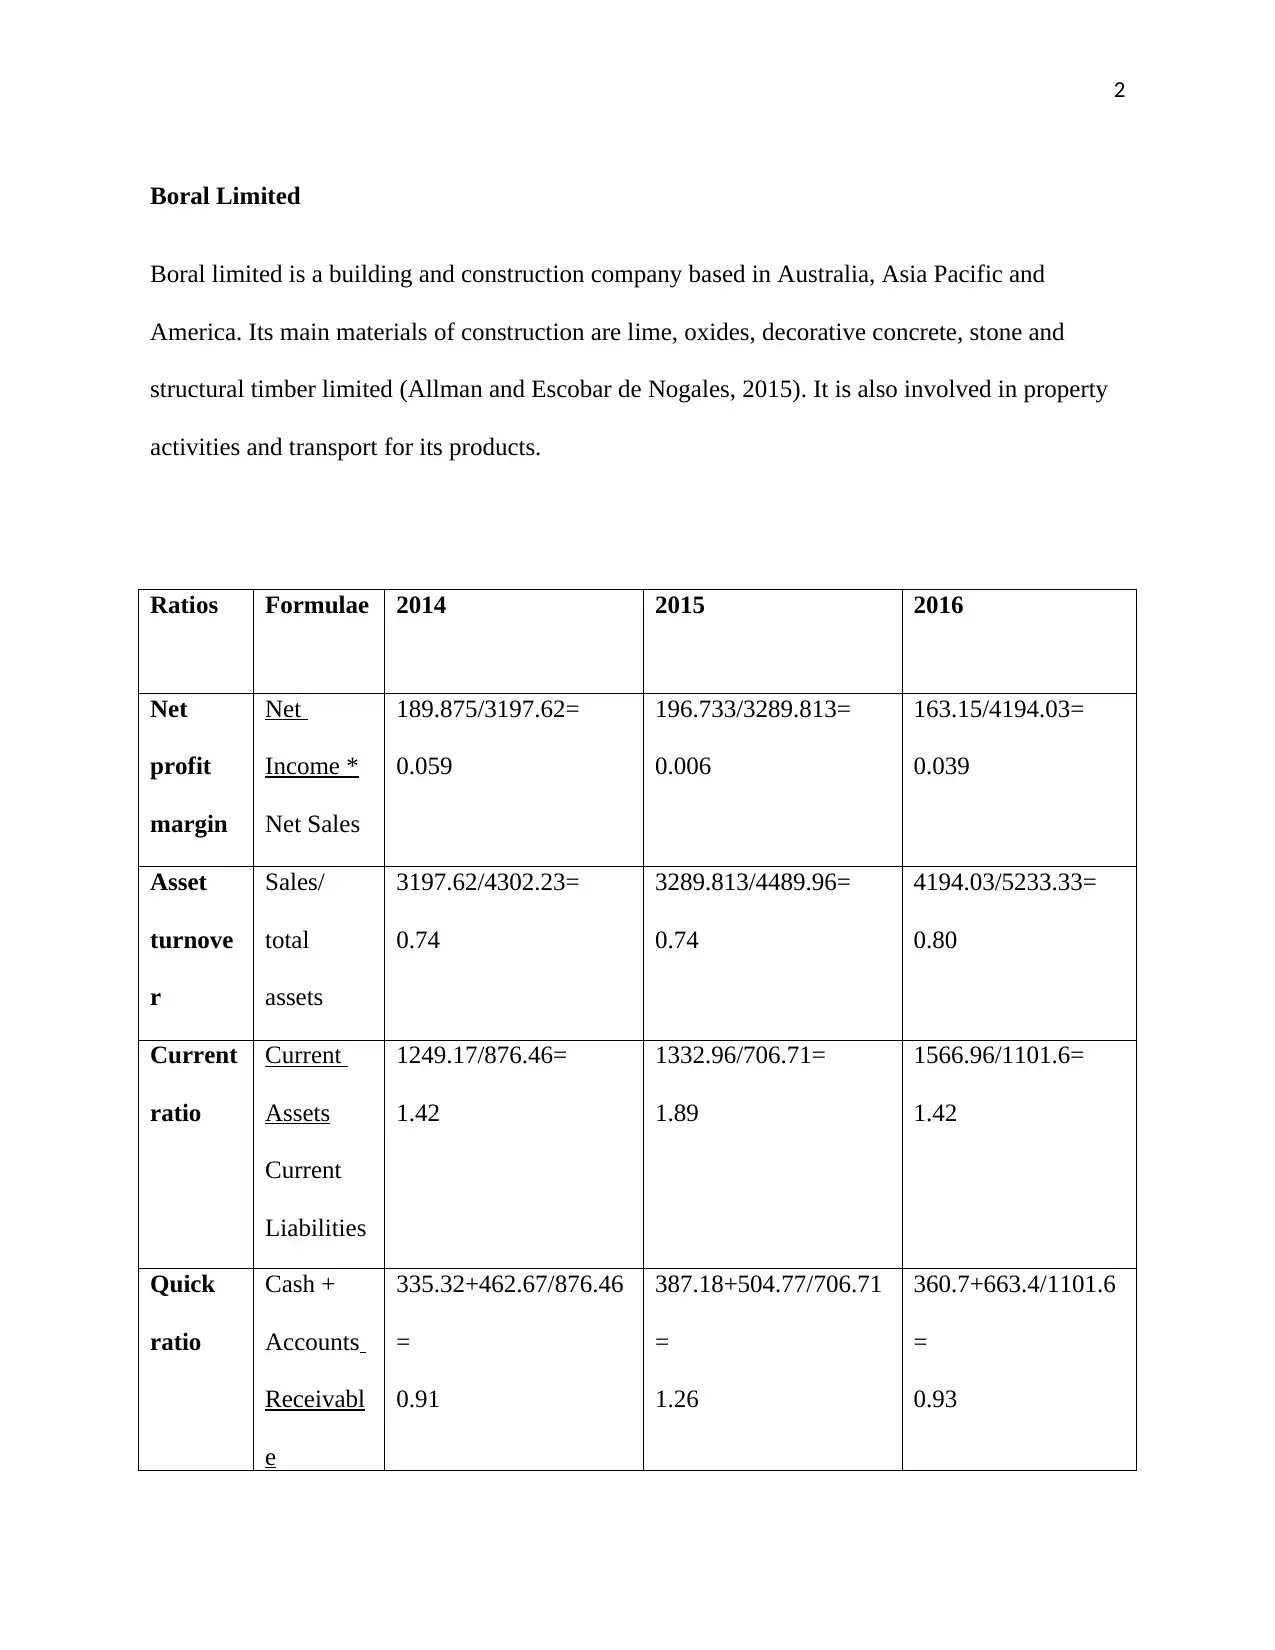
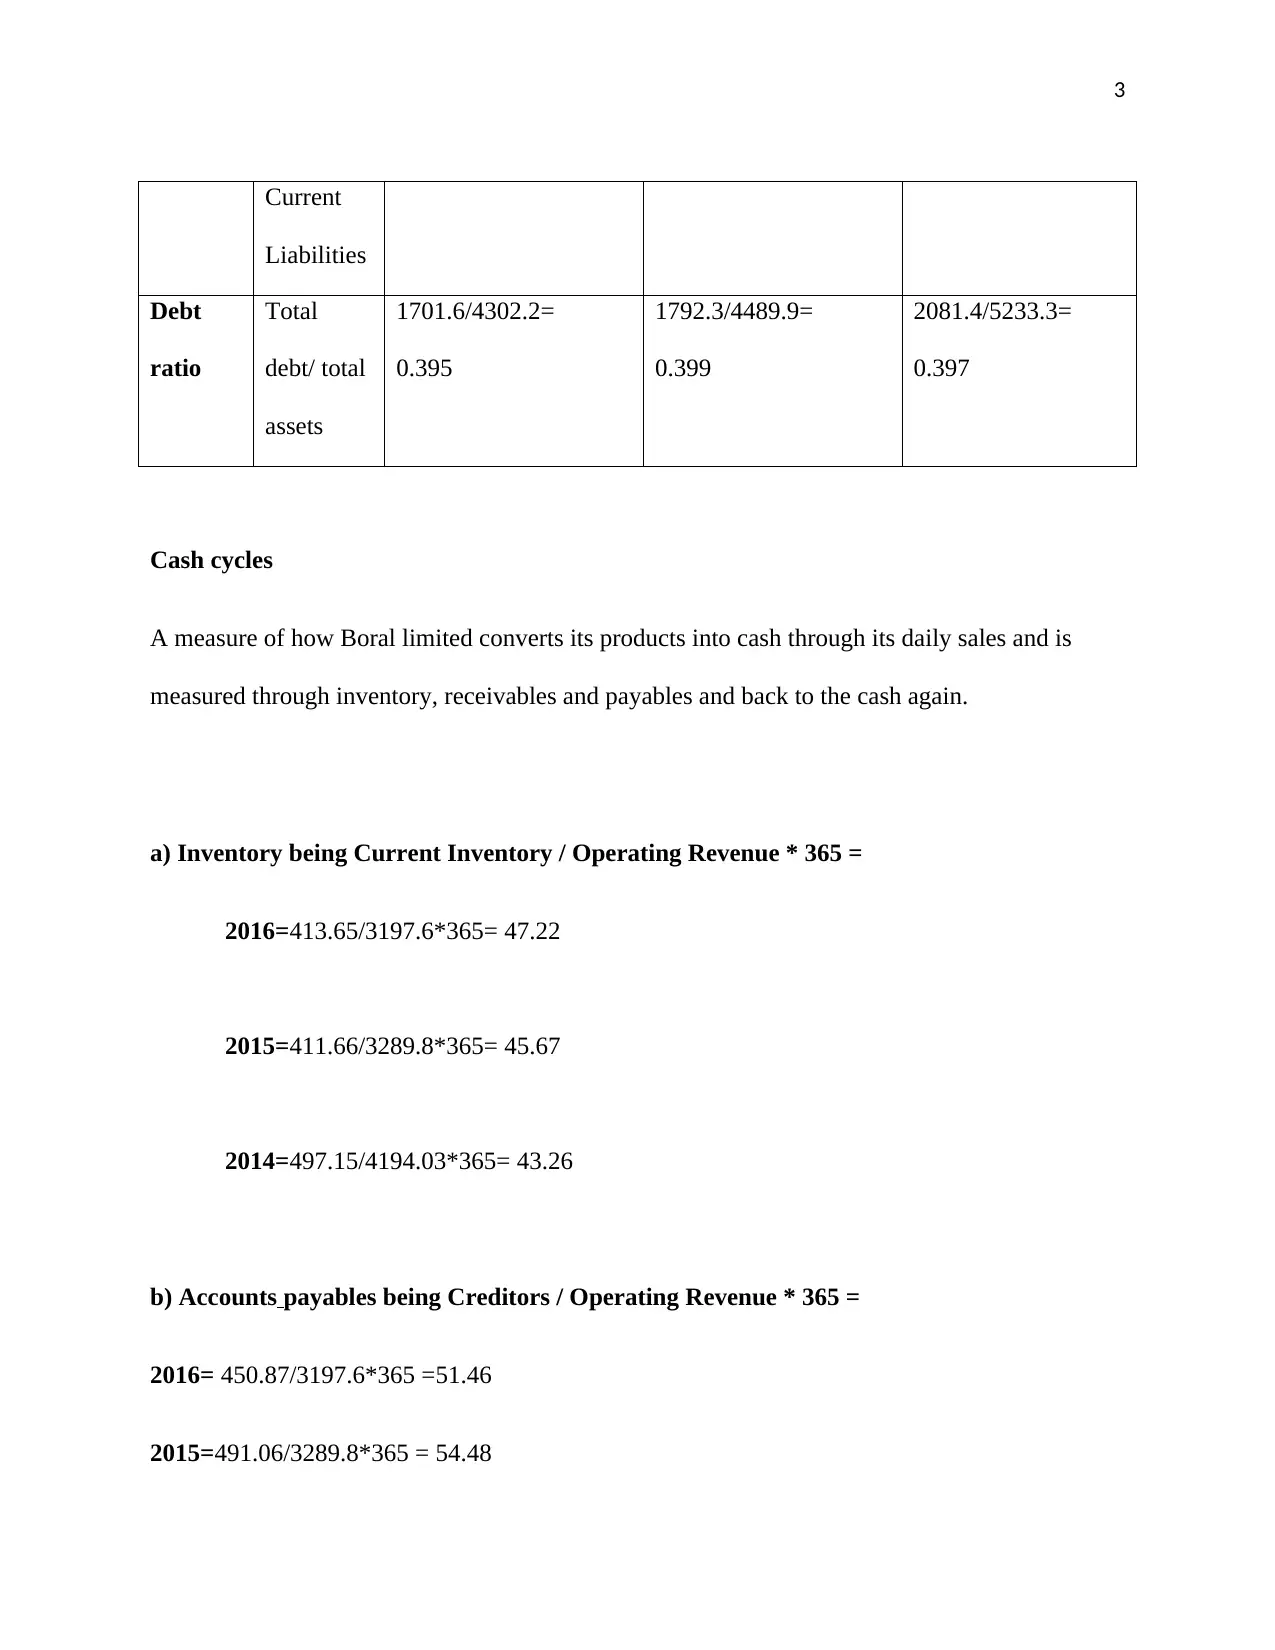
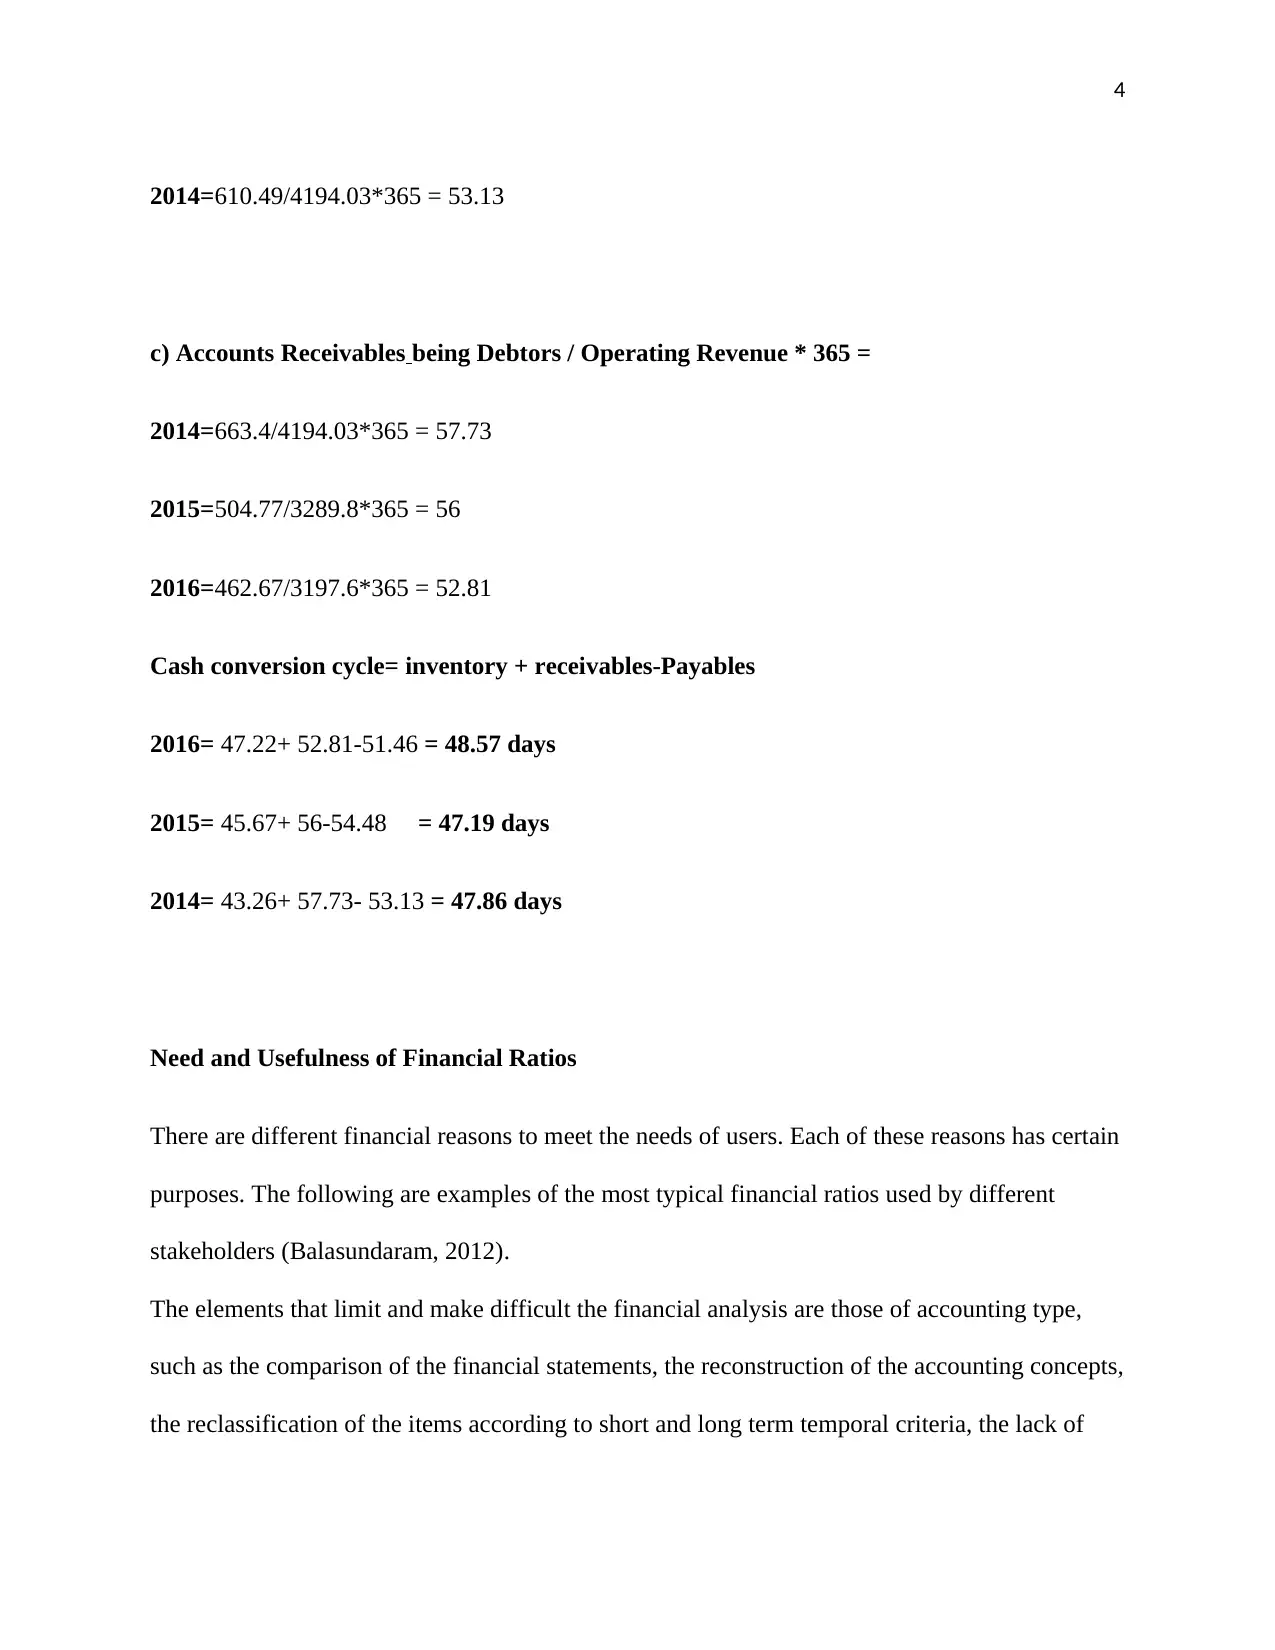
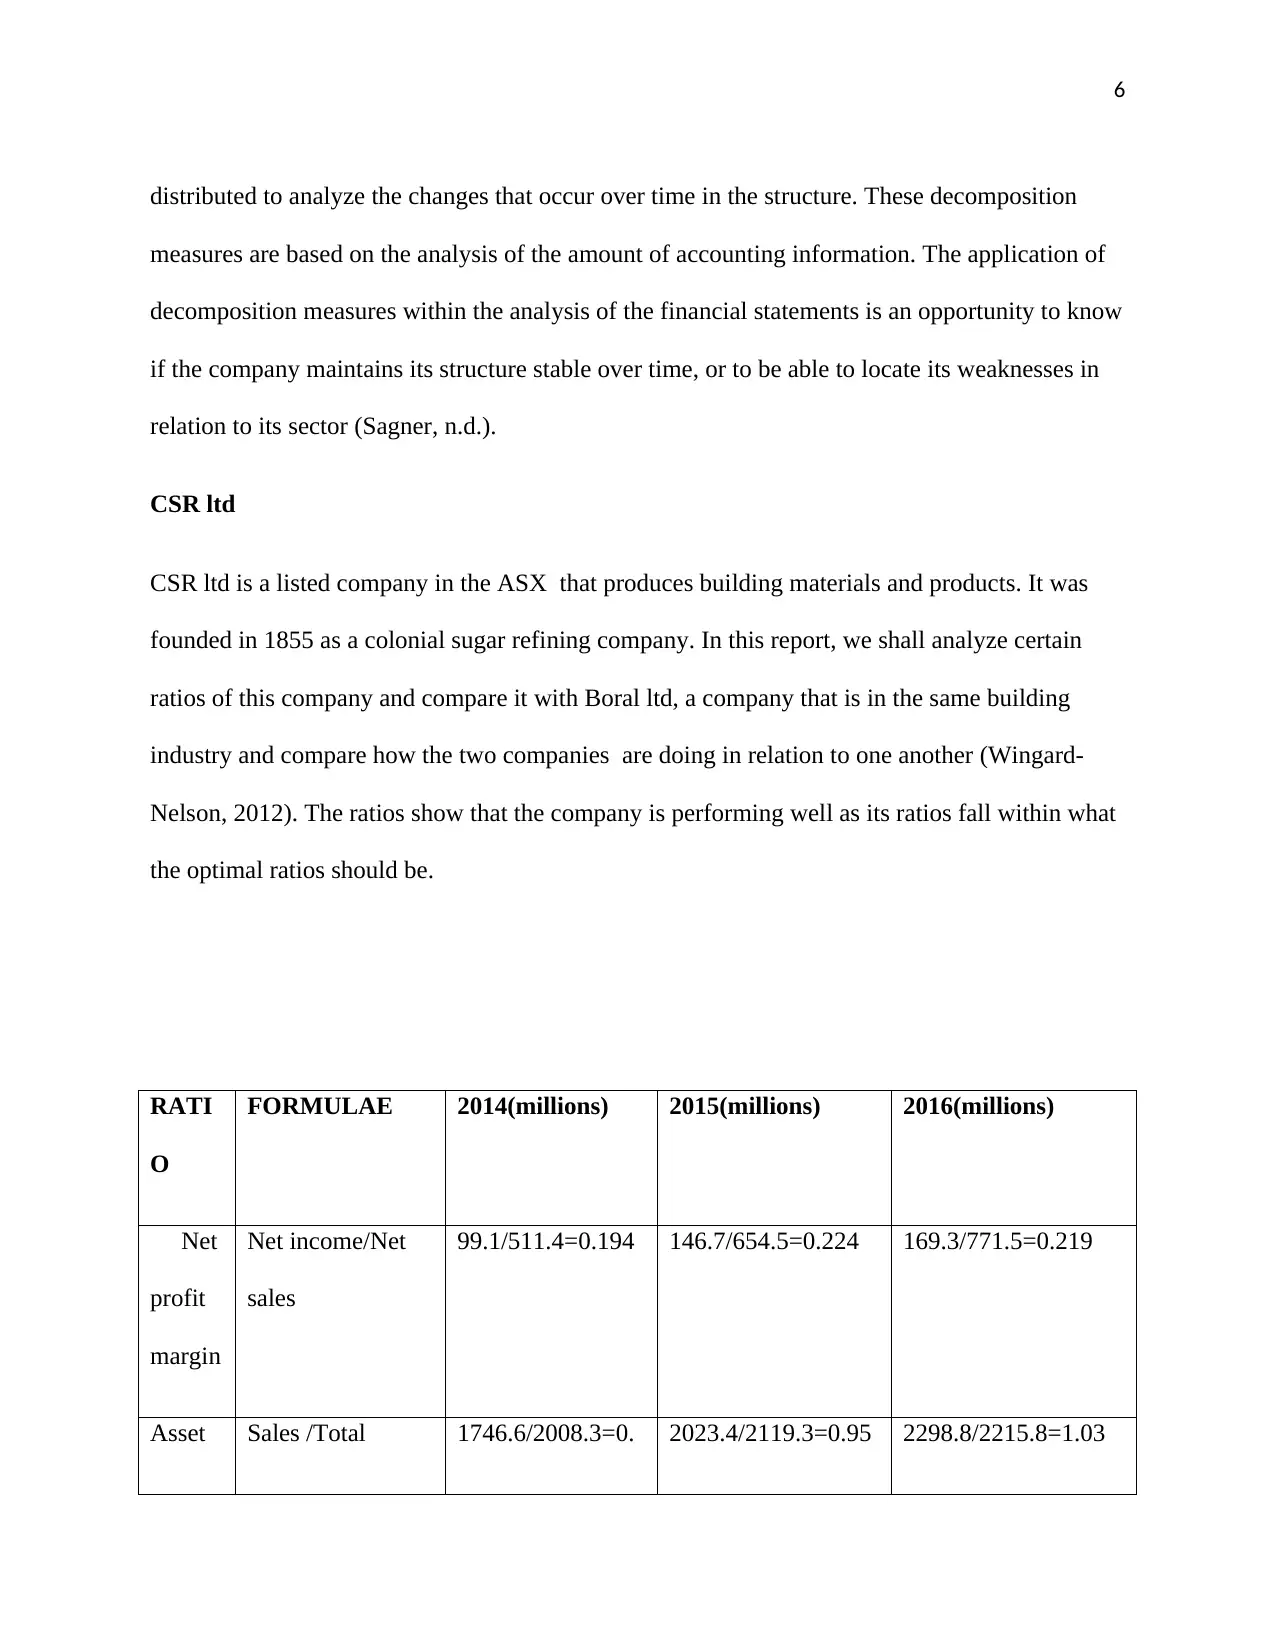
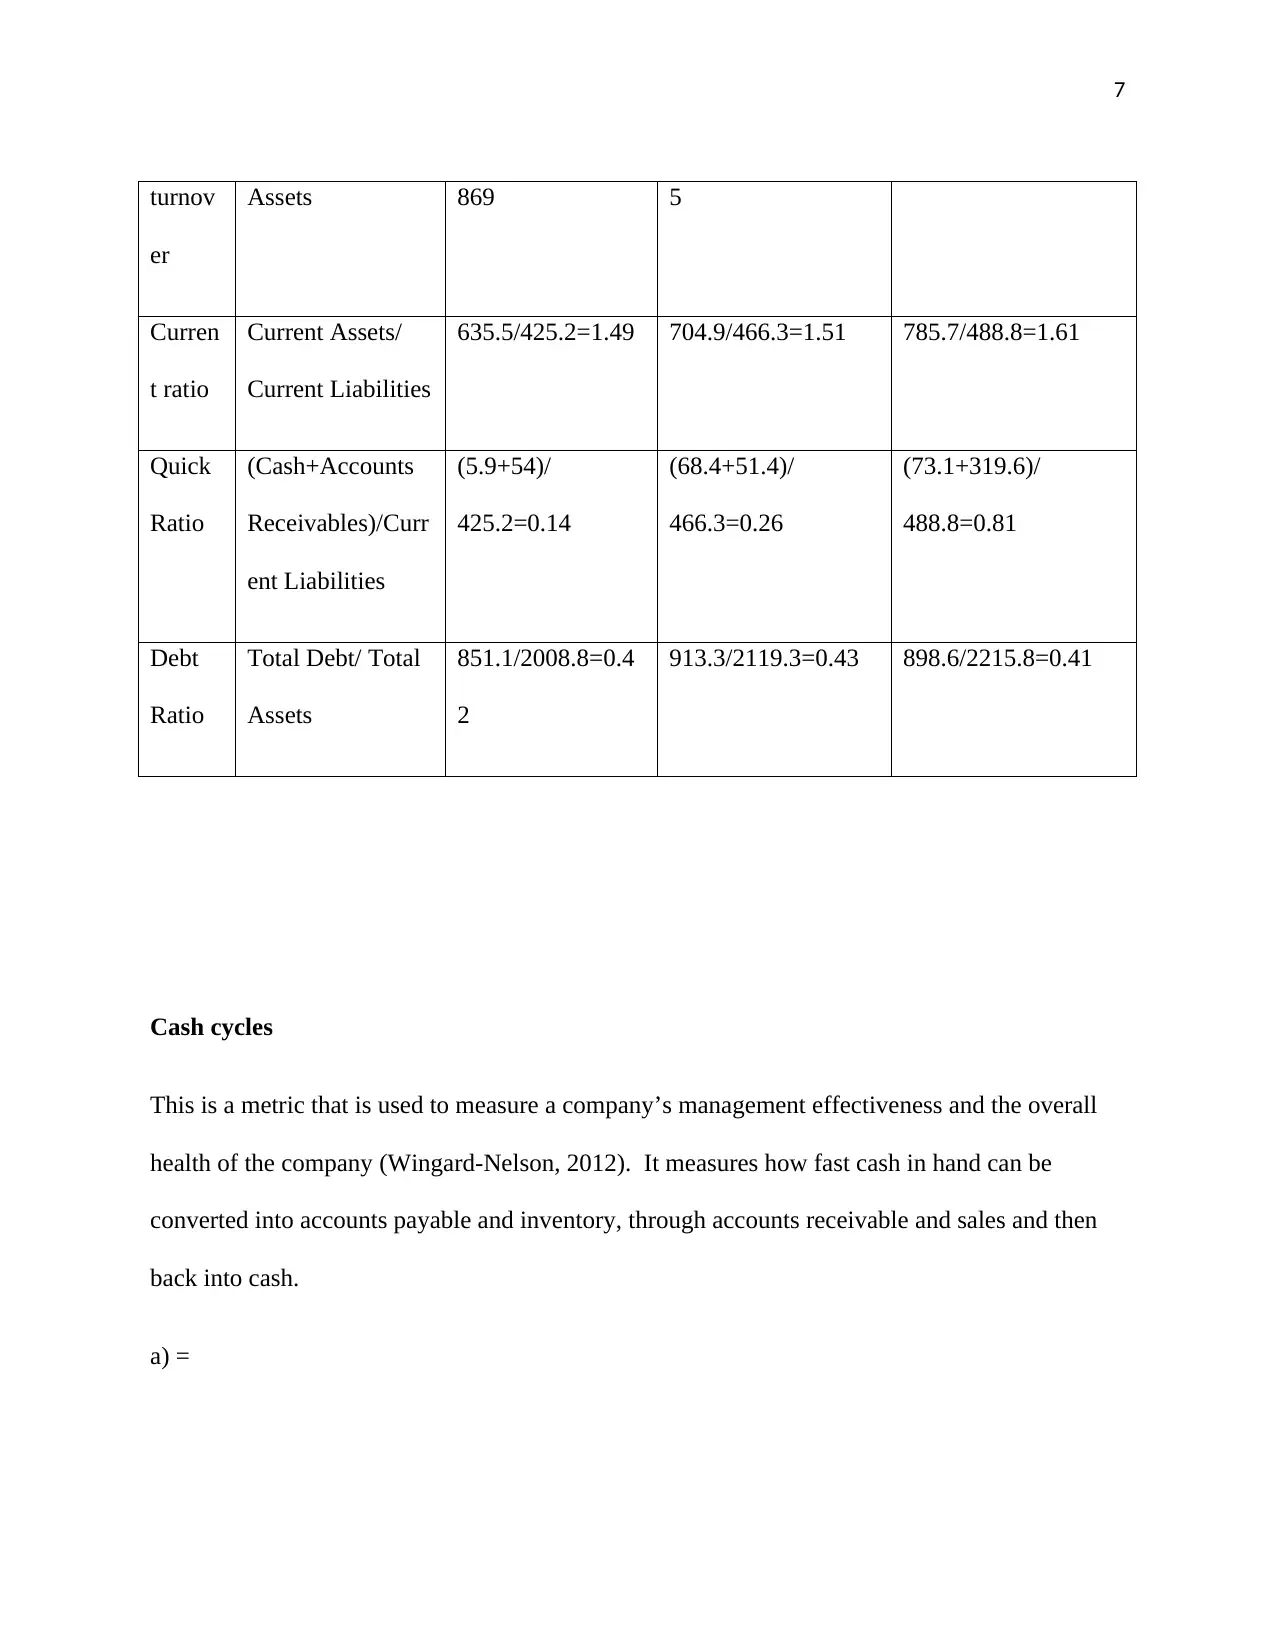
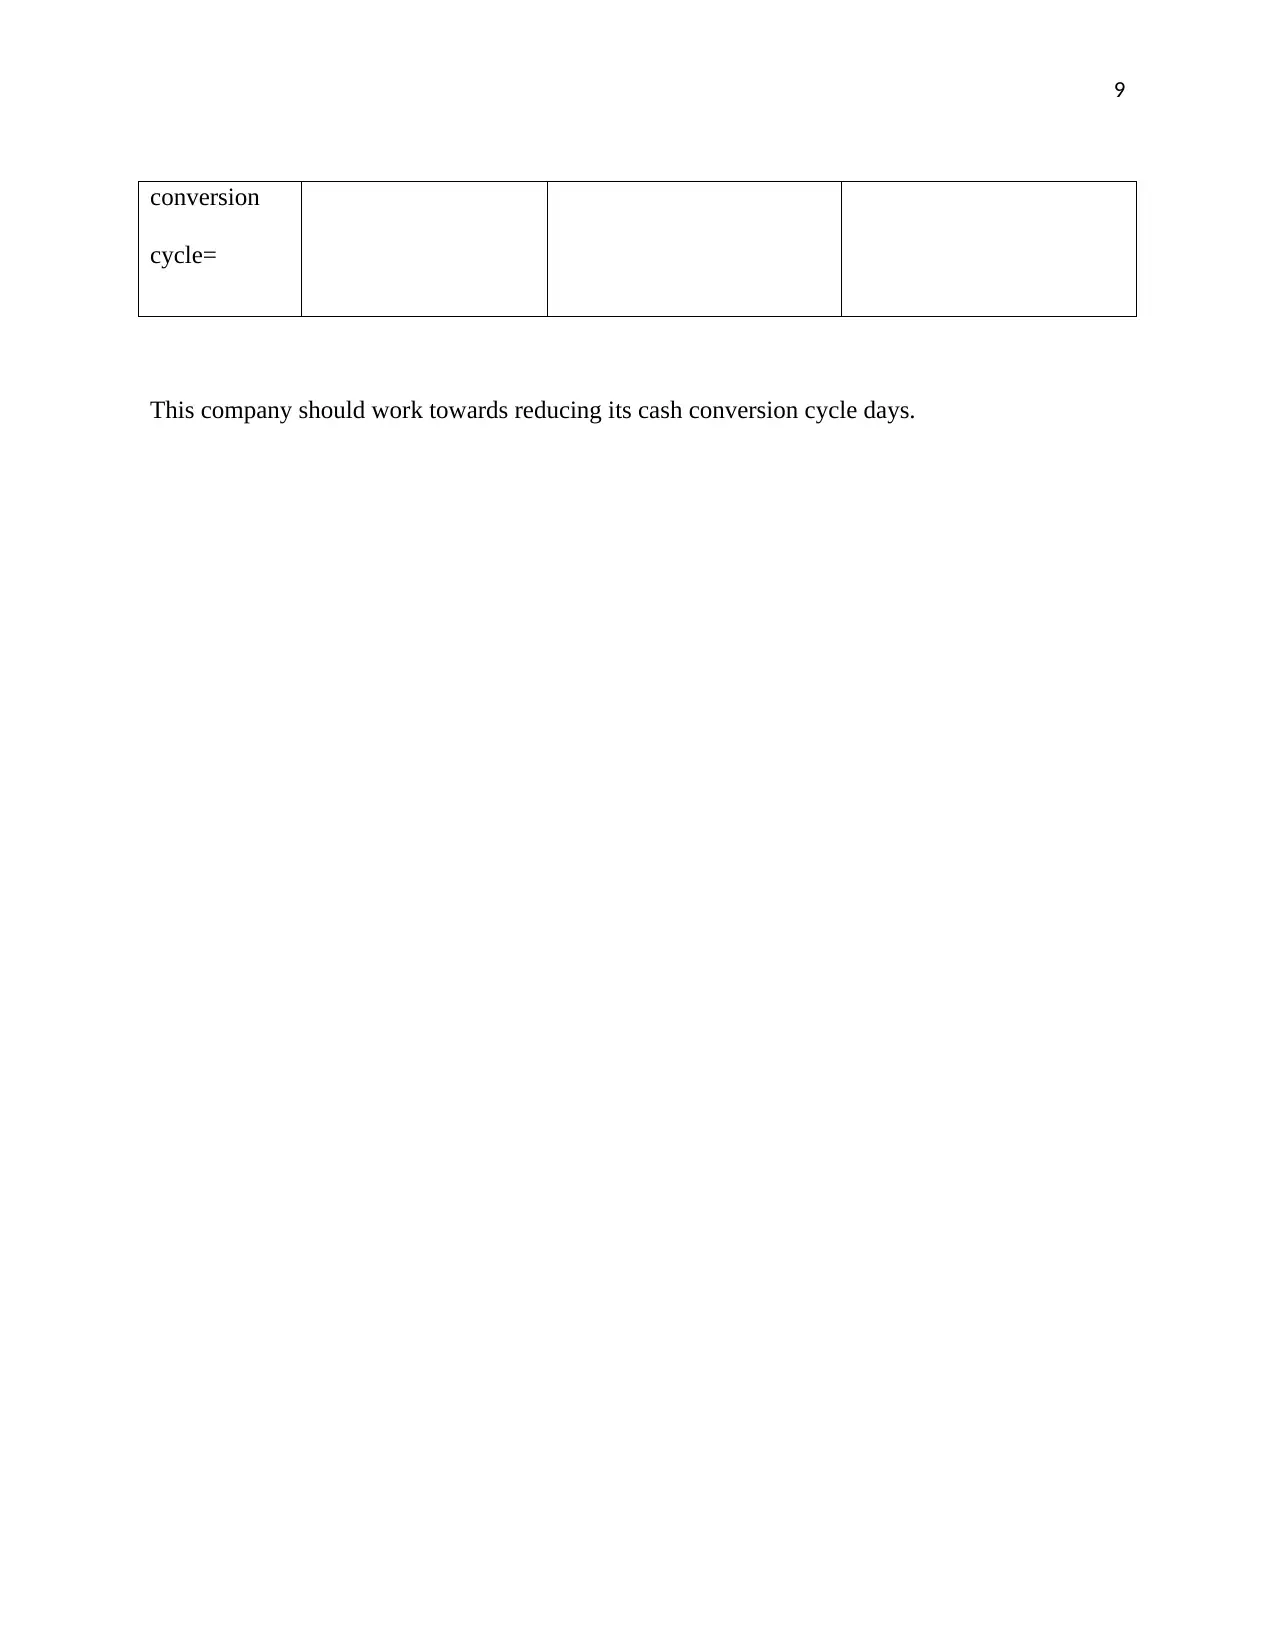
This report presents a financial ratio analysis of Boral Limited and CSR Limited, two companies in the building and construction industry. The analysis covers several years, calculating and comparing key financial ratios such as net profit margin, asset turnover, current ratio, quick ratio, and debt ratio. The report also includes a cash conversion cycle analysis for both companies, providing insights into their working capital management. Furthermore, the report discusses the need and usefulness of financial ratios, their limitations, and the importance of considering various factors when interpreting them. The findings highlight the financial performance and efficiency of both companies, offering a comparative perspective within the building materials sector. The report utilizes financial statements and industry data to provide a comprehensive understanding of the companies' financial health and operational effectiveness.
tabler-icon-diamond-filled.svg

Contribute Materials

Your contribution can guide someone’s learning journey. Share your documents today.
Document Page
1
Name:
Course
Professor’s name
University name
City, State
Date of submission
tabler-icon-diamond-filled.svg

Secure Best Marks with AI Grader

Need help grading? Try our AI Grader for instant feedback on your assignments.
Document Page
2
Boral Limited
Boral limited is a building and construction company based in Australia, Asia Pacific and
America. Its main materials of construction are lime, oxides, decorative concrete, stone and
structural timber limited (Allman and Escobar de Nogales, 2015). It is also involved in property
activities and transport for its products.
Ratios Formulae 2014 2015 2016
Net
profit
margin
Net
Income *
Net Sales
189.875/3197.62=
0.059
196.733/3289.813=
0.006
163.15/4194.03=
0.039
Asset
turnove
r
Sales/
total
assets
3197.62/4302.23=
0.74
3289.813/4489.96=
0.74
4194.03/5233.33=
0.80
Current
ratio
Current
Assets
Current
Liabilities
1249.17/876.46=
1.42
1332.96/706.71=
1.89
1566.96/1101.6=
1.42
Quick
ratio
Cash +
Accounts
Receivabl
e
335.32+462.67/876.46
=
0.91
387.18+504.77/706.71
=
1.26
360.7+663.4/1101.6
=
0.93
Document Page
3
Current
Liabilities
Debt
ratio
Total
debt/ total
assets
1701.6/4302.2=
0.395
1792.3/4489.9=
0.399
2081.4/5233.3=
0.397
Cash cycles
A measure of how Boral limited converts its products into cash through its daily sales and is
measured through inventory, receivables and payables and back to the cash again.
a) Inventory being Current Inventory / Operating Revenue * 365 =
2016=413.65/3197.6*365= 47.22
2015=411.66/3289.8*365= 45.67
2014=497.15/4194.03*365= 43.26
b) Accounts payables being Creditors / Operating Revenue * 365 =
2016= 450.87/3197.6*365 =51.46
2015=491.06/3289.8*365 = 54.48
Document Page
4
2014=610.49/4194.03*365 = 53.13
c) Accounts Receivables being Debtors / Operating Revenue * 365 =
2014=663.4/4194.03*365 = 57.73
2015=504.77/3289.8*365 = 56
2016=462.67/3197.6*365 = 52.81
Cash conversion cycle= inventory + receivables-Payables
2016= 47.22+ 52.81-51.46 = 48.57 days
2015= 45.67+ 56-54.48 = 47.19 days
2014= 43.26+ 57.73- 53.13 = 47.86 days
Need and Usefulness of Financial Ratios
There are different financial reasons to meet the needs of users. Each of these reasons has certain
purposes. The following are examples of the most typical financial ratios used by different
stakeholders (Balasundaram, 2012).
The elements that limit and make difficult the financial analysis are those of accounting type,
such as the comparison of the financial statements, the reconstruction of the accounting concepts,
the reclassification of the items according to short and long term temporal criteria, the lack of
tabler-icon-diamond-filled.svg

Secure Best Marks with AI Grader

Need help grading? Try our AI Grader for instant feedback on your assignments.
Document Page
5
Information in terms of average values, imprecision and reformulation of concepts, window
dressing effect, among others (Lead With Cash, 2010).
On the other hand, we take into account that the valuation of the financial analyst in seeking to
obtain information for the setting of investment and financing criteria in a market or sector that
presents inflationary problems, causes the analysis to develop with distorted figures, that even if
they are repressed By any method, there are substantial differences in valuation and significant
disagreements over whether they are restated through the maintenance of financial capital or
physical capital (Sagner, n.d.).
In an interesting work, this indicates that financial analysis, although irreplaceable to learn from
the past, is nevertheless insufficient in itself for real decision-making, since experience has
shown that situations of the past are not perpetuated. In addition, this researcher adds that the
analysis of changes in the relative value of the different elements of the financial statements is
ineffective if there are conceptual and technical problems (Vinturella and Erickson, n.d.). Hence
we approach this type of problem to obtain a greater scope in our conclusions.
Limitations
Another common limitation is the dispersion of the data, since it is usually only possible to use a
measure of central tendency as the average of the sector and this is insufficient. That is why
financial analysis currently includes two very important types of techniques in its new structure:
decomposition measures and statistical classification models.
The first statistical technique allows the analyst to determine how the elements of a structure are
Document Page
6
distributed to analyze the changes that occur over time in the structure. These decomposition
measures are based on the analysis of the amount of accounting information. The application of
decomposition measures within the analysis of the financial statements is an opportunity to know
if the company maintains its structure stable over time, or to be able to locate its weaknesses in
relation to its sector (Sagner, n.d.).
CSR ltd
CSR ltd is a listed company in the ASX that produces building materials and products. It was
founded in 1855 as a colonial sugar refining company. In this report, we shall analyze certain
ratios of this company and compare it with Boral ltd, a company that is in the same building
industry and compare how the two companies are doing in relation to one another (Wingard-
Nelson, 2012). The ratios show that the company is performing well as its ratios fall within what
the optimal ratios should be.
RATI
O
FORMULAE 2014(millions) 2015(millions) 2016(millions)
Net
profit
margin
Net income/Net
sales
99.1/511.4=0.194 146.7/654.5=0.224 169.3/771.5=0.219
Asset Sales /Total 1746.6/2008.3=0. 2023.4/2119.3=0.95 2298.8/2215.8=1.03
Document Page
7
turnov
er
Assets 869 5
Curren
t ratio
Current Assets/
Current Liabilities
635.5/425.2=1.49 704.9/466.3=1.51 785.7/488.8=1.61
Quick
Ratio
(Cash+Accounts
Receivables)/Curr
ent Liabilities
(5.9+54)/
425.2=0.14
(68.4+51.4)/
466.3=0.26
(73.1+319.6)/
488.8=0.81
Debt
Ratio
Total Debt/ Total
Assets
851.1/2008.8=0.4
2
913.3/2119.3=0.43 898.6/2215.8=0.41
Cash cycles
This is a metric that is used to measure a company’s management effectiveness and the overall
health of the company (Wingard-Nelson, 2012). It measures how fast cash in hand can be
converted into accounts payable and inventory, through accounts receivable and sales and then
back into cash.
a) =
tabler-icon-diamond-filled.svg

Paraphrase This Document

Need a fresh take? Get an instant paraphrase of this document with our AI Paraphraser
Document Page
8
2014 2015 2016
Inventory
being Current
Inventory /
Operating
Revenue *
365
(326.4+66.1)/
511.4*365=280 days
(320+76.2)/
654.5*365=220days
(348.8+72.7)/
771.5*365=199days
Accounts
Receivable
sbeing
Debtors /
Operating
Revenue *
365
(251.1+54)/
511.4*365=217.7
days
(268.7+51.4)/
654.5*365=178.5days
(319.6+51.3)/
771.5*365=175.5days
Account
sPayables
being
Creditors /
Operating
Revenue *
365
(195+5.4)/
511.4*365=143 days
(236.8+16.3)/
654.5*365=141.1days
(260.6+18.9)/
771.5*365=132.2days
Cash 355 days 257 days 243 days
Document Page
9
conversion
cycle=
This company should work towards reducing its cash conversion cycle days.
Document Page
10
References
Allman, K. and Escobar de Nogales, X. (2015). Impact investment. Hoboken, NJ: Wiley.
Balasundaram, N. (2012). Ratio analysis. [Place of publication not identified]: Lap Lambert
Academic Publ.
Lead With Cash. (2010). World Scientific.
Sagner, J. (n.d.). Working capital management.
Schmidlin, N. (2014). The art of company valuation and financial statement analysis.
Chichester: John Wiley & Sons.
Vinturella, J. and Erickson, S. (n.d.). Raising entrepreneurial capital.
Wingard-Nelson, R. (2012). Percents and ratios. Berkeley Heights, NJ: Enslow Publishers.
chevron_up_icon
1 out of 10
circle_padding
hide_on_mobile
zoom_out_icon
logo.png

Your All-in-One AI-Powered Toolkit for Academic Success.

Available 24*7 on WhatsApp / Email

[object Object]