Financial Ratio Analysis Report for Brown Electronics - Accounting

Verified

Added on  2022/08/25

|5
|700
|111
Homework Assignment
AI Summary
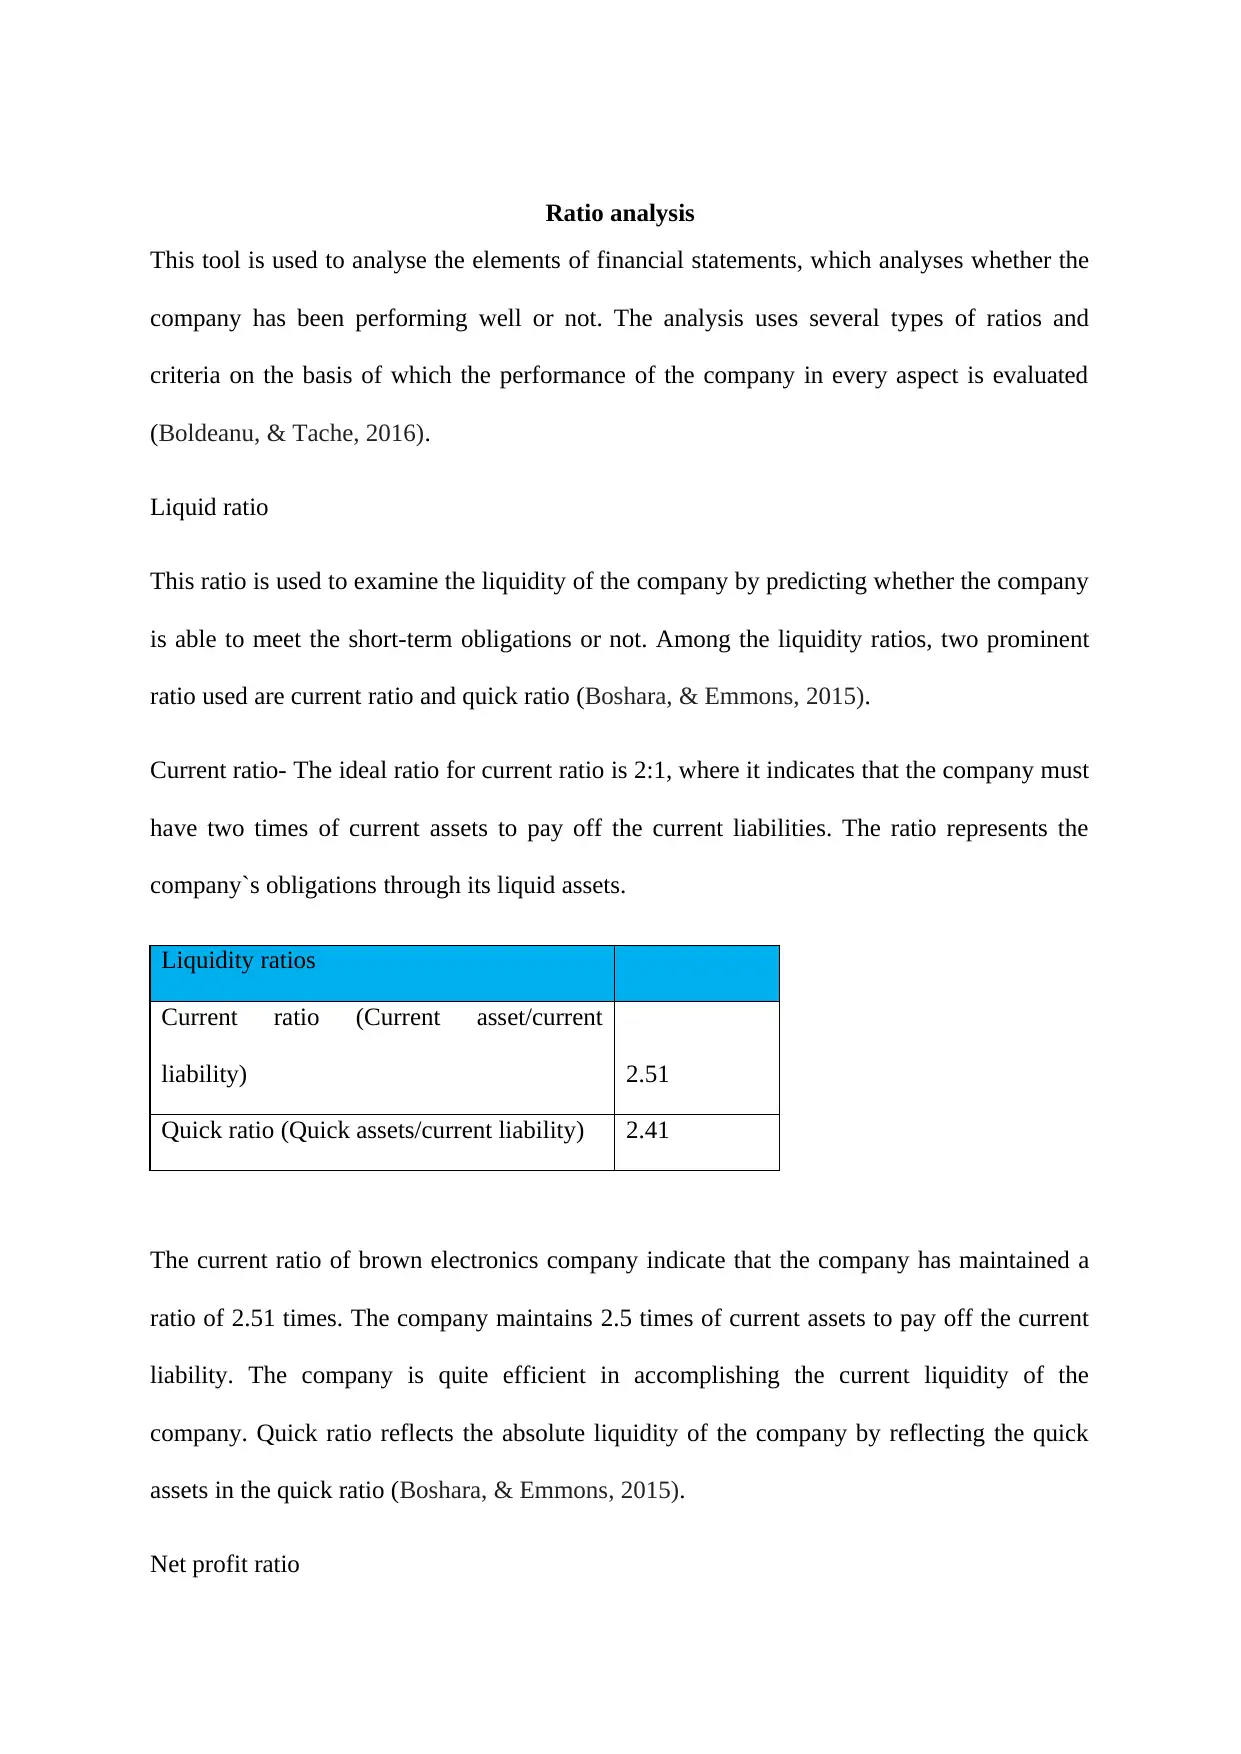
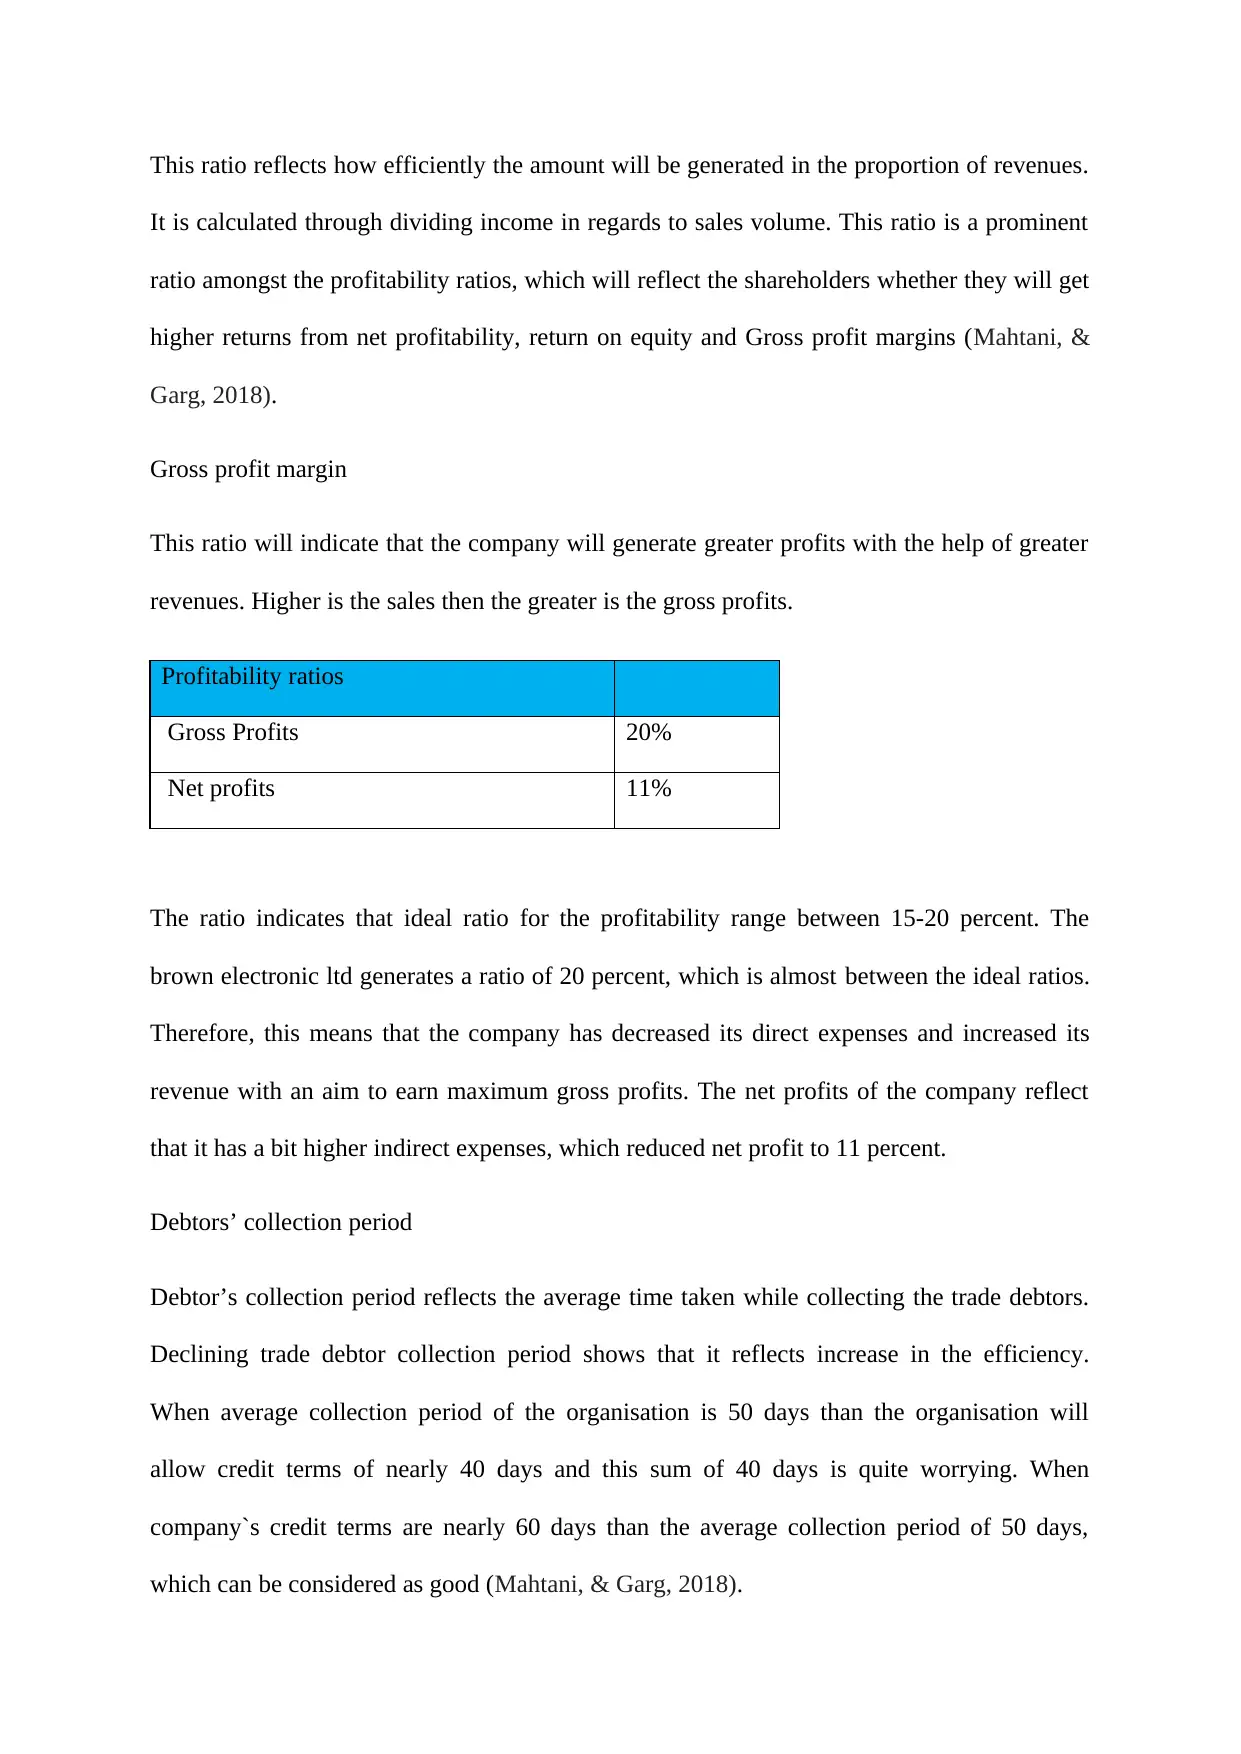
This document presents a comprehensive ratio analysis of Brown Electronics, evaluating the company's financial performance. It begins with an overview of ratio analysis as a tool for assessing financial statements, explaining the use of various ratios to determine a company's performance. The analysis includes the calculation and interpretation of liquidity ratios such as the current and quick ratios, assessing the company's ability to meet short-term obligations. Profitability ratios, including gross profit margin and net profit, are also examined to evaluate the efficiency of revenue generation. Additionally, the document discusses the debtors' collection period, providing insights into the efficiency of collecting trade debtors. The provided solution references key financial concepts and relevant literature, demonstrating a strong understanding of financial analysis techniques. The assignment also includes an incomplete records problem where transactions are recorded in relevant books.
Document Page
Accounting
[Document subtitle]
System04099
[Company name]
[Company address]
[DATE]
tabler-icon-diamond-filled.svg

Paraphrase This Document

Need a fresh take? Get an instant paraphrase of this document with our AI Paraphraser
Document Page
Ratio analysis
This tool is used to analyse the elements of financial statements, which analyses whether the
company has been performing well or not. The analysis uses several types of ratios and
criteria on the basis of which the performance of the company in every aspect is evaluated
(Boldeanu, & Tache, 2016).
Liquid ratio
This ratio is used to examine the liquidity of the company by predicting whether the company
is able to meet the short-term obligations or not. Among the liquidity ratios, two prominent
ratio used are current ratio and quick ratio (Boshara, & Emmons, 2015).
Current ratio- The ideal ratio for current ratio is 2:1, where it indicates that the company must
have two times of current assets to pay off the current liabilities. The ratio represents the
company`s obligations through its liquid assets.
Liquidity ratios
Current ratio (Current asset/current
liability) 2.51
Quick ratio (Quick assets/current liability) 2.41
The current ratio of brown electronics company indicate that the company has maintained a
ratio of 2.51 times. The company maintains 2.5 times of current assets to pay off the current
liability. The company is quite efficient in accomplishing the current liquidity of the
company. Quick ratio reflects the absolute liquidity of the company by reflecting the quick
assets in the quick ratio (Boshara, & Emmons, 2015).
Net profit ratio
Document Page
This ratio reflects how efficiently the amount will be generated in the proportion of revenues.
It is calculated through dividing income in regards to sales volume. This ratio is a prominent
ratio amongst the profitability ratios, which will reflect the shareholders whether they will get
higher returns from net profitability, return on equity and Gross profit margins (Mahtani, &
Garg, 2018).
Gross profit margin
This ratio will indicate that the company will generate greater profits with the help of greater
revenues. Higher is the sales then the greater is the gross profits.
Profitability ratios
Gross Profits 20%
Net profits 11%
The ratio indicates that ideal ratio for the profitability range between 15-20 percent. The
brown electronic ltd generates a ratio of 20 percent, which is almost between the ideal ratios.
Therefore, this means that the company has decreased its direct expenses and increased its
revenue with an aim to earn maximum gross profits. The net profits of the company reflect
that it has a bit higher indirect expenses, which reduced net profit to 11 percent.
Debtors’ collection period
Debtor’s collection period reflects the average time taken while collecting the trade debtors.
Declining trade debtor collection period shows that it reflects increase in the efficiency.
When average collection period of the organisation is 50 days than the organisation will
allow credit terms of nearly 40 days and this sum of 40 days is quite worrying. When
company`s credit terms are nearly 60 days than the average collection period of 50 days,
which can be considered as good (Mahtani, & Garg, 2018).
Document Page
tabler-icon-diamond-filled.svg

Paraphrase This Document

Need a fresh take? Get an instant paraphrase of this document with our AI Paraphraser
Document Page
References
Boldeanu, F. T., & Tache, I. (2016). The financial system of the EU and the Capital Markets
Union. European Research Studies, 19(1), 59.
Boshara, R., & Emmons, W. R. (2015). A balance sheet perspective on financial success:
Why starting early matters. Journal of Consumer Affairs, 49(1), 267-298.
Mahtani, U. S., & Garg, C. P. (2018). An analysis of key factors of financial distress in
airline companies in India using fuzzy AHP framework. Transportation Research
Part A: Policy and Practice, 117, 87-102.
chevron_up_icon
1 out of 5
circle_padding
hide_on_mobile
zoom_out_icon
[object Object]