Business Research: Financial Ratio Analysis of Two Companies
VerifiedAdded on 2020/02/03
|11
|1795
|56
Report
AI Summary
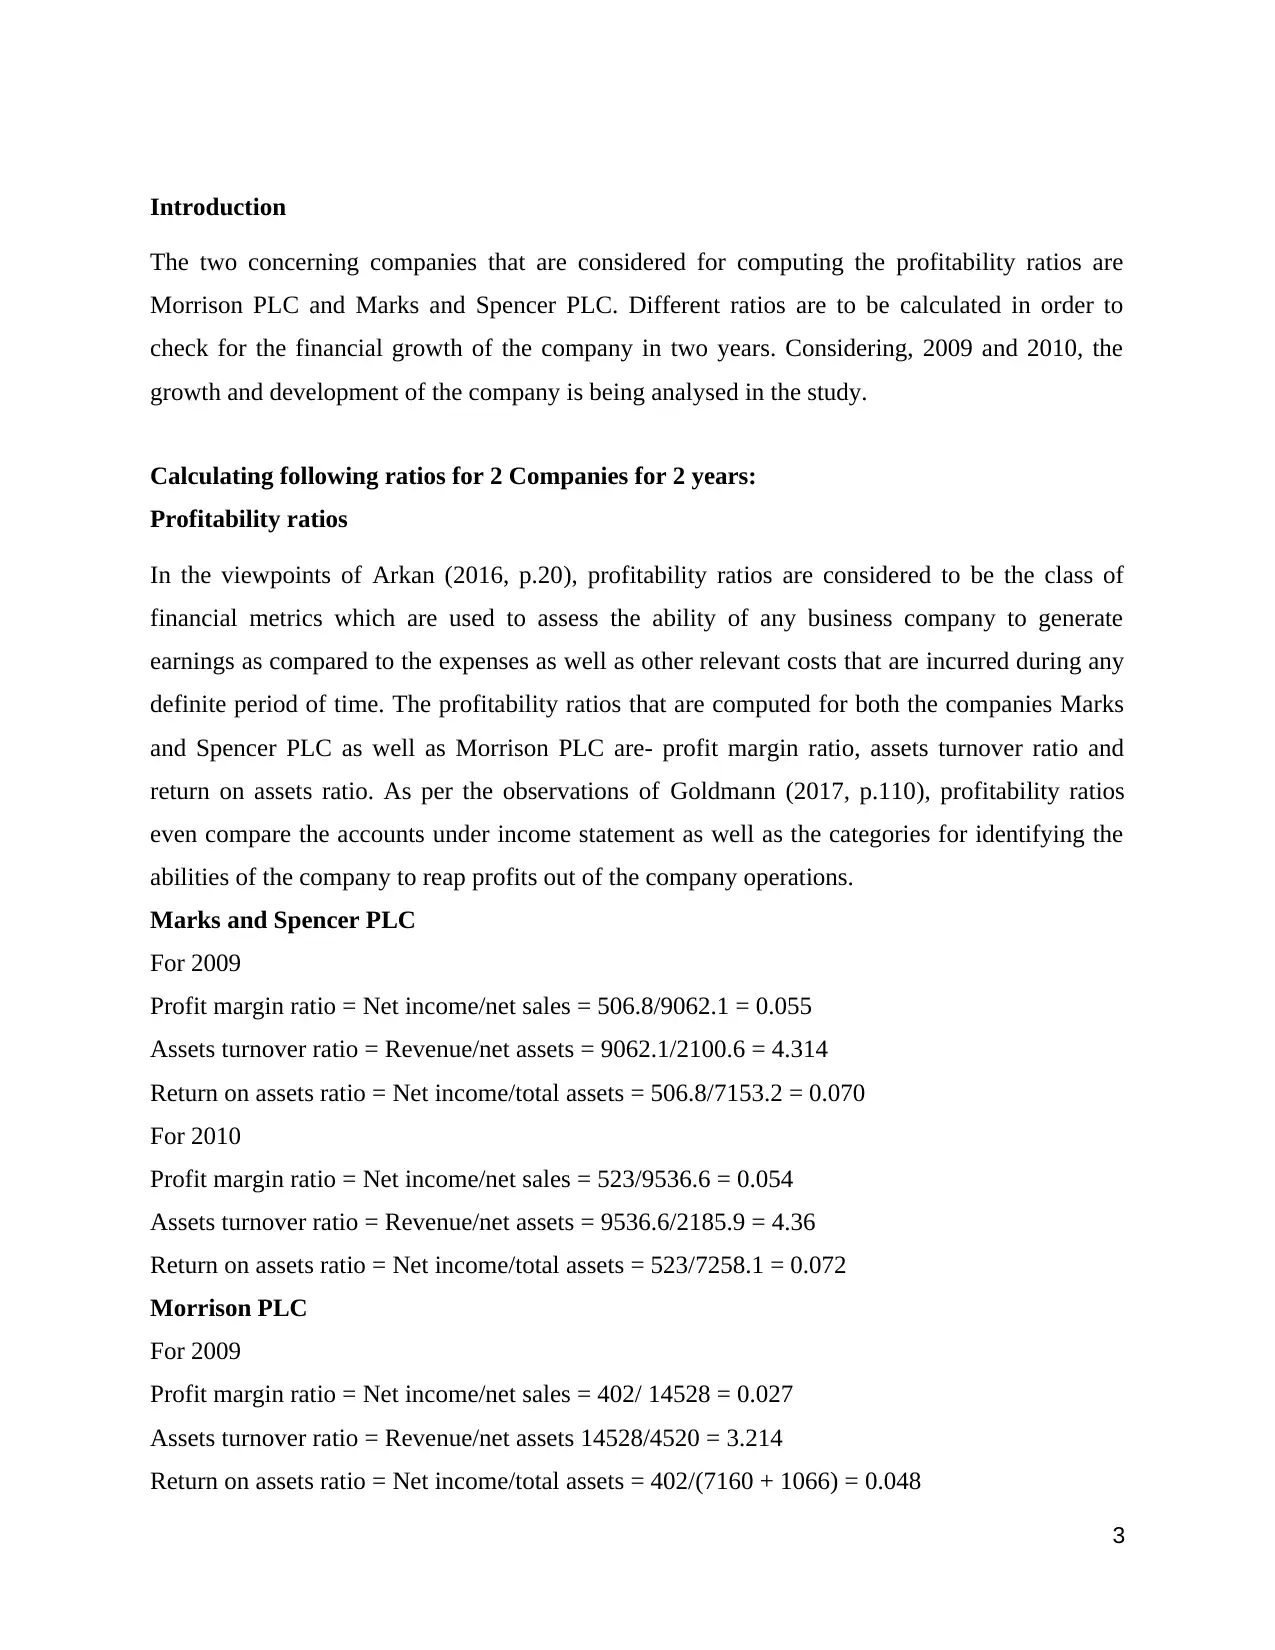
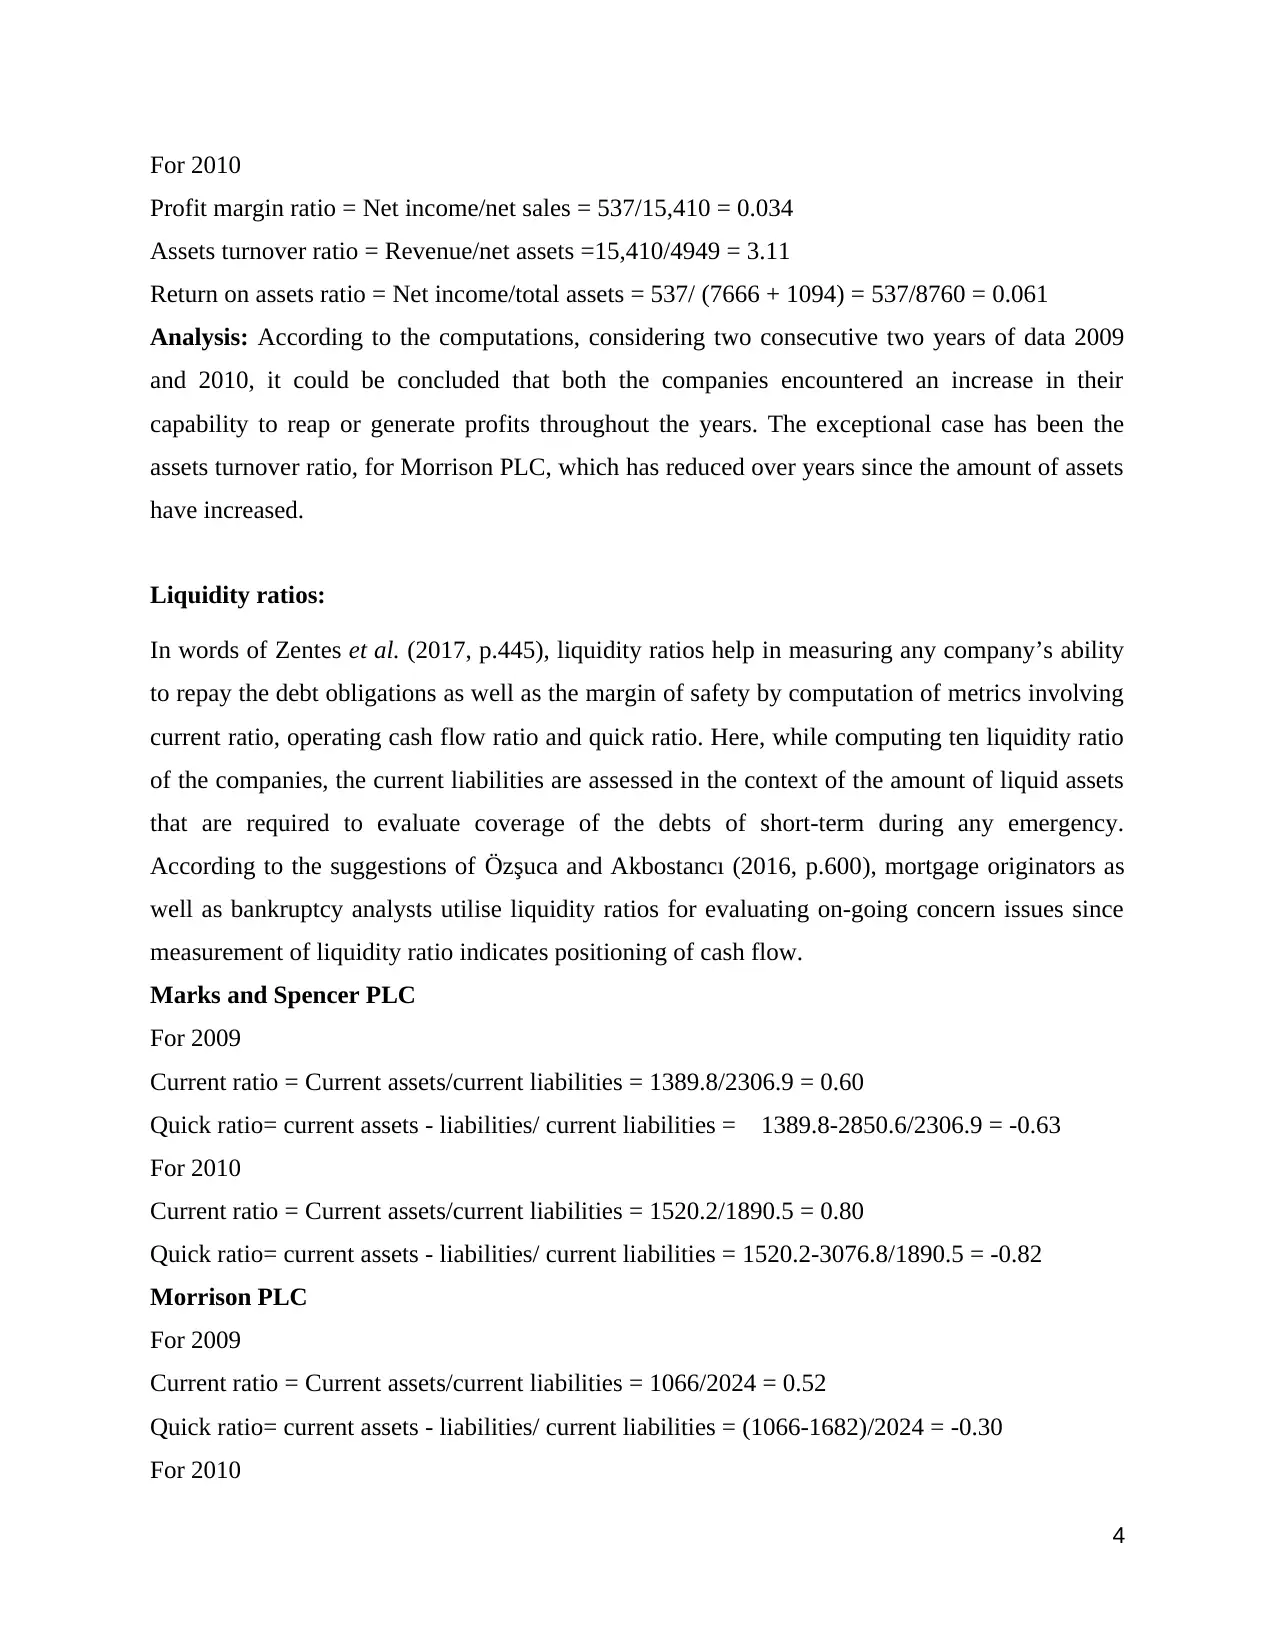
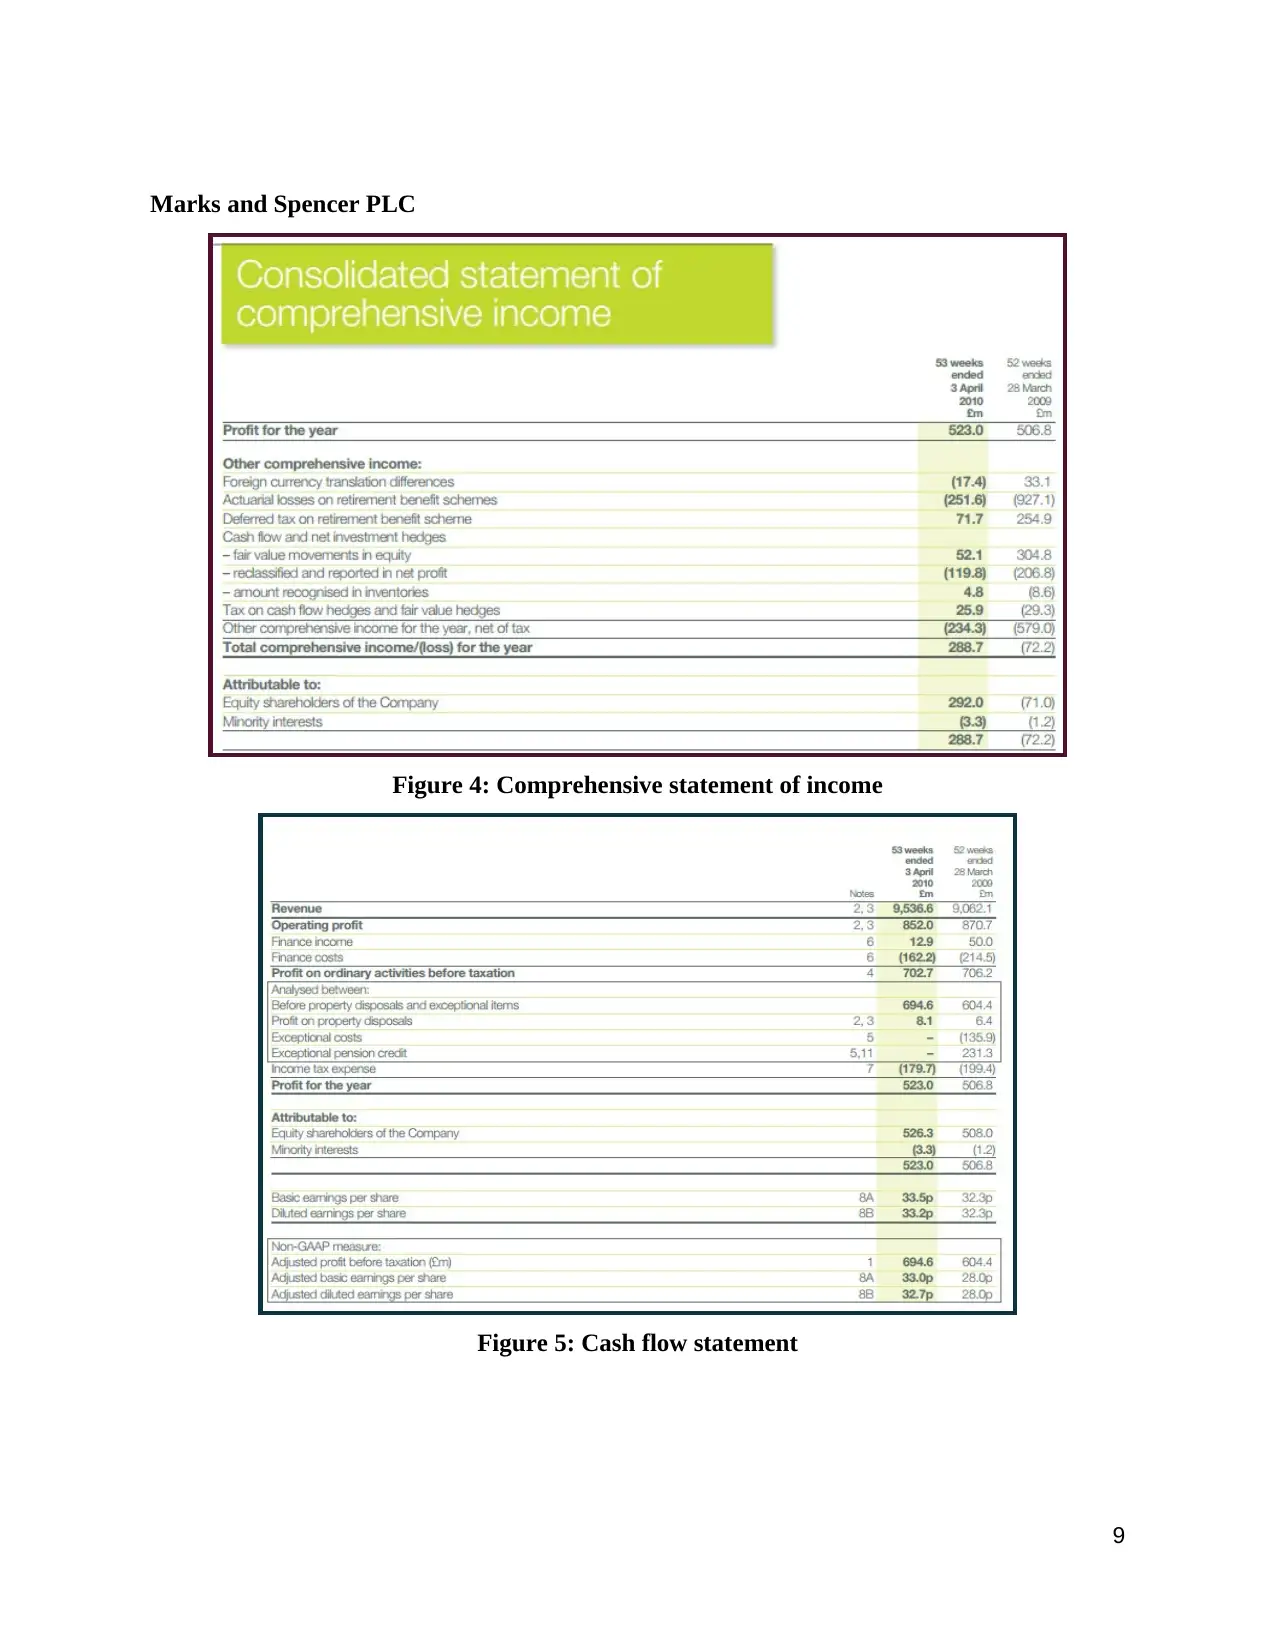
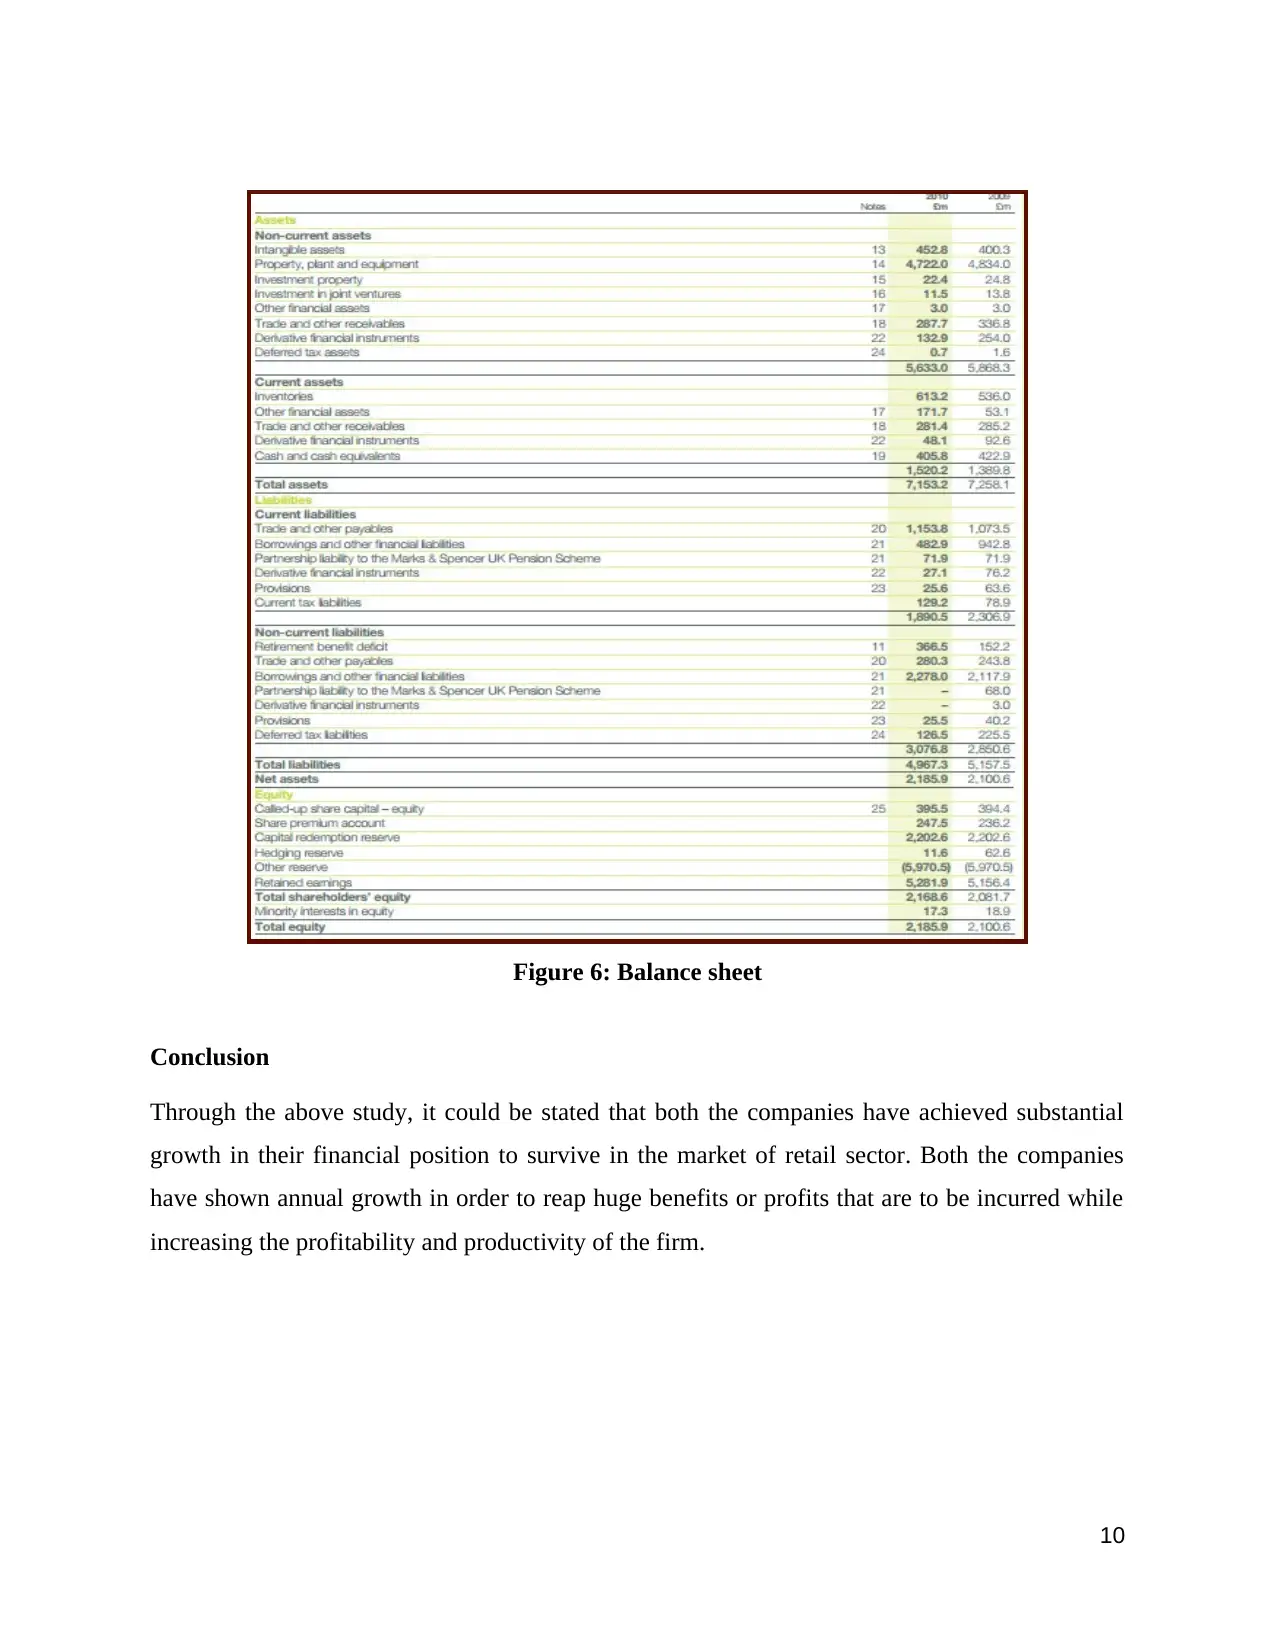
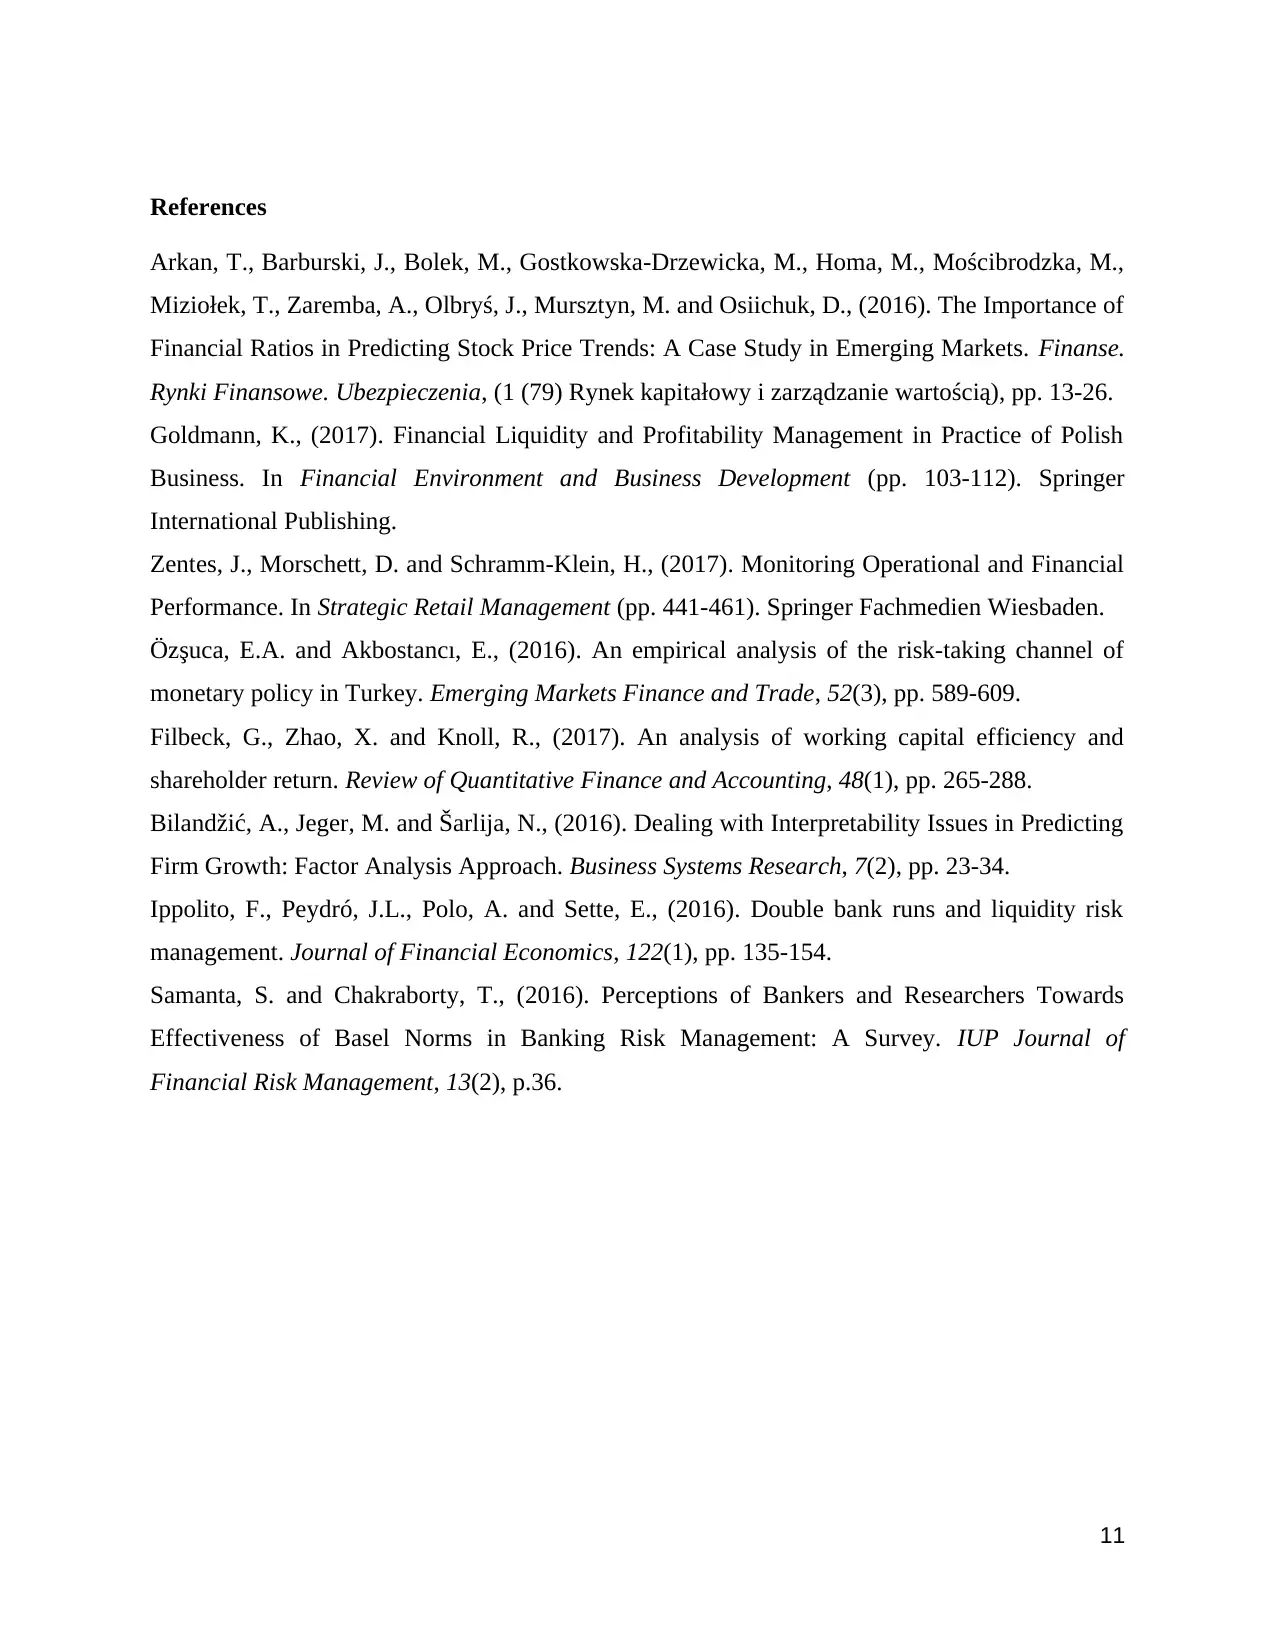
This report presents a financial ratio analysis of Morrison PLC and Marks & Spencer PLC, focusing on their performance between 2009 and 2010. The analysis encompasses profitability ratios (profit margin, asset turnover, return on assets), liquidity ratios (current and quick ratios), and working capital ratios. The report calculates these ratios, interprets the results, and discusses the companies' financial health and efficiency. Additionally, the report includes an examination of cash flow statements for both companies, providing a comprehensive overview of their financial positions and trends. The findings indicate changes in profitability, liquidity, and working capital management over the specified period, offering insights into each company's financial strategies and overall market performance.

BUSINESS RESEARCH AND DECISION MAKING
1
1
Paraphrase This Document
Need a fresh take? Get an instant paraphrase of this document with our AI Paraphraser

Table of Contents
Introduction......................................................................................................................................3
Calculating following ratios for 2 Companies for 2 years:..............................................................3
Profitability ratios............................................................................................................................3
Liquidity ratios:...............................................................................................................................4
Working capital ratios:....................................................................................................................5
Cash flow statement:........................................................................................................................6
Conclusion.....................................................................................................................................10
References......................................................................................................................................11
2

Introduction
The two concerning companies that are considered for computing the profitability ratios are
Morrison PLC and Marks and Spencer PLC. Different ratios are to be calculated in order to
check for the financial growth of the company in two years. Considering, 2009 and 2010, the
growth and development of the company is being analysed in the study.
Calculating following ratios for 2 Companies for 2 years:
Profitability ratios
In the viewpoints of Arkan (2016, p.20), profitability ratios are considered to be the class of
financial metrics which are used to assess the ability of any business company to generate
earnings as compared to the expenses as well as other relevant costs that are incurred during any
definite period of time. The profitability ratios that are computed for both the companies Marks
and Spencer PLC as well as Morrison PLC are- profit margin ratio, assets turnover ratio and
return on assets ratio. As per the observations of Goldmann (2017, p.110), profitability ratios
even compare the accounts under income statement as well as the categories for identifying the
abilities of the company to reap profits out of the company operations.
Marks and Spencer PLC
For 2009
Profit margin ratio = Net income/net sales = 506.8/9062.1 = 0.055
Assets turnover ratio = Revenue/net assets = 9062.1/2100.6 = 4.314
Return on assets ratio = Net income/total assets = 506.8/7153.2 = 0.070
For 2010
Profit margin ratio = Net income/net sales = 523/9536.6 = 0.054
Assets turnover ratio = Revenue/net assets = 9536.6/2185.9 = 4.36
Return on assets ratio = Net income/total assets = 523/7258.1 = 0.072
Morrison PLC
For 2009
Profit margin ratio = Net income/net sales = 402/ 14528 = 0.027
Assets turnover ratio = Revenue/net assets 14528/4520 = 3.214
Return on assets ratio = Net income/total assets = 402/(7160 + 1066) = 0.048
3
⊘ This is a preview!⊘
Do you want full access?
Subscribe today to unlock all pages.

Trusted by 1+ million students worldwide

For 2010
Profit margin ratio = Net income/net sales = 537/15,410 = 0.034
Assets turnover ratio = Revenue/net assets =15,410/4949 = 3.11
Return on assets ratio = Net income/total assets = 537/ (7666 + 1094) = 537/8760 = 0.061
Analysis: According to the computations, considering two consecutive two years of data 2009
and 2010, it could be concluded that both the companies encountered an increase in their
capability to reap or generate profits throughout the years. The exceptional case has been the
assets turnover ratio, for Morrison PLC, which has reduced over years since the amount of assets
have increased.
Liquidity ratios:
In words of Zentes et al. (2017, p.445), liquidity ratios help in measuring any company’s ability
to repay the debt obligations as well as the margin of safety by computation of metrics involving
current ratio, operating cash flow ratio and quick ratio. Here, while computing ten liquidity ratio
of the companies, the current liabilities are assessed in the context of the amount of liquid assets
that are required to evaluate coverage of the debts of short-term during any emergency.
According to the suggestions of Özşuca and Akbostancı (2016, p.600), mortgage originators as
well as bankruptcy analysts utilise liquidity ratios for evaluating on-going concern issues since
measurement of liquidity ratio indicates positioning of cash flow.
Marks and Spencer PLC
For 2009
Current ratio = Current assets/current liabilities = 1389.8/2306.9 = 0.60
Quick ratio= current assets - liabilities/ current liabilities = 1389.8-2850.6/2306.9 = -0.63
For 2010
Current ratio = Current assets/current liabilities = 1520.2/1890.5 = 0.80
Quick ratio= current assets - liabilities/ current liabilities = 1520.2-3076.8/1890.5 = -0.82
Morrison PLC
For 2009
Current ratio = Current assets/current liabilities = 1066/2024 = 0.52
Quick ratio= current assets - liabilities/ current liabilities = (1066-1682)/2024 = -0.30
For 2010
4
Paraphrase This Document
Need a fresh take? Get an instant paraphrase of this document with our AI Paraphraser

Current ratio = Current assets/current liabilities = 1094/2152 = 0.508
Quick ratio= current assets - liabilities/ current liabilities = (1094-1659)/2152 = -0.26
Analysis: There has been a substantial rise in the liquidity ratio as well determining the current
ratio, which states that the companies have a strong hold on possessing the liquidity which could
be utilised at the time of crisis or any repayment of bad debts or massive loan amount. On the
other hand, the quick ratio has subsequently reduced for Marks and Spencer’s PLC, whereas it
has increased in the case of Morrison PLC.
Working capital ratios:
As per the indications of Filbeck et al. (2017, p.270), working capital ratios are eventually
regarded as current ratio which is the relative proportion of current assets of any entity to the
current liabilities. It s also computed as it is intended to display ability of any business for paying
off its current liabilities with current assets. Working capital is referred to as both the company’s
efficiency as well its short term capital or financial health. In other words, as suggested by
Bilandžić et al. (2016, p.30), it is therefore, utilised to determine the company's financial position
through its hold of working or circulating capital within the company.
Marks and Spencer PLC
For 2009
Working capital ratios= current assets - receivables / current liabilities = 1389.8-285.2/2306.9 =
0.47
Stock turnover ratio = cost of goods sold/average inventory = 596.9/536= 1.16
Average stock = (opening + closing) /2
For 2010
Working capital ratios= current assets - receivables / current liabilities = 1520.2-281.4/1890.5 =
0.65
Stock turnover ratio = cost of goods sold/average inventory = 529.6/613.2= 0.86
Average stock = (opening + closing) /2
Morrison PLC
For 2009
Working capital ratio= current assets - receivables / current liabilities = 1066 - 29/2024 = 0.512
Stock turnover ratio = cost of goods sold/average inventory = 13615/494 = 27.56
5

Average stock = (opening + closing) /2
For 2010
Working capital ratio = Current assets - receivables /current liabilities = 1094 - 8/2152 = 0.504
Stock turnover ratio = cost of goods sold/average inventory = 14348/577 = 24.8
Average stock = (opening + closing) /2
Considering, Marks and Spencers PLC, the working capital ratio has increased whereas, the
stock turnover ratio has decreased which has led to ambiguous results. Whilst, concerning
Morrison PLC, it could be deduced that both the working capital ratio as well as the stock
turnover ratio has significantly reduced and hence the company did not held sufficient amount of
working capital in its financial base.
Cash flow statement:
In the notions of financial accounting, the cash flow statement is eventually regarded as the
statement of all cash flows within the company. As per the statements of Ippolito et al. (2016,
p.150), it is defined as a financial statement which shows the changes in accounts of balance
sheet along with effects of income on cash equivalents and cash. Cash flow statement breaks the
significance of the analysis down towards investing, operating and financial activities. According
to the opinions of Samanta and Chakraborty (2016, p.36), cash flow statement of the company is
distinct from balance sheet asd well as the income statement since it necessarily does not consist
of the total amount of outgoing and incoming cash of the future that is supposed to be recorded
as credit elements. Hwnce, cash is not identical to net income.
6
⊘ This is a preview!⊘
Do you want full access?
Subscribe today to unlock all pages.

Trusted by 1+ million students worldwide

Morrison PLC
Figure 1: Comprehensive income statement
Figure 2: Comprehensive balance sheet
7
Figure 1: Comprehensive income statement
Figure 2: Comprehensive balance sheet
7
Paraphrase This Document
Need a fresh take? Get an instant paraphrase of this document with our AI Paraphraser

Figure 3: Comprehensive cash flow statement
8
8

Marks and Spencer PLC
Figure 4: Comprehensive statement of income
Figure 5: Cash flow statement
9
Figure 4: Comprehensive statement of income
Figure 5: Cash flow statement
9
⊘ This is a preview!⊘
Do you want full access?
Subscribe today to unlock all pages.

Trusted by 1+ million students worldwide

Figure 6: Balance sheet
Conclusion
Through the above study, it could be stated that both the companies have achieved substantial
growth in their financial position to survive in the market of retail sector. Both the companies
have shown annual growth in order to reap huge benefits or profits that are to be incurred while
increasing the profitability and productivity of the firm.
10
Paraphrase This Document
Need a fresh take? Get an instant paraphrase of this document with our AI Paraphraser

References
Arkan, T., Barburski, J., Bolek, M., Gostkowska-Drzewicka, M., Homa, M., Mościbrodzka, M.,
Miziołek, T., Zaremba, A., Olbryś, J., Mursztyn, M. and Osiichuk, D., (2016). The Importance of
Financial Ratios in Predicting Stock Price Trends: A Case Study in Emerging Markets. Finanse.
Rynki Finansowe. Ubezpieczenia, (1 (79) Rynek kapitałowy i zarządzanie wartością), pp. 13-26.
Goldmann, K., (2017). Financial Liquidity and Profitability Management in Practice of Polish
Business. In Financial Environment and Business Development (pp. 103-112). Springer
International Publishing.
Zentes, J., Morschett, D. and Schramm-Klein, H., (2017). Monitoring Operational and Financial
Performance. In Strategic Retail Management (pp. 441-461). Springer Fachmedien Wiesbaden.
Özşuca, E.A. and Akbostancı, E., (2016). An empirical analysis of the risk-taking channel of
monetary policy in Turkey. Emerging Markets Finance and Trade, 52(3), pp. 589-609.
Filbeck, G., Zhao, X. and Knoll, R., (2017). An analysis of working capital efficiency and
shareholder return. Review of Quantitative Finance and Accounting, 48(1), pp. 265-288.
Bilandžić, A., Jeger, M. and Šarlija, N., (2016). Dealing with Interpretability Issues in Predicting
Firm Growth: Factor Analysis Approach. Business Systems Research, 7(2), pp. 23-34.
Ippolito, F., Peydró, J.L., Polo, A. and Sette, E., (2016). Double bank runs and liquidity risk
management. Journal of Financial Economics, 122(1), pp. 135-154.
Samanta, S. and Chakraborty, T., (2016). Perceptions of Bankers and Researchers Towards
Effectiveness of Basel Norms in Banking Risk Management: A Survey. IUP Journal of
Financial Risk Management, 13(2), p.36.
11
1 out of 11
Related Documents

Your All-in-One AI-Powered Toolkit for Academic Success.
+13062052269
info@desklib.com
Available 24*7 on WhatsApp / Email
Unlock your academic potential
Copyright © 2020–2025 A2Z Services. All Rights Reserved. Developed and managed by ZUCOL.