Accounting & Finance for Managers: Financial Ratio Analysis Report
VerifiedAdded on 2020/02/05
|18
|3708
|35
Report
AI Summary
This report presents a detailed financial ratio analysis comparing the performance of Next Plc and Hennes & Mauritz (H&M). It examines various financial ratios, including current ratio, asset turnover, inventory turnover, days sales in inventory, accounts receivable turnover, gross profit margin, operating margin, free cash flow per share, COGS/Revenue, and revenue per employee. The analysis covers both financial and non-financial ratios, such as staff turnover. The report evaluates the companies' liquidity, asset utilization, profitability, and efficiency, providing insights into their financial health and performance trends. Tables and illustrations are included to support the analysis. The report concludes with recommendations based on the comparative analysis of the two companies and discusses the limitations of using financial ratios for evaluation.

Accounting & Finance
for Managers
for Managers
Paraphrase This Document
Need a fresh take? Get an instant paraphrase of this document with our AI Paraphraser

Table of Contents
Introduction................................................................................................................................5
QUESTION 1.............................................................................................................................5
Question 2................................................................................................................................13
Conclusion................................................................................................................................17
references..................................................................................................................................18
Index of Tables
Table 1: Current ratio of two companies....................................................................................4
Table 2: Asset turnover ratio of two companies.........................................................................5
Table 3: Inventory turnover ratio of two companies..................................................................5
Table 4: Days of inventory of two companies...........................................................................6
Table 5: Receivables turnover ratio of two companies..............................................................6
Table 6: Gross profit margin of two companies.........................................................................6
Table 7: Operating profit margin................................................................................................7
Table 8: Free cash flow..............................................................................................................7
Table 9: COGS as percentage of revenue..................................................................................8
Table 10: Revenue per employee...............................................................................................8
Table 11: Staff turnover ratio of Next Plc..................................................................................8
Table 12: Staff turnover ratio of H&M......................................................................................9
Table 13: Estimated working days of Next Plc..........................................................................9
Table 14: Estimated working days lost of H&M.......................................................................9
Table 15: Liquidity position of Next Plc..................................................................................11
Table 16: Asset Utilization of Next Plc....................................................................................11
Table 17: Depreciation on machines........................................................................................12
Table 18: Depreciation on machines........................................................................................12
Table 19: Payback Period.........................................................................................................12
⊘ This is a preview!⊘
Do you want full access?
Subscribe today to unlock all pages.
Trusted by 1+ million students worldwide

Illustration Index
Illustration 1: ARR Method......................................................................................................14
Illustration 2: NPV Method......................................................................................................16
Illustration 1: ARR Method......................................................................................................14
Illustration 2: NPV Method......................................................................................................16
Paraphrase This Document
Need a fresh take? Get an instant paraphrase of this document with our AI Paraphraser
INTRODUCTION
Accounting is a concept that measures and evaluates the performance of
business organisation. Financial accounting analyse and report all business
transactions of the company. It involves preparation of many financial statements of
the organisations. The report provides an understanding of financial ratios of two
chosen companies. Further, it will provide recommendations on the financial
performance of those cite firms and also discuss the limitations of financial ratios.
QUESTION 1
Financial ratio is a magnitude that calculate and compares two values from
financial statements of the company. There are many standard ratios that are being
used to evaluate the financial state of the corporation. As per the provided case,
ratios of two companies namely; Next Plc and Hennes & Mauritz (H & M) are being
selected and justified to analyse the performance of the companies and also to
determine their financial positions. Analysing the financial and non-financial ratios of
two companies is given below:
Financial Ratios:
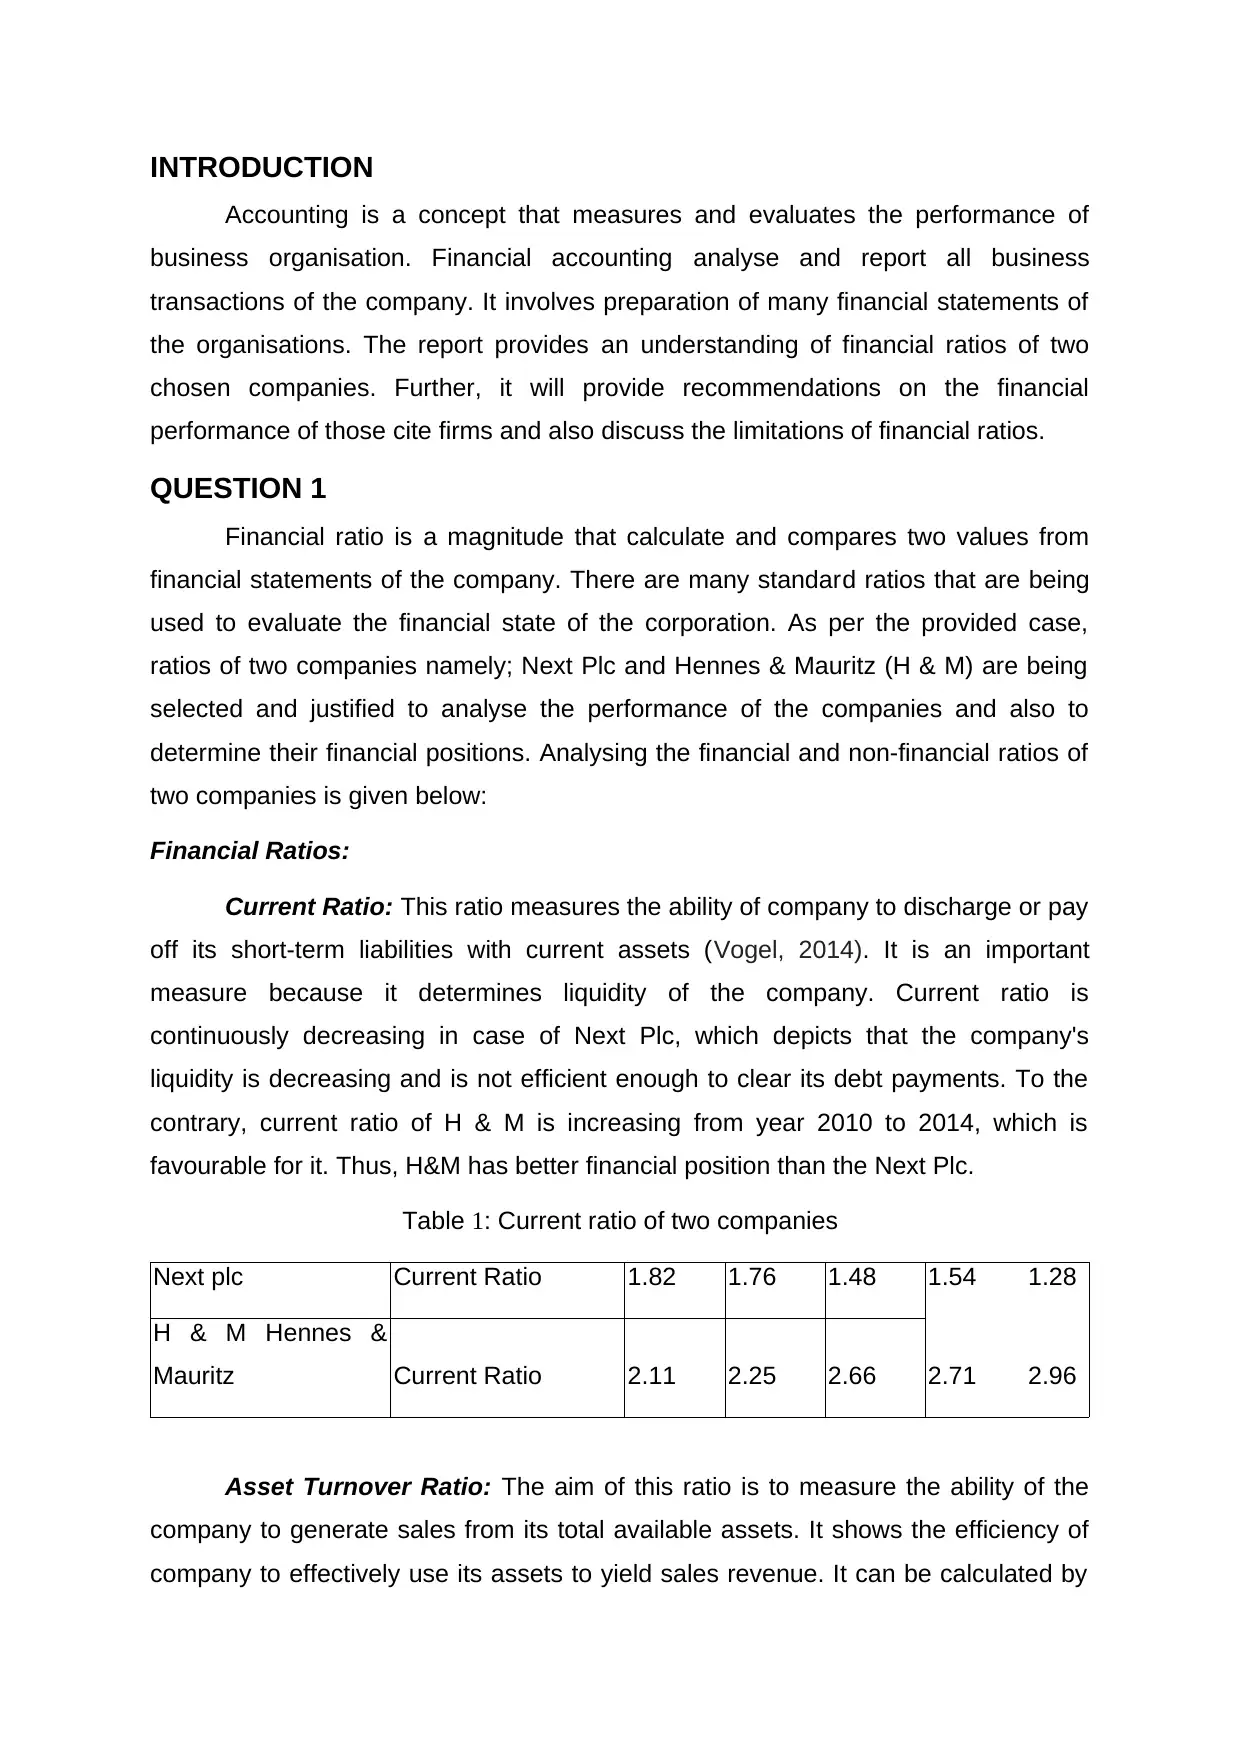
Current Ratio: This ratio measures the ability of company to discharge or pay
off its short-term liabilities with current assets (Vogel, 2014). It is an important
measure because it determines liquidity of the company. Current ratio is
continuously decreasing in case of Next Plc, which depicts that the company's
liquidity is decreasing and is not efficient enough to clear its debt payments. To the
contrary, current ratio of H & M is increasing from year 2010 to 2014, which is
favourable for it. Thus, H&M has better financial position than the Next Plc.
Table 1: Current ratio of two companies
Next plc Current Ratio 1.82 1.76 1.48 1.54 1.28
H & M Hennes &
Mauritz Current Ratio 2.11 2.25 2.66 2.71 2.96
Asset Turnover Ratio: The aim of this ratio is to measure the ability of the
company to generate sales from its total available assets. It shows the efficiency of
company to effectively use its assets to yield sales revenue. It can be calculated by
Accounting is a concept that measures and evaluates the performance of
business organisation. Financial accounting analyse and report all business
transactions of the company. It involves preparation of many financial statements of
the organisations. The report provides an understanding of financial ratios of two
chosen companies. Further, it will provide recommendations on the financial
performance of those cite firms and also discuss the limitations of financial ratios.
QUESTION 1
Financial ratio is a magnitude that calculate and compares two values from
financial statements of the company. There are many standard ratios that are being
used to evaluate the financial state of the corporation. As per the provided case,
ratios of two companies namely; Next Plc and Hennes & Mauritz (H & M) are being
selected and justified to analyse the performance of the companies and also to
determine their financial positions. Analysing the financial and non-financial ratios of
two companies is given below:
Financial Ratios:
Current Ratio: This ratio measures the ability of company to discharge or pay
off its short-term liabilities with current assets (Vogel, 2014). It is an important
measure because it determines liquidity of the company. Current ratio is
continuously decreasing in case of Next Plc, which depicts that the company's
liquidity is decreasing and is not efficient enough to clear its debt payments. To the
contrary, current ratio of H & M is increasing from year 2010 to 2014, which is
favourable for it. Thus, H&M has better financial position than the Next Plc.
Table 1: Current ratio of two companies
Next plc Current Ratio 1.82 1.76 1.48 1.54 1.28
H & M Hennes &
Mauritz Current Ratio 2.11 2.25 2.66 2.71 2.96
Asset Turnover Ratio: The aim of this ratio is to measure the ability of the
company to generate sales from its total available assets. It shows the efficiency of
company to effectively use its assets to yield sales revenue. It can be calculated by
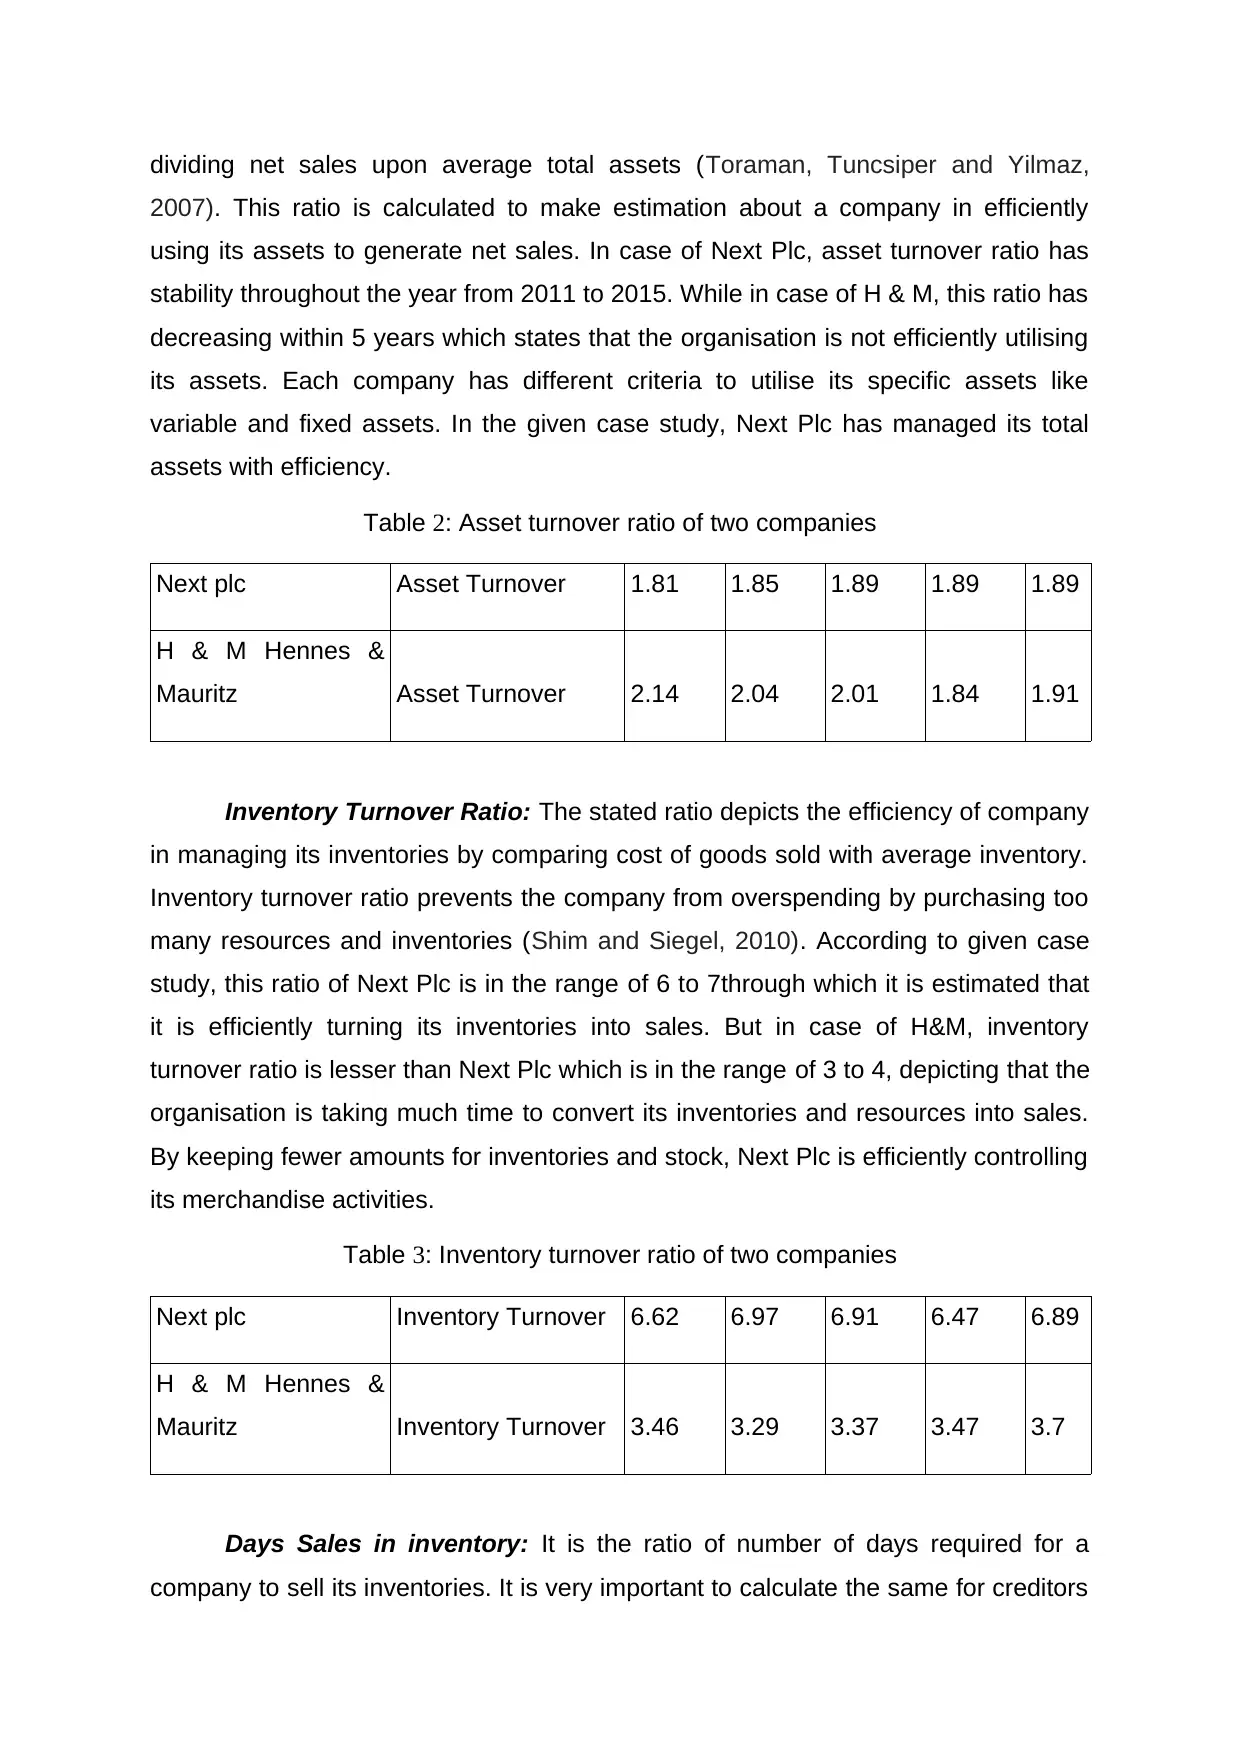
dividing net sales upon average total assets (Toraman, Tuncsiper and Yilmaz,
2007). This ratio is calculated to make estimation about a company in efficiently
using its assets to generate net sales. In case of Next Plc, asset turnover ratio has
stability throughout the year from 2011 to 2015. While in case of H & M, this ratio has
decreasing within 5 years which states that the organisation is not efficiently utilising
its assets. Each company has different criteria to utilise its specific assets like
variable and fixed assets. In the given case study, Next Plc has managed its total
assets with efficiency.
Table 2: Asset turnover ratio of two companies
Next plc Asset Turnover 1.81 1.85 1.89 1.89 1.89
H & M Hennes &
Mauritz Asset Turnover 2.14 2.04 2.01 1.84 1.91
Inventory Turnover Ratio: The stated ratio depicts the efficiency of company
in managing its inventories by comparing cost of goods sold with average inventory.
Inventory turnover ratio prevents the company from overspending by purchasing too
many resources and inventories (Shim and Siegel, 2010). According to given case
study, this ratio of Next Plc is in the range of 6 to 7through which it is estimated that
it is efficiently turning its inventories into sales. But in case of H&M, inventory
turnover ratio is lesser than Next Plc which is in the range of 3 to 4, depicting that the
organisation is taking much time to convert its inventories and resources into sales.
By keeping fewer amounts for inventories and stock, Next Plc is efficiently controlling
its merchandise activities.
Table 3: Inventory turnover ratio of two companies
Next plc Inventory Turnover 6.62 6.97 6.91 6.47 6.89
H & M Hennes &
Mauritz Inventory Turnover 3.46 3.29 3.37 3.47 3.7
Days Sales in inventory: It is the ratio of number of days required for a
company to sell its inventories. It is very important to calculate the same for creditors
⊘ This is a preview!⊘
Do you want full access?
Subscribe today to unlock all pages.
Trusted by 1+ million students worldwide
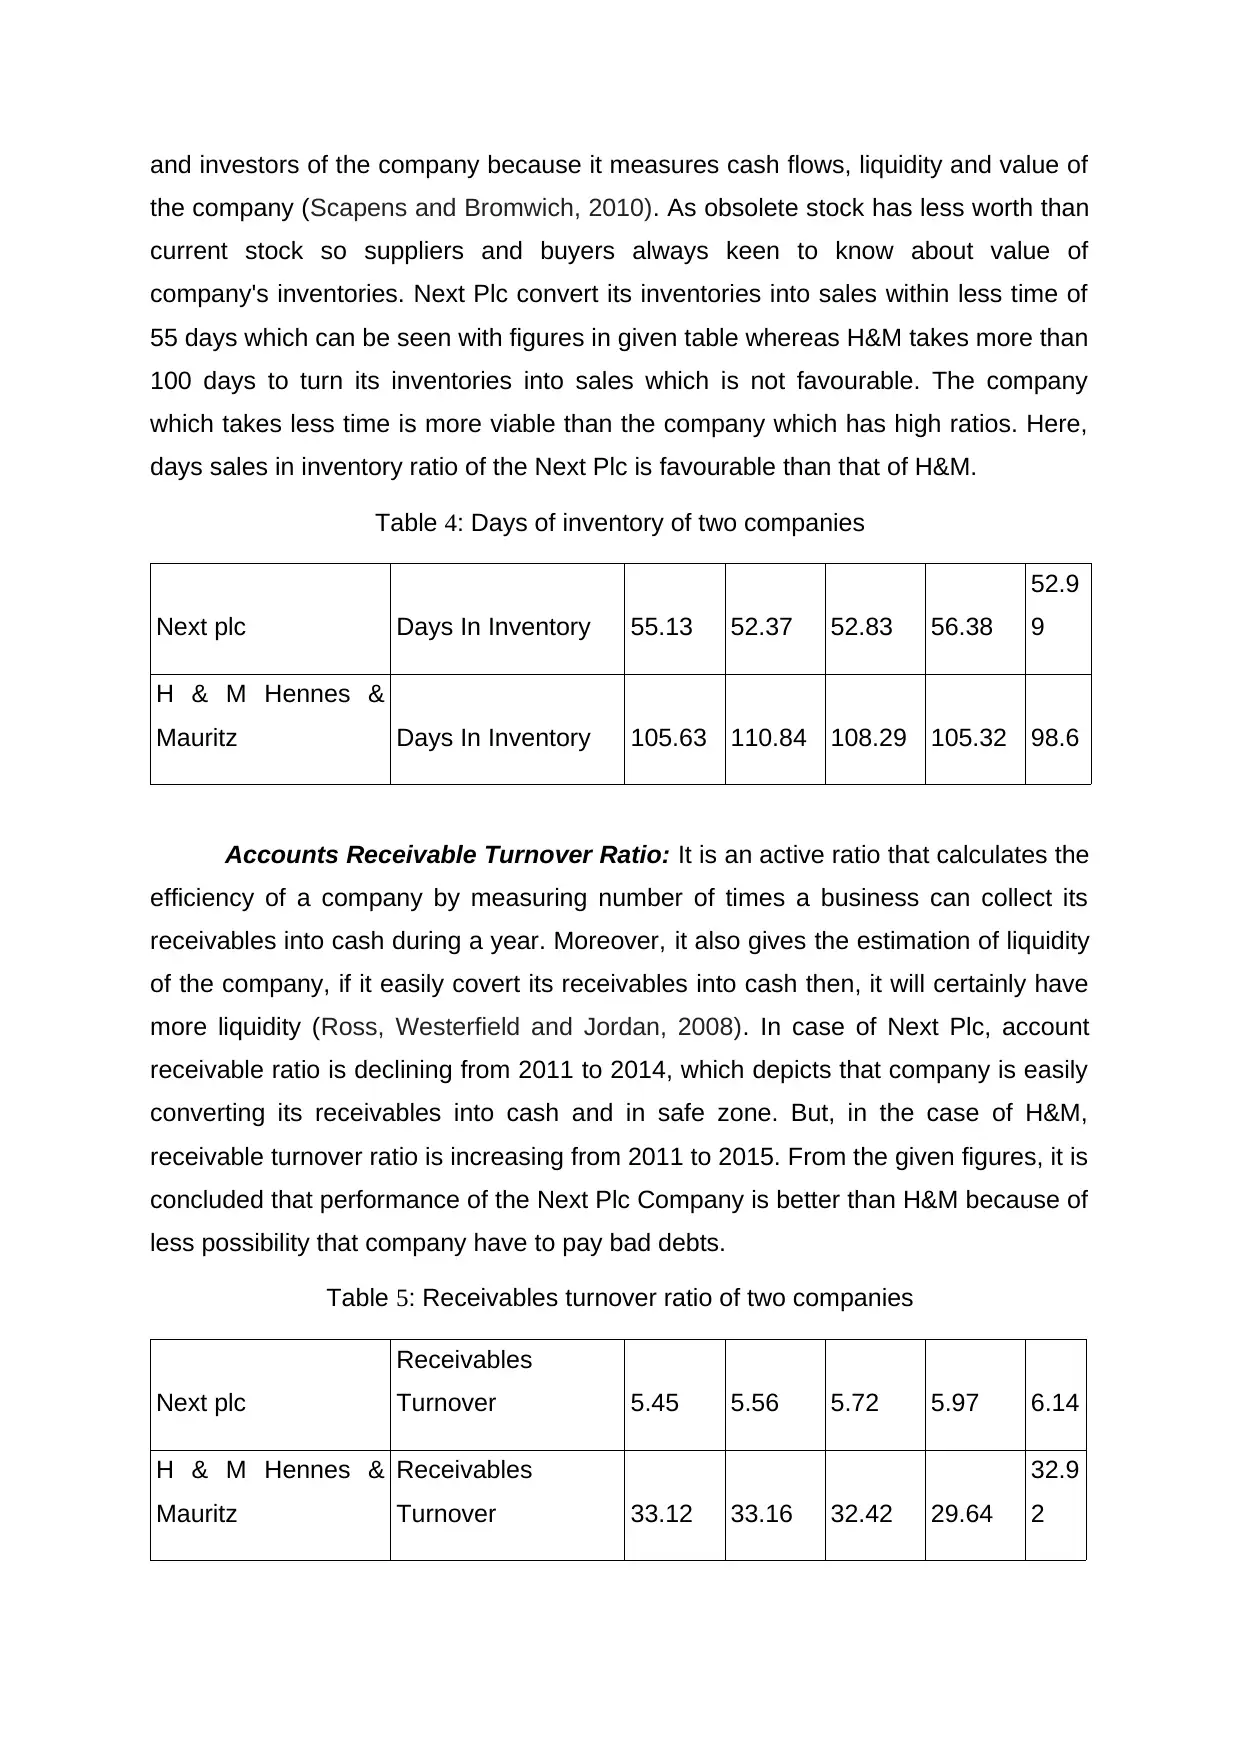
and investors of the company because it measures cash flows, liquidity and value of
the company (Scapens and Bromwich, 2010). As obsolete stock has less worth than
current stock so suppliers and buyers always keen to know about value of
company's inventories. Next Plc convert its inventories into sales within less time of
55 days which can be seen with figures in given table whereas H&M takes more than
100 days to turn its inventories into sales which is not favourable. The company
which takes less time is more viable than the company which has high ratios. Here,
days sales in inventory ratio of the Next Plc is favourable than that of H&M.
Table 4: Days of inventory of two companies
Next plc Days In Inventory 55.13 52.37 52.83 56.38
52.9
9
H & M Hennes &
Mauritz Days In Inventory 105.63 110.84 108.29 105.32 98.6
Accounts Receivable Turnover Ratio: It is an active ratio that calculates the
efficiency of a company by measuring number of times a business can collect its
receivables into cash during a year. Moreover, it also gives the estimation of liquidity
of the company, if it easily covert its receivables into cash then, it will certainly have
more liquidity (Ross, Westerfield and Jordan, 2008). In case of Next Plc, account
receivable ratio is declining from 2011 to 2014, which depicts that company is easily
converting its receivables into cash and in safe zone. But, in the case of H&M,
receivable turnover ratio is increasing from 2011 to 2015. From the given figures, it is
concluded that performance of the Next Plc Company is better than H&M because of
less possibility that company have to pay bad debts.
Table 5: Receivables turnover ratio of two companies
Next plc
Receivables
Turnover 5.45 5.56 5.72 5.97 6.14
H & M Hennes &
Mauritz
Receivables
Turnover 33.12 33.16 32.42 29.64
32.9
2
Paraphrase This Document
Need a fresh take? Get an instant paraphrase of this document with our AI Paraphraser
Gross Profit Margin Ratio: This cited ratio measures the profitability of a
company which is attained by selling its merchandise and inventories. This ratio
considers only cost of goods sold while calculating the profitability of sale. It can be
calculated by diving gross margin to net sales. This ratio of Next Plc is decreasing
every year which states that the company is not controlling its expenses efficiently
but in case of H&M, profit margin ratio is increasing. So, it can be justified that with
high profit margin, H&M will be able to earn more profits and easily control its direct
expenses.
Table 6: Gross profit margin of two companies
Next plc Gross Margin 33.59% 33.16% 31.48% 30.38%
29.2
7%
H & M Hennes &
Mauritz Gross Margin 58.81% 59.13% 59.50% 60.13%
62.9
3%
Operating Margin: Operating margin profit ratio calculates the percentage of
total revenue earned by a company by operating its overall income. Such that the
company which can easily left over a sum of money after paying-off its operating
cost to creditors and suppliers. As per the given table, operating margin of Next Plc
is continuously increasing which is not favourable for company. It means that the
company has effective control on its expenses whether in case of H&M, operating
margin is declining such that its direct expenses are not in control which is
favourable for company.
Table 7: Operating profit margin
Next plc Operating Margin 20.62% 19.33% 19.59% 17.67%
17.1
9%
H & M Hennes &
Mauritz AB Operating Margin 16.90% 17.18% 18.01% 18.53%
22.7
3%
Free Cash Flow/Share: It is a measure of an organisation's financial position
which is determined by dividing actual cash flow with total number of shareholders
present in the company (Phillips, 2009). In Next Plc, free cash flow is increasing from
year 2011 to 2013 but then it decreased in year 2014 which indicates that
shareholders of this company is getting less amount of sum. In comparison to Next
Plc, free cash flow of H&M is increasing but there are some variations in its
increasing pattern. As a result, it can be stated that H&M is performing better than
the Next Plc.
Table 8: Free cash flow
Next plc
Free Cash
Flow/Share 4.14 3.29 3.58 2.37 1.83
H & M Hennes &
Mauritz AB
Free Cash
Flow/Share 0.76 0.89 0.68 0.7 0.93
COGS/Revenue: This ratio measure the total revenue earned by a company
after spending in labour, material and overheads. There is inverse relationship
between profitability earn and sales of goods (Cost of Goods Sold – COGS. 2015).
From year 2011 to 2015 the COGS/Revenue ratio of Next Plc is increasing and in
case of H&M, this ratios is decreasing sharply. The company with high ratio state
that it is gaining less profits as compared to the company which has lower proportion
and attaining more profitability. So, it is concluded that H&M is performing well and
earning more profit rather than Next Plc.
Table 9: COGS as percentage of revenue
Next plc COGS/Revenue 66.41% 66.84% 68.52% 69.62%
70.7
3%
H & M Hennes &
Mauritz AB COGS/Revenue 41.19% 40.87% 40.50% 39.87%
37.0
7%
Revenue/Employee: It is the measure of profit earned by each employee of a
organisation. From given case study, it is predicted that in Next Plc number of
employees are increasing but profitability is not increasing but in case of H&M,
⊘ This is a preview!⊘
Do you want full access?
Subscribe today to unlock all pages.
Trusted by 1+ million students worldwide

employee turnover is deceasing which indicates that the company is focused to
increase its profitability. So, the performance of H&M is better.
Table 10: Revenue per employee
Next plc Revenue/Employee 135729 130916 125360 119962
114
727
H & M Hennes &
Mauritz AB Revenue/Employee 138467 147942 156151 159858
166
639
Non Financial Ratio
Table 11: Staff turnover ratio of Next Plc
1 2 3 4 5
Total staff 44287 46133 48055 50057 47562
Absenteeism 7300 9125 8030 8760 9855
Staff turnover ratio 0.16 0.20 0.17 0.18 0.21
Table 12: Staff turnover ratio of H&M
1 2 3 4 5
Total staff 47524 50026 50026 52659 55430
Absenteeism 8030 9855 10950 11680 12045
Staff turnover ratio 0.17 0.20 0.22 0.22 0.22
Recommendations: Staff Turnover Ratio measures the optimum utilization of a
company's manpower during a specific period. From above table, it is predicted that
employees turnover is more in H&M as compared to other company whereas in case
of Next Plc, staff turnover ratios is continuously declining within 5 years. So, The
Next Plc has better staff management and policies due to which employee's turnover
ratio is decreasing (Greenaway, Guariglia and Kneller, 2007)
Paraphrase This Document
Need a fresh take? Get an instant paraphrase of this document with our AI Paraphraser
Table 13: Estimated working days of Next Plc
1 2 3 4 5
Usual hours worked per
week 70 70 70 70 70
Average hours worked per
week 56 56 56 56 56
Working days lost 6 8 10 9 8
Estimated working days lost 7.5 10 12.5 11.25 10
Table 14: Estimated working days lost of H&M
1 2 3 4 5
Usual hours worked per
week 70 70 70 70 70
Average hours worked per
week 63 63 63 63 63
Working days lost 10 11 15 14 13
Estimated working days lost 11.1 12.2 16.7 15.6 14.4
Recommendations: Estimated working days lost is the number of days in which an
organisation doesn't get productivity through its employees. From above table it is
identified that H&M has high number of working days lost than Next Plc that is not
favourable for company.
2. Analysing the performance of two companies using charts
Chart of Gross Margin Ratio
1 2 3 4 5
Usual hours worked per
week 70 70 70 70 70
Average hours worked per
week 56 56 56 56 56
Working days lost 6 8 10 9 8
Estimated working days lost 7.5 10 12.5 11.25 10
Table 14: Estimated working days lost of H&M
1 2 3 4 5
Usual hours worked per
week 70 70 70 70 70
Average hours worked per
week 63 63 63 63 63
Working days lost 10 11 15 14 13
Estimated working days lost 11.1 12.2 16.7 15.6 14.4
Recommendations: Estimated working days lost is the number of days in which an
organisation doesn't get productivity through its employees. From above table it is
identified that H&M has high number of working days lost than Next Plc that is not
favourable for company.
2. Analysing the performance of two companies using charts
Chart of Gross Margin Ratio
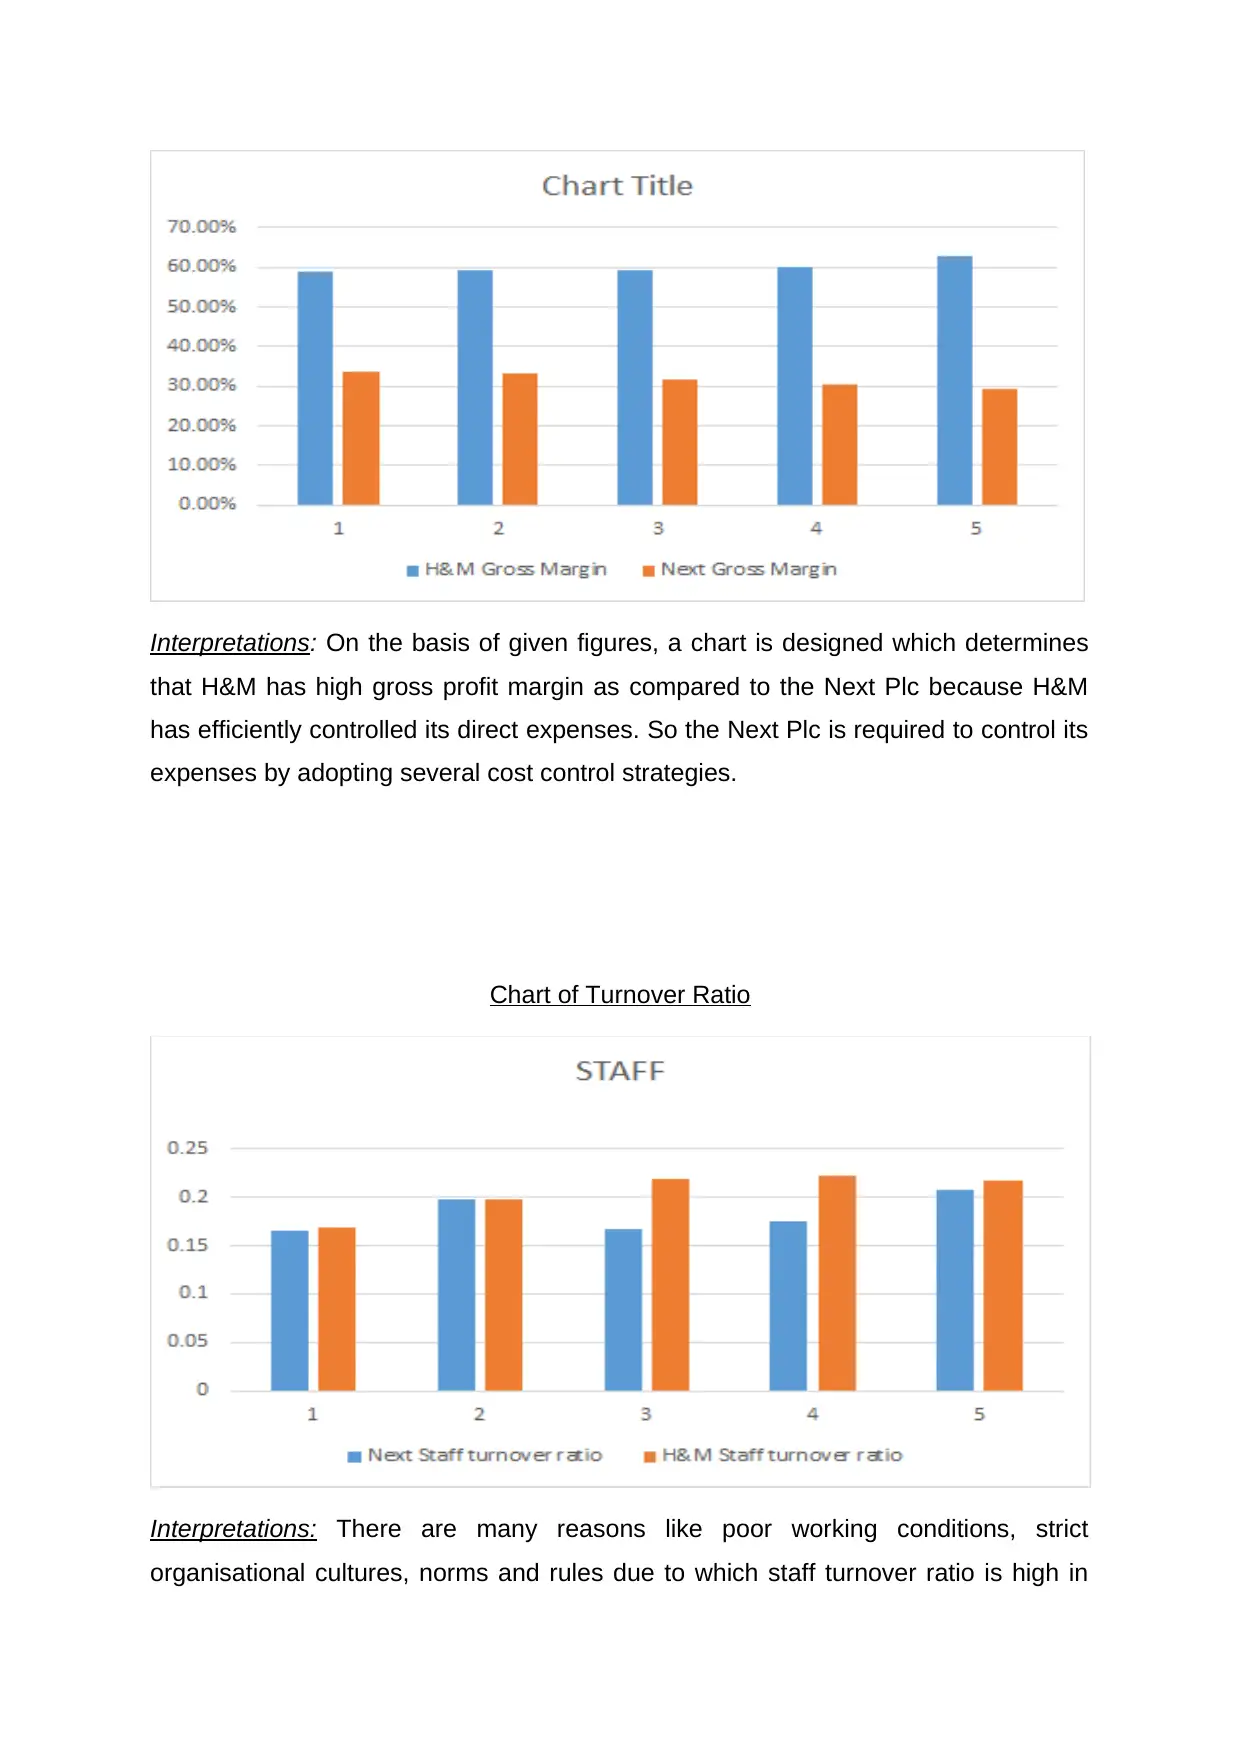
Interpretations: On the basis of given figures, a chart is designed which determines
that H&M has high gross profit margin as compared to the Next Plc because H&M
has efficiently controlled its direct expenses. So the Next Plc is required to control its
expenses by adopting several cost control strategies.
Chart of Turnover Ratio
Interpretations: There are many reasons like poor working conditions, strict
organisational cultures, norms and rules due to which staff turnover ratio is high in
⊘ This is a preview!⊘
Do you want full access?
Subscribe today to unlock all pages.
Trusted by 1+ million students worldwide
1 out of 18
Related Documents


Your All-in-One AI-Powered Toolkit for Academic Success.
+13062052269
info@desklib.com
Available 24*7 on WhatsApp / Email
![[object Object]](/_next/static/media/star-bottom.7253800d.svg)
Unlock your academic potential
Copyright © 2020–2026 A2Z Services. All Rights Reserved. Developed and managed by ZUCOL.