Financial Ratio Analysis Report: Liquidity, Stability, and Performance
VerifiedAdded on 2021/02/05
|12
|5485
|52
Report
AI Summary
This report provides a comprehensive analysis of financial ratios, crucial for assessing a business's financial health and performance. Task 1 focuses on financial ratios, explaining their significance for various stakeholders such as management, competitors, and investors. It covers key financial statements like the balance sheet, cash flow statement, and profit and loss account, highlighting the importance of liquidity, inventory management, and the distinction between current and non-current assets. The report also discusses wealth monitoring using ratios and the application of spreadsheets in financial analysis. Task 2 delves into financial stability and performance, particularly liquidity ratios. It differentiates between structural and operational liquidity and explains the use of current and quick ratios in assessing a company's ability to meet short-term obligations. The report offers insights into how these ratios are calculated and interpreted, providing a valuable resource for understanding financial statements and making informed business decisions.
Task 1 – Financial ratios
SUMMARY MEMO
Financial statements are used by a business and other interested party outside the
business, as the basis for accurate decision making, planning, and controlling
purposes, parties outside the business can use them to assess competition and
investment potentials. The financial statements should also be laid out in a format
that is accessible for all parties to understand and should include every piece of
relevant information that the business has so that the financial statements are
accurate and represent the business in its true form. The users of these financial
statements are as follows:
Business management – they need this information to calculate the profitability,
cash flows and liquidity of the business every month, so they can make decision on
the business and identify the problematic areas of the business.
Competitors – this will allow competition to evaluate the business’ financial position
and condition in the market so they can alter their competitive strategies.
Employees – the statements will give employees an insight into the business
performance so the employee can assess the security of the business and also see
if the business is fairly paying the employees when compared to the financial info.
Customers – this user can look at the financial information to see if the business is
struggling and this can help the customer see if the business will be able to
undertake the customers requests. For example, a customer of a construction firm
can look at the statements and look to see if the business will be able to provide the
goods without running into cash flow problems that could halt the process.
Governments – the government will use the statements as a basis to determine the
business’ taxation, the business must complete the statements honestly with
accurate information or could be accused of ‘window dressing’ the business which
could lead to fraud investigates.
Lenders – banks will look at the information to evaluate how risky the business is
and how likely they are to receive their finance back from the business.
Investors – similar to lenders investors will want to see where and how their
investment will be spent and what is the potential return on those investments.
For all the information in the statements the stakeholders above will use parts of the
information to divide by one another to calculate different results which can be
described as the financial ratios. These ratios help with all sorts of decision making,
and also help eliminate confusion when comparing data in the statements between
different sized businesses. However, the ratios must be used in reference to the
following:
Establishing trends from past years, to provide a standard of comparison
Benchmarking against other businesses in the same industry
Paraphrase This Document
Need a fresh take? Get an instant paraphrase of this document with our AI Paraphraser
Comparing with standards assumed to be satisfactory by the interested party, e.g.
the bank
A summary of the key financial statements
1. Balance sheet – this will combine the assets, liabilities (money owed to
creditors) and the equity capital (shareholder invested and what is retained or
reserved to be reinvested back into the business) that the business holds on a
certain date. The balance sheet will also be equal on both sides.
2. Cash flow – this statement is important as it answers the questions mangers
may have about if they have enough cash to fulfil certain projects. It shows the
changes in the balance sheet and breaks it down into the operating, investing,
and financing activities. The cash flow statement will be used to make a cash flow
forecast which comprises the receipts and payments of the business. A business
will always have expenses in their operations and their may be a delay in the
payments they receive from the goods they have sold to the customers e.g. credit
sale, so the business must have a good cash flow forecast to be able to interpret
when the business will be short n cash and how they can overcome this to
prevent the operations slowing down below optimum output.
3. Profit and loss account – this provide information on the operating activities of
the business to include the business’ gross profit after marking sales, the
turnover, and the net profit after deducting the expenses the business incurred.
Gross profit is income – cost and Net profit is gross profit – expenses. The
profit loss account will also consider the depreciation of the fixed assets a
business owns.
Liquidity
This exists when the organisation has a good cash flow or has enough cash to meet
short-term requirements and commitments. Liquidity thus refers to the amount cash
available in relation to the size of its debts which are payable in the near future. A
ratio that is used to monitor the business’ performance in terms of liquidity is the
Current ratio = Current assets / current liabilities, the Quick ratio ( acid test )
can also be used which is Quick ratio = (current assets – inventories) / current
liabilities
Inventory
Another factor in the profit loss account information is the inventory which is the term
used for the value of stock, which is made up of the materials and components the
business has to buy for the product, as well as the finished goods that are currently
unsold. Inventory can be costly for a business to hold and can cause risks such a
health and safety problems and potential damaged goods so a business will always
want to keep its inventory at its optimal capacity. Having too much inventory at any
given time can always cause a business to run into cash flow problems so keep the
optimal levels can be done by using different systems that will calculate trends in the
environment for large demand and a slump in demand allowing a business to make
its decisions based on these findings. The ratio that will help with this is called the
Inventory Turnover Ratio = Cost of goods sold / Average inventory
Non-current assets and current assets
The non-current assets (fixed assets) are the long-term assets that a business owns
which would include things like the building the business has, the equipment they
use in their operations and the land they own. Whereas the current assets include
anything the business has that can be converted into cash relatively quickly such as
the raw materials the business has, the inventory of finished products, and accounts
receivables etc. Cash can also be classified as a current asset. The business must
also evaluate the total liabilities of the business which are anything the business
owes to different parties such as, electricity bills, bank loan repayments, salaries,
accounts payable and income taxes. A ratio to assist a business to evaluate the
business’ performance with reference to liabilities and assets would be the:
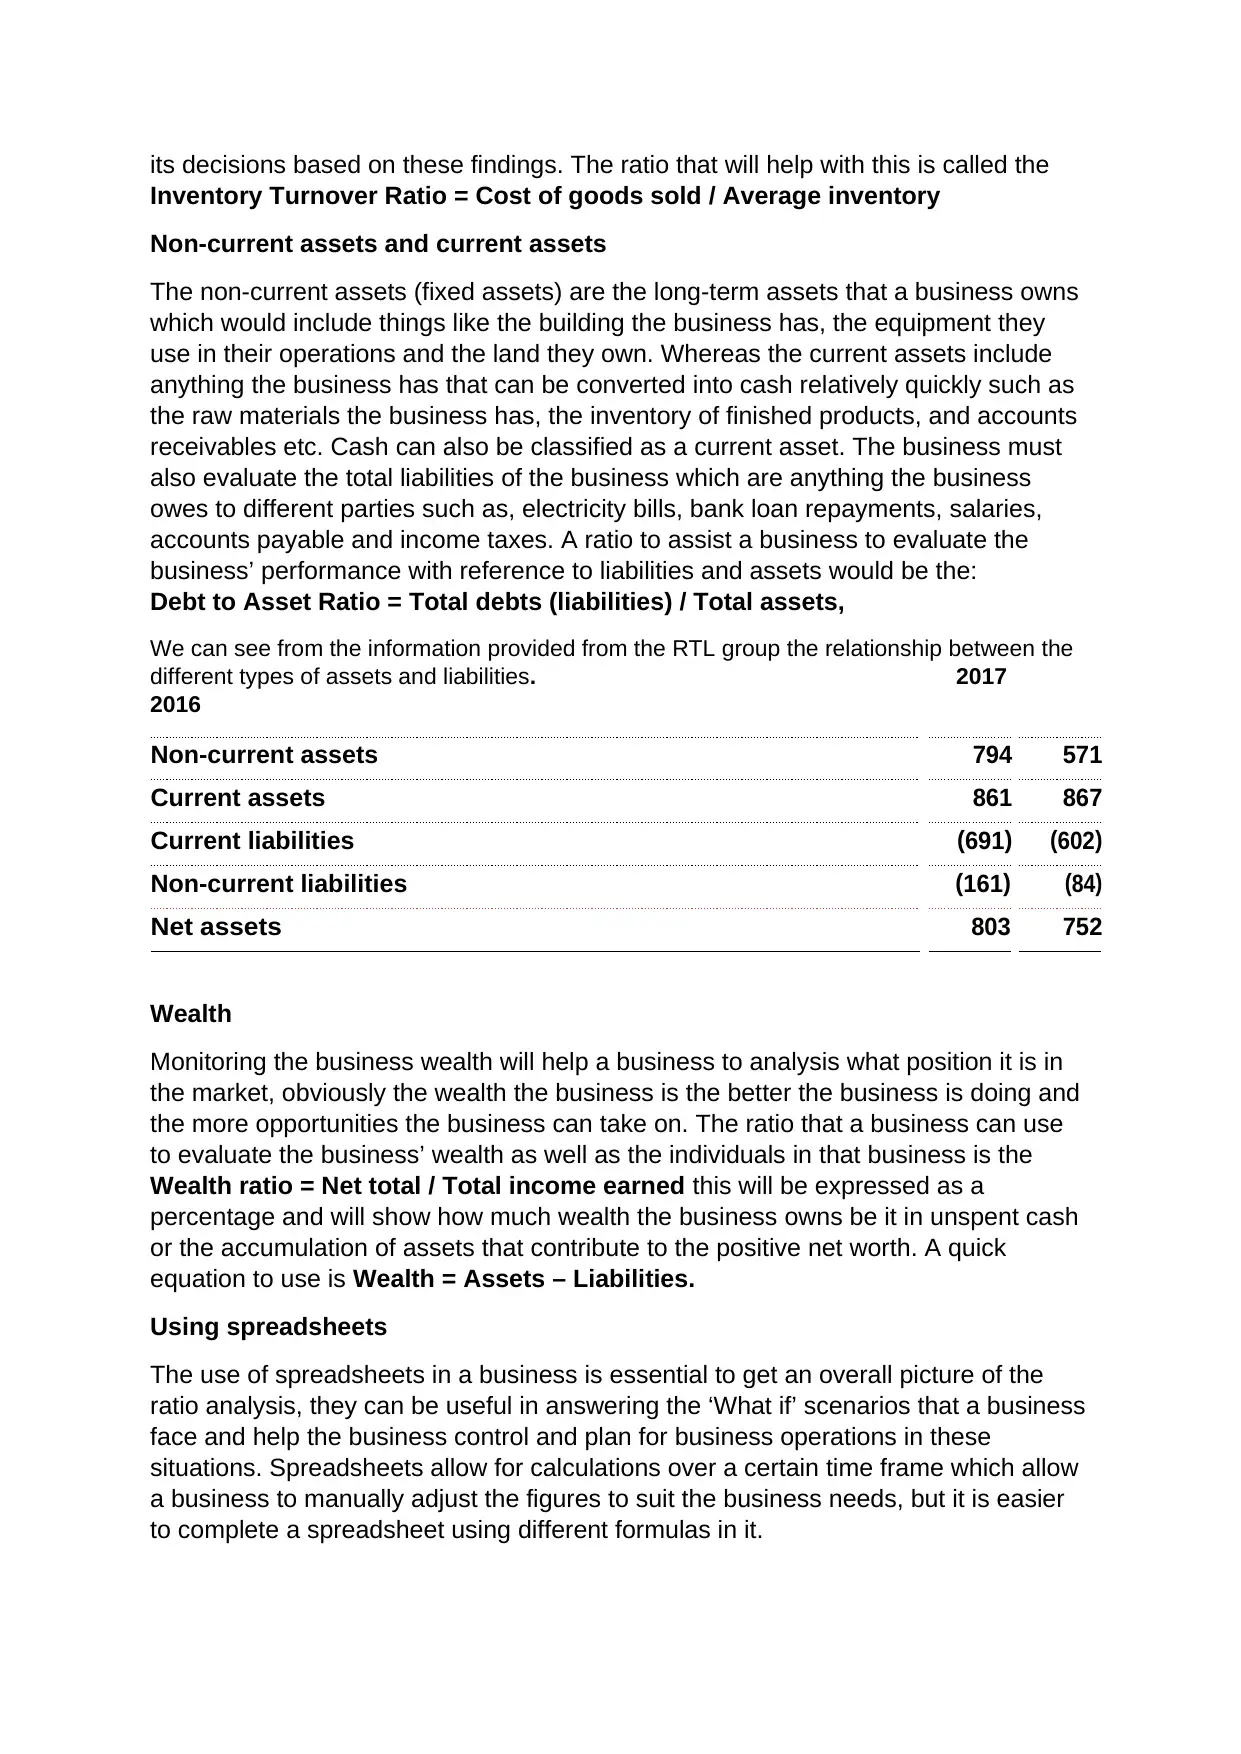
Debt to Asset Ratio = Total debts (liabilities) / Total assets,
We can see from the information provided from the RTL group the relationship between the
different types of assets and liabilities. 2017
2016
Non-current assets 794 571
Current assets 861 867
Current liabilities (691) (602)
Non-current liabilities (161) (84)
Net assets 803 752
Wealth
Monitoring the business wealth will help a business to analysis what position it is in
the market, obviously the wealth the business is the better the business is doing and
the more opportunities the business can take on. The ratio that a business can use
to evaluate the business’ wealth as well as the individuals in that business is the
Wealth ratio = Net total / Total income earned this will be expressed as a
percentage and will show how much wealth the business owns be it in unspent cash
or the accumulation of assets that contribute to the positive net worth. A quick
equation to use is Wealth = Assets – Liabilities.
Using spreadsheets
The use of spreadsheets in a business is essential to get an overall picture of the
ratio analysis, they can be useful in answering the ‘What if’ scenarios that a business
face and help the business control and plan for business operations in these
situations. Spreadsheets allow for calculations over a certain time frame which allow
a business to manually adjust the figures to suit the business needs, but it is easier
to complete a spreadsheet using different formulas in it.
Inventory Turnover Ratio = Cost of goods sold / Average inventory
Non-current assets and current assets
The non-current assets (fixed assets) are the long-term assets that a business owns
which would include things like the building the business has, the equipment they
use in their operations and the land they own. Whereas the current assets include
anything the business has that can be converted into cash relatively quickly such as
the raw materials the business has, the inventory of finished products, and accounts
receivables etc. Cash can also be classified as a current asset. The business must
also evaluate the total liabilities of the business which are anything the business
owes to different parties such as, electricity bills, bank loan repayments, salaries,
accounts payable and income taxes. A ratio to assist a business to evaluate the
business’ performance with reference to liabilities and assets would be the:
Debt to Asset Ratio = Total debts (liabilities) / Total assets,
We can see from the information provided from the RTL group the relationship between the
different types of assets and liabilities. 2017
2016
Non-current assets 794 571
Current assets 861 867
Current liabilities (691) (602)
Non-current liabilities (161) (84)
Net assets 803 752
Wealth
Monitoring the business wealth will help a business to analysis what position it is in
the market, obviously the wealth the business is the better the business is doing and
the more opportunities the business can take on. The ratio that a business can use
to evaluate the business’ wealth as well as the individuals in that business is the
Wealth ratio = Net total / Total income earned this will be expressed as a
percentage and will show how much wealth the business owns be it in unspent cash
or the accumulation of assets that contribute to the positive net worth. A quick
equation to use is Wealth = Assets – Liabilities.
Using spreadsheets
The use of spreadsheets in a business is essential to get an overall picture of the
ratio analysis, they can be useful in answering the ‘What if’ scenarios that a business
face and help the business control and plan for business operations in these
situations. Spreadsheets allow for calculations over a certain time frame which allow
a business to manually adjust the figures to suit the business needs, but it is easier
to complete a spreadsheet using different formulas in it.
⊘ This is a preview!⊘
Do you want full access?
Subscribe today to unlock all pages.
Trusted by 1+ million students worldwide
Ratio Analysis
In general ratio analysis is used as a quantitative method to gain an insight into the
business’ operational efficiency, its liquidity, and its profitability by management
studying and analysis the financial statements previously discussed. Ratio analysis
is used to identity the business performance with the following:
Ratio analysis will compare the line-item data in the business financial accounts
and reveal to the management of the business insights on liquidity, profitability,
solvency, and efficiency.
The analysis will evaluate how the business is performing over a specific time
period and can use this information to compare it with businesses in the same
industry.
Ratios will offer insights but when paired with other metrics they will allow a
business to see a much broader picture of the business financial position, health,
and performance.
Classifying ratios
Financial ratios can be classified into a variety of groups:
Gearing – indicates how stable the business is in the long term
Capital structure – relates to the composition and relationship which exists
between the equity (i.e. the ordinary share capital plus reserves) and the other
long-term sources of finance (i.e. preference shares, debentures, and fixed term
loans)
The main themes within the business that the ratios identity as previously discussed
are the following:
Liquidity and Working Capital
Solvency and Gearing
Profitability
Each of these will be discussed in greater detail in the next section of this report.
Financial management and the accountants of a business will use this range of
ratios to interpret the financial performance that the business is in. Management
however must understand how each ratio is calculated and what each ratio means
so that they can assess the values found in the analysis and predict any changes in
the business which they can then implement changes in the business to counter act
adverse impacts the business is facing.
Paraphrase This Document
Need a fresh take? Get an instant paraphrase of this document with our AI Paraphraser
Task 2 – Financial stability and performance
BREIFING PAPER
Liquidity ratios
This ratio will deal with how much cash the business has available to access to meet
the day-to-day needs of the business operations without distribution to the ongoing
process. The liquidity ratio can be analysis using the two following ways:
Structural liquidity – this is the measure of relationship between the assets and the
liabilities in the balance sheet.
Operational liquidity – this is the measure of the cash flow in and out of the
business and how quickly a business can turn assets into cash.
Problems in liquidity will arise when the business takes on too many debts that need
repayments at similar times and the business has a reduced ability to convert the
assets it has into cash. Liquidity is essential the business’ ability to pay debts when
they are due on time by converting assets to cash at the optimal level. In order to
analysis liquidity the business must use ratios that will comprise the relevant data
from the balance sheet.
The two ratios that are used in calculating the liquidity of a business are the current
ratio and the liquidity quick ratio otherwise known as the acid test. In summary the
current ratio compares the current assets to its current liabilities whereas the quick
ratio / acid test will only the assets which can be readily available to use to the
business such as cash in hand payments or debtors soon to repay.
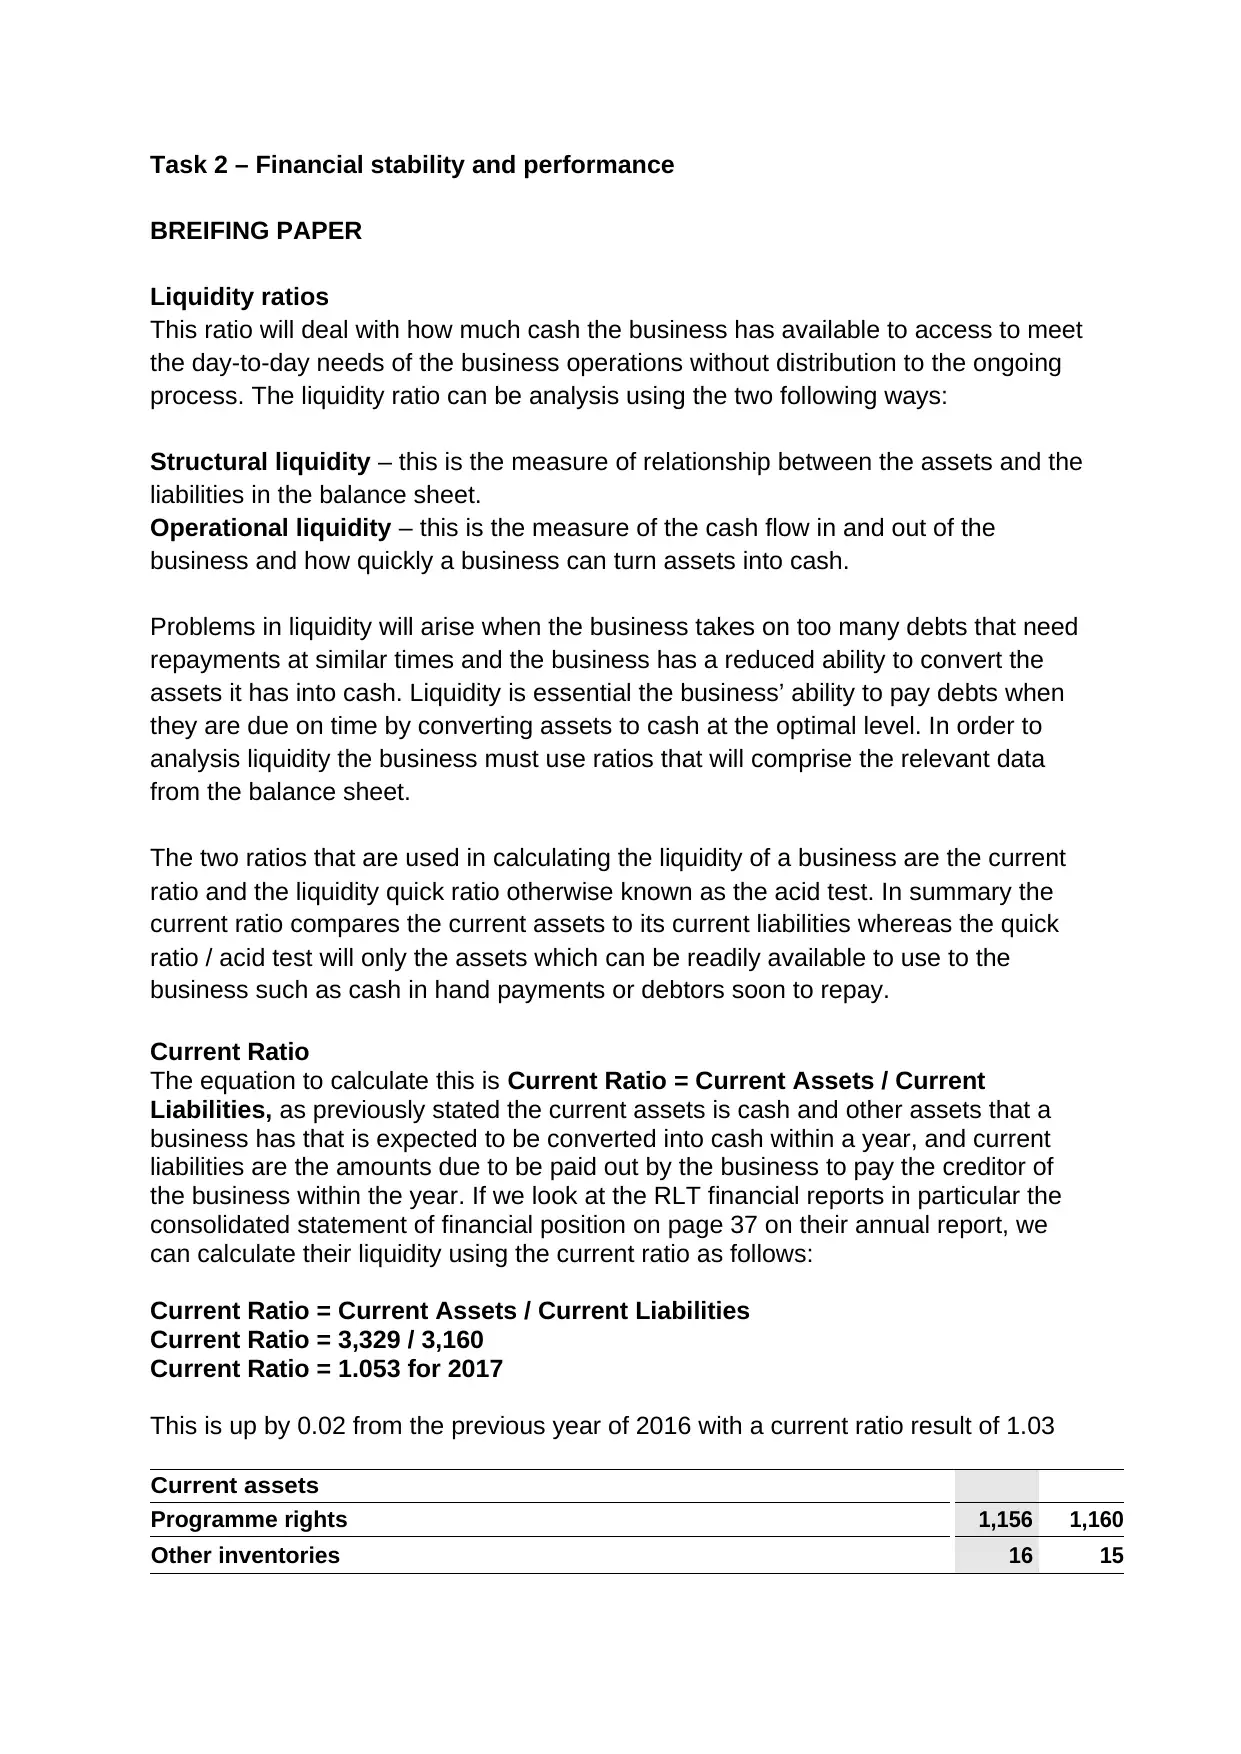
Current Ratio
The equation to calculate this is Current Ratio = Current Assets / Current
Liabilities, as previously stated the current assets is cash and other assets that a
business has that is expected to be converted into cash within a year, and current
liabilities are the amounts due to be paid out by the business to pay the creditor of
the business within the year. If we look at the RLT financial reports in particular the
consolidated statement of financial position on page 37 on their annual report, we
can calculate their liquidity using the current ratio as follows:
Current Ratio = Current Assets / Current Liabilities
Current Ratio = 3,329 / 3,160
Current Ratio = 1.053 for 2017
This is up by 0.02 from the previous year of 2016 with a current ratio result of 1.03
Current assets
Programme rights . 1,156 1,160
Other inventories 16 15
BREIFING PAPER
Liquidity ratios
This ratio will deal with how much cash the business has available to access to meet
the day-to-day needs of the business operations without distribution to the ongoing
process. The liquidity ratio can be analysis using the two following ways:
Structural liquidity – this is the measure of relationship between the assets and the
liabilities in the balance sheet.
Operational liquidity – this is the measure of the cash flow in and out of the
business and how quickly a business can turn assets into cash.
Problems in liquidity will arise when the business takes on too many debts that need
repayments at similar times and the business has a reduced ability to convert the
assets it has into cash. Liquidity is essential the business’ ability to pay debts when
they are due on time by converting assets to cash at the optimal level. In order to
analysis liquidity the business must use ratios that will comprise the relevant data
from the balance sheet.
The two ratios that are used in calculating the liquidity of a business are the current
ratio and the liquidity quick ratio otherwise known as the acid test. In summary the
current ratio compares the current assets to its current liabilities whereas the quick
ratio / acid test will only the assets which can be readily available to use to the
business such as cash in hand payments or debtors soon to repay.
Current Ratio
The equation to calculate this is Current Ratio = Current Assets / Current
Liabilities, as previously stated the current assets is cash and other assets that a
business has that is expected to be converted into cash within a year, and current
liabilities are the amounts due to be paid out by the business to pay the creditor of
the business within the year. If we look at the RLT financial reports in particular the
consolidated statement of financial position on page 37 on their annual report, we
can calculate their liquidity using the current ratio as follows:
Current Ratio = Current Assets / Current Liabilities
Current Ratio = 3,329 / 3,160
Current Ratio = 1.053 for 2017
This is up by 0.02 from the previous year of 2016 with a current ratio result of 1.03
Current assets
Programme rights . 1,156 1,160
Other inventories 16 15

Income tax receivable 48 19
Accounts receivable and other financial assets . 1,844 2,025
Cash and cash equivalents
.
265 433
Total 3,329 3,652
Current liabilities
Loans and bank overdrafts . 247 493
Income tax payable 63 52
Accounts payable . 2,672 2,842
Provisions 178 145
Total 3,160 3,532
Acid test
This ratio will be concerned with the same current assets and liabilities, but it
measures how well the business’ current assets could be used to cover the demands
of the current liabilities. The acid test will only use the most liquid current assets in its
calculation, which are assets that should be converted into cash for the business
within 90 days. The ratio equation is as follows Liquidity ratio (Acid Test) =
(Current Assets – Stock) / Current liabilities, again by looking at RTL’s annual
report we can calculate the acid test as follows:
Acid test = current assets – stock / current liabilities
Acid test = (3,329 – 16) / 3160
Acid test = 1.048
This is up by 0.19 from the previous year of 2016 with an acid test result of 1.029
After analysing these results to evaluate the liquidity of the business we can see
from the current ratio how well the business is performing, in regards to RTL who
have a current ratio of 1.053 this would indicate that they have enough current
assets which can be used to cover the current liabilities without selling any of their
fixed assets, but its is still a weak result. A good current ratio value would be
between 1.2 and 2.0, this means that RTL could experience trouble if some adverse
factors impacted on the business which could leave them short when trying to pay
their liabilities resulting in cash flow problems. The business has increased its
current ratio by 0.02 from 2016 which means the business is growing however it is a
low increase. To increase current ratio RTL should pay off any current liabilities as
often and as early as they can to decrease the amount of current liabilities and the
interest associated with them. When looking at the acid test it’s similar to the current
ratio, as result of 1.1 is considered a good value for a business to obtain from the
acid test, any result higher than this will mean the business will have excess cash.
RTL have again increased from 2016 in the acid test value by 0.19 which shows the
business is going in the right direction, however again they are at a risky point in the
business operations.
⊘ This is a preview!⊘
Do you want full access?
Subscribe today to unlock all pages.
Trusted by 1+ million students worldwide
As discussed, if a business like RTL has a low liquidity then they may be able to
raise it by the following:
Paying some debts
Increasing your current assets from loans or other borrowings with a maturity of
more than one year
Converting non-current assets into current assets
Increasing your current assets from new equity contributions
Putting profits back into the business
Gearing
The term gearing refers to the relationship between business’ debt and its equity. It
considers the business’ capital structure which is made up of the combination of the
business’ fixed assets and its net current assets. Both of these will be financed by
some sort of long-term capital in the business which will comprise the business
capital, the business reserves, and the long-term loan capital. Gearing essential is
the relationship between the contributions the business has towards financing made
by the internal stakeholders in the business such as the owners and shareholders
and the amount contributed by the external stakeholders such as the banks and
other lenders. The level of gearing must be evaluated as it will assess the level of
risk that is associated with a business which is what mangers will need to look at
when they are making decisions. The gearing ratio will be used to calculate and
evaluate to what extent the business relies of borrowing as a source of its finance.
There are two types of gearing.
Operating gearing – considers to what degree costs are fixed and examines the
relationship between sales revenue and operating profits
Financial gearing – looks at the proportion of an organisation’s debt in its overall
capital structure. The higher the financial gearing, the less likely an investor will be
willing to lend money as there will be higher risk attached. Conversely, a low
gearing might attract new investors and it also indicates that the organisation has
the security of knowing that it would be able to sell off assets should it find itself in
financial difficulties
Gearing will be used in the ratio to compare the long-term liabilities and the capital
employed in the business. The gearing ratio is expressed as a percentage and is as
follows, Gearing = (Debt / Equity) x 100. For smaller businesses, the gearing ratio
would be Gearing = (Fixed return financing / All sources of finance) x 100 and
limited companies would use Gearing = (Preference shares + Long-term
liabilities) x 100 / (All shares + Reserves + Long-term Liabilities). If we look at
RTL’s annual report, we can work out the gearing ratio as follows:
Gearing = (Debt / Equity) X 100
Gearing = (1310 / 3424) X 100
Gearing = 38.26% for 2017
This is up by 4.035% from the last year of 2016 which had a value of 34.23%
Paraphrase This Document
Need a fresh take? Get an instant paraphrase of this document with our AI Paraphraser
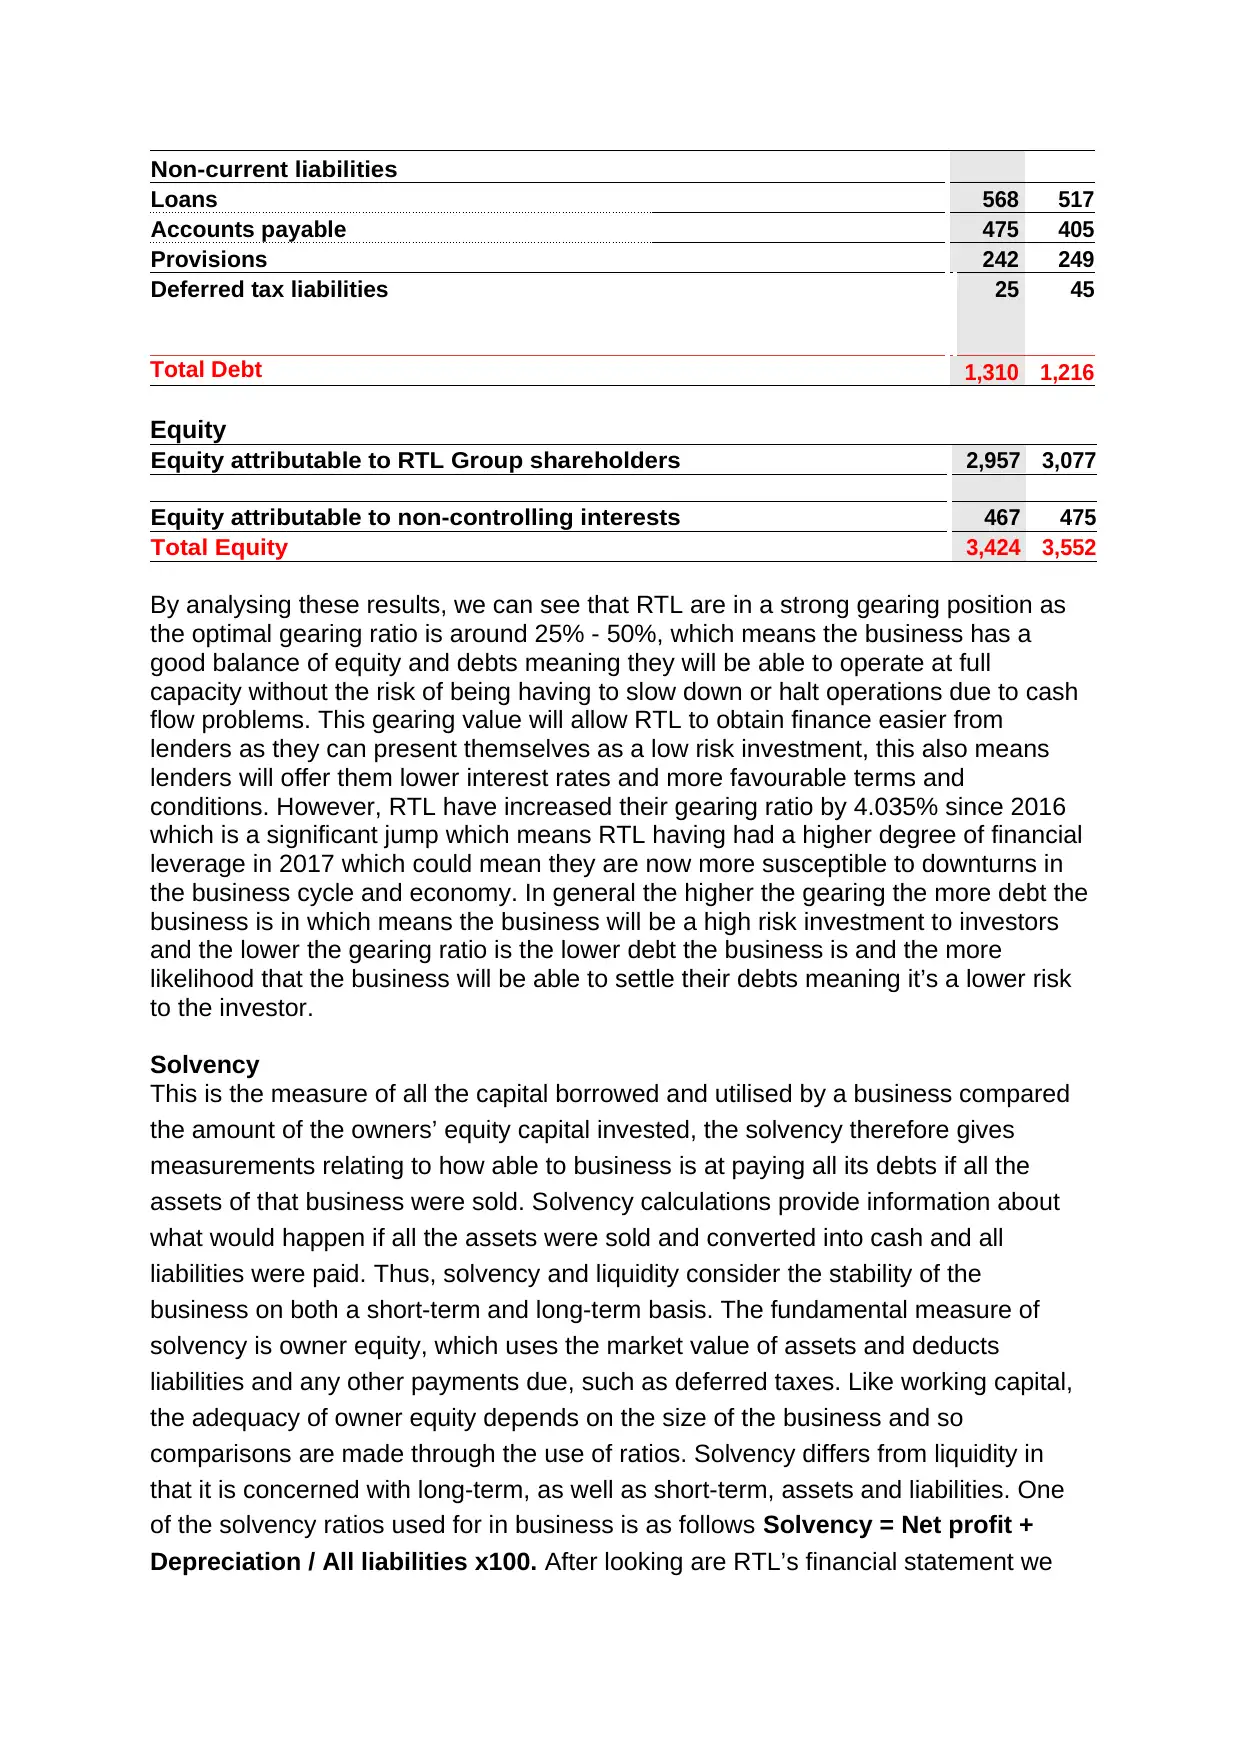
Non-current liabilities
Loans 568 517
Accounts payable . 475 405
Provisions . 242 249
Deferred tax liabilities
.
25 45
Total Debt 1,310 1,216
Equity
Equity attributable to RTL Group shareholders 2,957 3,077
Equity attributable to non-controlling interests 467 475
Total Equity 3,424 3,552
By analysing these results, we can see that RTL are in a strong gearing position as
the optimal gearing ratio is around 25% - 50%, which means the business has a
good balance of equity and debts meaning they will be able to operate at full
capacity without the risk of being having to slow down or halt operations due to cash
flow problems. This gearing value will allow RTL to obtain finance easier from
lenders as they can present themselves as a low risk investment, this also means
lenders will offer them lower interest rates and more favourable terms and
conditions. However, RTL have increased their gearing ratio by 4.035% since 2016
which is a significant jump which means RTL having had a higher degree of financial
leverage in 2017 which could mean they are now more susceptible to downturns in
the business cycle and economy. In general the higher the gearing the more debt the
business is in which means the business will be a high risk investment to investors
and the lower the gearing ratio is the lower debt the business is and the more
likelihood that the business will be able to settle their debts meaning it’s a lower risk
to the investor.
Solvency
This is the measure of all the capital borrowed and utilised by a business compared
the amount of the owners’ equity capital invested, the solvency therefore gives
measurements relating to how able to business is at paying all its debts if all the
assets of that business were sold. Solvency calculations provide information about
what would happen if all the assets were sold and converted into cash and all
liabilities were paid. Thus, solvency and liquidity consider the stability of the
business on both a short-term and long-term basis. The fundamental measure of
solvency is owner equity, which uses the market value of assets and deducts
liabilities and any other payments due, such as deferred taxes. Like working capital,
the adequacy of owner equity depends on the size of the business and so
comparisons are made through the use of ratios. Solvency differs from liquidity in
that it is concerned with long-term, as well as short-term, assets and liabilities. One
of the solvency ratios used for in business is as follows Solvency = Net profit +
Depreciation / All liabilities x100. After looking are RTL’s financial statement we
can see that the net profit for the year was £837(m) and the depreciation was
valued at £230(m) and total current liabilities were £3160(m) and non-current
liabilities were £1310(m) so we can work out the solvency as follows:
Solvency = Net profit + Depreciation / All liabilities x100
Solvency = 837 + 230 (1067) / 3160 + 1310 (4470)
Solvency = 0.24 or 24% for 2017
For 2016 it is as follows:
Solvency =816 + 218 / 3532 + 1216
Solvency = 0.21 or 21%
After looking at this value we can see that RTL is in an acceptable solvency position,
a good solvency will range from anything higher than 20%, this means the that RTL
is in a healthy financial position as it means the business can repay all its debts. RTL
has had a significant favourable increase in solvency of 3% which has out them in a
healthy position. To increase this figure even further RTL could undertake various
activities such as:
Increase sales – building on sales and marketing will drastically increase
revenue in the long-term meaning kore cash will flow into the business which can
help pay debts.
Increase profitability – if revenue is high but profit is low this can impact on the
solvency of the business adversely, so building on the profit margin by increasing
prices or buying in bulk will help keep costs of operations low and profit margin
high.
Increase owner equity – the owners of the business can invest their own cash
into the business to boost the solvency but using shareholders and investors as a
source of finance will mean there is much more cash readily available which will
help the business from falling short on its debts.
Sell some assets – assets that are not central to the business operations can be
sold off which will help raise cash. If the business sells financed assets this will
increase the cash and decrease the liabilities in one.
In general, when we refer to liquidity and earing the most commonly used ratios for
assessing liquidity and gearing are:
Debt-to-asset ratio – identifies total liabilities as a proportion of total assets. The
higher the value, the greater the exposure to risk for the business
Equity-to-asset ratio – expresses the proportion of total assets financed by the
owners’ equity (percentage ownership)
Debt-to-equity ratio – reflects the capital structure of the business, and the extent
to which debt capital is being combined with equity capital (gearing ratio)
Profitability
This term can be used in business and refers to the relationship between the profit
the business is making and the total assets the business owns. In simple terms a
business with high profits and low total assets would be described as a profitability
business. Making profit is essential in business, higher profits means the business is
wealthier meaning the business will be able to undertake more potential
⊘ This is a preview!⊘
Do you want full access?
Subscribe today to unlock all pages.
Trusted by 1+ million students worldwide
opportunities and gain a larger market share. The two main ways to a business will
display profit is as follows below, these two forms of profit have a significant
difference between one another:
Gross profit – the simple difference between the income of the business and its
costs of sales
Operating profit – the gross profit less any overhead expenses
The profit margin of the business will measure how efficiency the business is running
and determine how well a business is coping when it comes to competition and
adverse market conditions such as slumps in demands. The profit margin essential
will calculate how much the business earns from each pound it makes from its
income. This ratio can be calculated as follows ad is expressed in a percentage
Profit Margin = (Net Profit / Net Sales) x 100. With reference to RTL we can work
out the Profit Margin as follows: NOTE net sales = revenue
Profit Margin = (Net Profit / Net Sales) x 100
Profit Margin = (837 / 6373) x 100
Profit Margin = 13.1% for 2017
This is an increase of 0.1% from the previous year of 2016 which a profit
margin of 13.0%
There are also a number of further ratios used to determine the profitability of a
business, one of which, which is very important to a business is the Return on
Capital Employed (ROCE), this ratio will help the business make comparisons
between the business and other businesses in different industries and economies.
The ratio equation for the ROCE is as follows (Profit before interest and tax /
Capital Employed) x 100 in addition the equation for capital employed is Capital
Employed = Total Assets – Current Liabilities. We can work out RTL ROCE as
follows:
ROCE = (Profit before interest and tax / Capital Employed) x 100
ROCE = (1246 / 4734) x 100
ROCE = 26.3% for 2017
This is an increase of 0.8% from the previous year of 2016 with a ROCE of
25.5%
The other ratio commonly used in business to measure its profitability is the Return
on Ordinary Shareholders’ Funds (ROSF), this ratio can be calculated as follows,
ROSF = (Net profit after taxation and preference dividend / Ordinary share
capital + reserves) x 100, NOTE ordinary share capital = price of share x number of
shares.
After analysing these results, we can see that RTL gained a 0.1% increase on its
profit margin although this is a small increase the overall profit margin of 13.1% is a
average but solid value in regards to profit margin, anything 10% and lower is found
to be a weak profit margin and anything 20% and higher is found to be a strong profit
margin, so if RTL continue to increase this would strength the business’ stability. The
Paraphrase This Document
Need a fresh take? Get an instant paraphrase of this document with our AI Paraphraser
profit margin means that RTL can directly compare the profit and costs of each
product/service at any given time and therefore they can implement strategies to
increase particular profit margins. The various strategies to increase profit margin
are as follows:
Increase prices – this is the easiest way to increase profit margin, however this
could give your competitors a opportunity to start a price war, so doing research
on clients too see what they would pay for new products is the best way to do
this.
Evaluate and cut the costs of sales – this includes looking ay depreciation,
factory overheads, materials, wages, storage etc. by reducing these costs and
getting rid of any unnecessary expenses rom these cost then the business will
increase its overall profit margin.
Suppliers – similar to the above point, if the business can negotiate a cheaper
price with the supplier, or if this is not possible then research for new suppliers
that can offer a cheaper price for the materials. This will greatly decrease the
production price for each product sold which will drastically increase the profit
margin. If the business is in the position, then using economies of scale to their
benefit by buying in bulk is a good way to increase profit margin.
Manage inventory more efficiently – by the introduction of a up-to-date
inventory management system then the business could save on storage costs
and also will be able to predict sales patterns and trends in the market so that the
business can prepare stock for higher demands at certain times of the year.
When looking at the result from the ROCE ratio analysis we can see that the value
has increase by 0.8% from 2016 to 26.3% in 2017, even though again this is a small
increase it shows the RTL are heading in the right direction as the higher the ROCE
percentage then the higher the profits the business made on its available resources,
as long as RTL continue to have a rising ROCE then they are in a healthy position
with reference to business performance and stability. The ways RTL could improve
on their ROCE are as follows:
Improve the top line – by increasing the operating profit without increasing the
corresponding capital employed the business will increase it ROCE
Maintain operations profits – by maintaining these profits and reducing the
value of the capital employed then the business will benefit from a healthy ROCE
level.
Imitations of Ratio analysis
The ratio analysis of financial statements are useful techniques that every business
should employ as they highlight the different relationships between the elements of
the different financial statements. However even with their usefulness ratio analysis
has been found to have various limitations which are as follows:
1. Ratios are based on the accounting figures that are provided in the financial
statements – this can be subject to various approximations, deficiencies, practice
diversity and manipulation, meaning the results and values calculated can
sometimes be inaccurate and unreliable, leading to inefficient decision making.
2. Ratios have inherent problem of comparability – due to different business
employing various accounting methods, this can cause confusion in comparing
key relationships. For example, inventory turnover can be different for a company
using FIFO than for the other company using LIFO method of inventory valuation.
This thought process is the same when it comes to the methods that business
use when calculating amortisation of preliminary and intangibles expenses,
depreciation, life of asset estimates etc.
3. Inflation – inflation can cause the information of historical costs that are used in
the financial statements to become irrelevant values especially in the case of
assets purchased at different dates. Because the financial statements do not
adjust their values in relation to inflation, this can cause the ratios to be
calculated using irrelevant information which can cause distortions in their results
that can be deceptive.
4. Ratio analysis is not totally dependable – the ratios information must be used
after there is consideration given to the likes of the economic conditions, size of
firm, industry situation, diversity of the product etc. without considering these
factors the business could be ill informed and be surprised when certain factors
impacted the business that they had not accounted for.
5. The various methods of computation will also sway the use of accounting ratios.
The different concepts used for determining numerator and denominator in a
particular accounting ratio will not help in drawing reliable conclusions even in
identical situations.
⊘ This is a preview!⊘
Do you want full access?
Subscribe today to unlock all pages.
Trusted by 1+ million students worldwide
1 out of 12
Related Documents


Your All-in-One AI-Powered Toolkit for Academic Success.
+13062052269
info@desklib.com
Available 24*7 on WhatsApp / Email
![[object Object]](/_next/static/media/star-bottom.7253800d.svg)
Unlock your academic potential
Copyright © 2020–2026 A2Z Services. All Rights Reserved. Developed and managed by ZUCOL.