Financial Accounting: Whitbread vs. Greene King Ratio Analysis
VerifiedAdded on 2021/01/01
|9
|2664
|181
Report
AI Summary
This report provides a financial ratio analysis of Whitbread Plc and Greene King Plc. It begins with an introduction to financial accounting and the objectives of the report, which is to determine the financial positions of the organizations by evaluating key ratios. The report analyzes various ratios, including current ratio, liquid ratio, net profit, gross profit ratio, asset turnover ratio, debt equity ratio, inventory turnover ratio, fixed assets turnover ratio, operating profit ratio, and debtors turnover ratio. The report includes interpretations of each ratio, comparing the performance of Whitbread Plc and Greene King Plc. It also discusses the perspectives of stakeholders like management, investors, and lenders. The report concludes by identifying financial factors (liquidity, leverage, asset utilization) and non-financial factors (firm size) that influence the performance of both companies.

FINANCIAL
ACCOUNTING
ACCOUNTING
Paraphrase This Document
Need a fresh take? Get an instant paraphrase of this document with our AI Paraphraser
Table of Contents
INTRODUCTION...........................................................................................................................1
ANALYSIS......................................................................................................................................1
PERFORMANCE FACTORS.........................................................................................................5
CONCLUSION................................................................................................................................6
REFERENCES ...............................................................................................................................1
INTRODUCTION
Financial accounting is the specialized branch of accounting that keeps track of a
company's financial transactions. It is the process of preparing financial statements that
companies' use to show their financial position and performance to people outside the company
including customers, creditors, suppliers and investors (Ikbal and Al-Qdau, 2014). The aim of
the report to determinant appropriate financial position of organisations by evaluating key ratios.
The objective of this report managing customer interest. Criteria of this report is limited to
analysing financial aspects of both the organisations. In the context of this report selecting two
companies are Whitbread Plc and Greenking Plc. Whitbread Plc is the UK's largest operators of
coffee shops, hotels, and restaurants, with some of the UK's most successful hospitality brands.
The company's brand sharp and strength focus on markets where there is great opportunity for
structural growth provide sustainable development potential for business. The company operate
business in two sections are first is premier inn and restaurants with over 785 hotels and more
than 72000 rooms across the UK. Second is Costa with over 2400 coffee shops in the UK, over
1400 stores in 31 international markets. In presently trading company in hotels and restaurants
and coffee shops. Greene king Plc is the country's leading pub brewer and retailer, running over
2900 pubs, hotels and restaurants in village, town and city centre high streets across Scotland,
England and Wales. With a rich heritage of over 200 years, award winning beers, operate
managed, tenanted, leased and franchised pubs from headquarters. In trading background
company from 1799 brewing beer and running pubs, no changes coming (Financial data of WTB
plc, 2018).
In this report covers analysis of accounting ratios of selected companies relating to
performance and financial status. Research on financial and non financial factors of two
companies to know that how ratios affected to companies performance during the periods under
review.
ANALYSIS
For evaluate the relative performance and financial status of Whitbread Plc and Greene
king Plc through key ratios:
1
⊘ This is a preview!⊘
Do you want full access?
Subscribe today to unlock all pages.
Trusted by 1+ million students worldwide
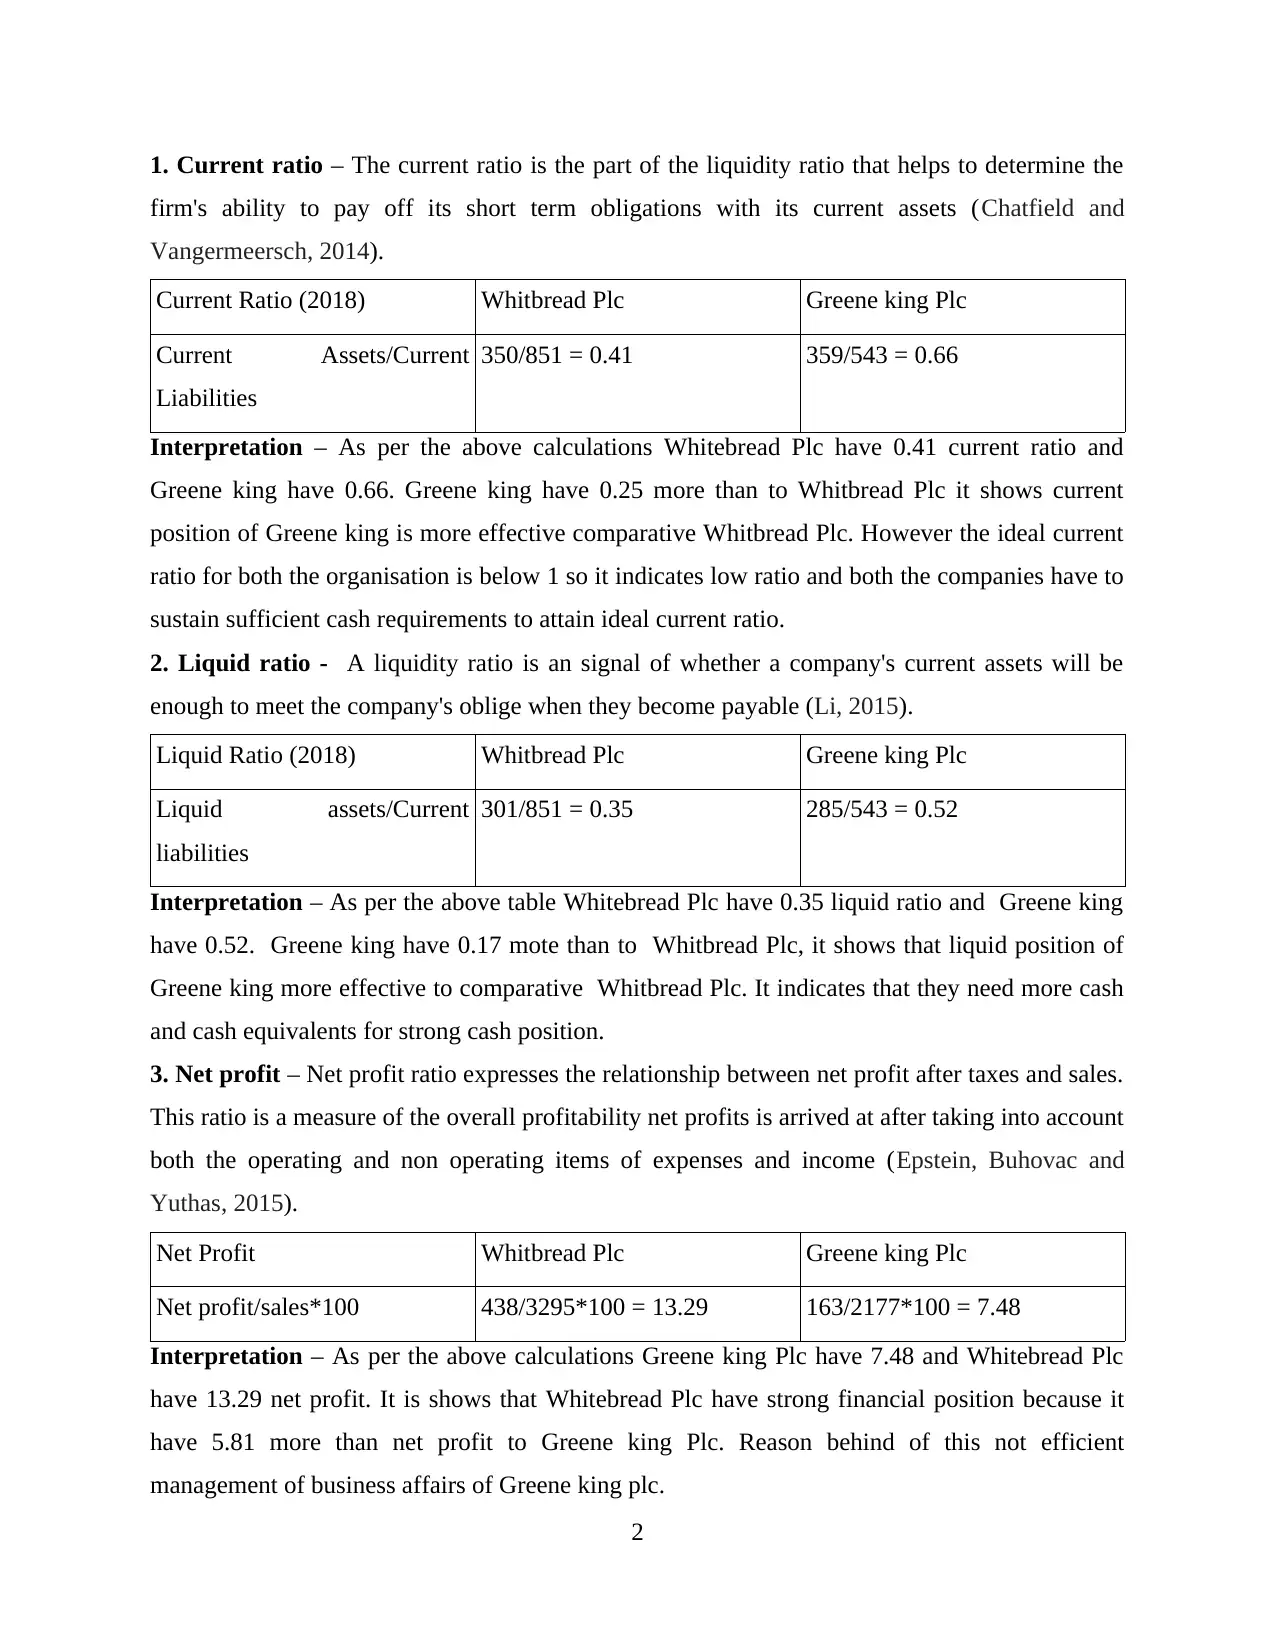
1. Current ratio – The current ratio is the part of the liquidity ratio that helps to determine the
firm's ability to pay off its short term obligations with its current assets (Chatfield and
Vangermeersch, 2014).
Current Ratio (2018) Whitbread Plc Greene king Plc
Current Assets/Current
Liabilities
350/851 = 0.41 359/543 = 0.66
Interpretation – As per the above calculations Whitebread Plc have 0.41 current ratio and
Greene king have 0.66. Greene king have 0.25 more than to Whitbread Plc it shows current
position of Greene king is more effective comparative Whitbread Plc. However the ideal current
ratio for both the organisation is below 1 so it indicates low ratio and both the companies have to
sustain sufficient cash requirements to attain ideal current ratio.
2. Liquid ratio - A liquidity ratio is an signal of whether a company's current assets will be
enough to meet the company's oblige when they become payable (Li, 2015).
Liquid Ratio (2018) Whitbread Plc Greene king Plc
Liquid assets/Current
liabilities
301/851 = 0.35 285/543 = 0.52
Interpretation – As per the above table Whitebread Plc have 0.35 liquid ratio and Greene king
have 0.52. Greene king have 0.17 mote than to Whitbread Plc, it shows that liquid position of
Greene king more effective to comparative Whitbread Plc. It indicates that they need more cash
and cash equivalents for strong cash position.
3. Net profit – Net profit ratio expresses the relationship between net profit after taxes and sales.
This ratio is a measure of the overall profitability net profits is arrived at after taking into account
both the operating and non operating items of expenses and income (Epstein, Buhovac and
Yuthas, 2015).
Net Profit Whitbread Plc Greene king Plc
Net profit/sales*100 438/3295*100 = 13.29 163/2177*100 = 7.48
Interpretation – As per the above calculations Greene king Plc have 7.48 and Whitebread Plc
have 13.29 net profit. It is shows that Whitebread Plc have strong financial position because it
have 5.81 more than net profit to Greene king Plc. Reason behind of this not efficient
management of business affairs of Greene king plc.
2
Paraphrase This Document
Need a fresh take? Get an instant paraphrase of this document with our AI Paraphraser
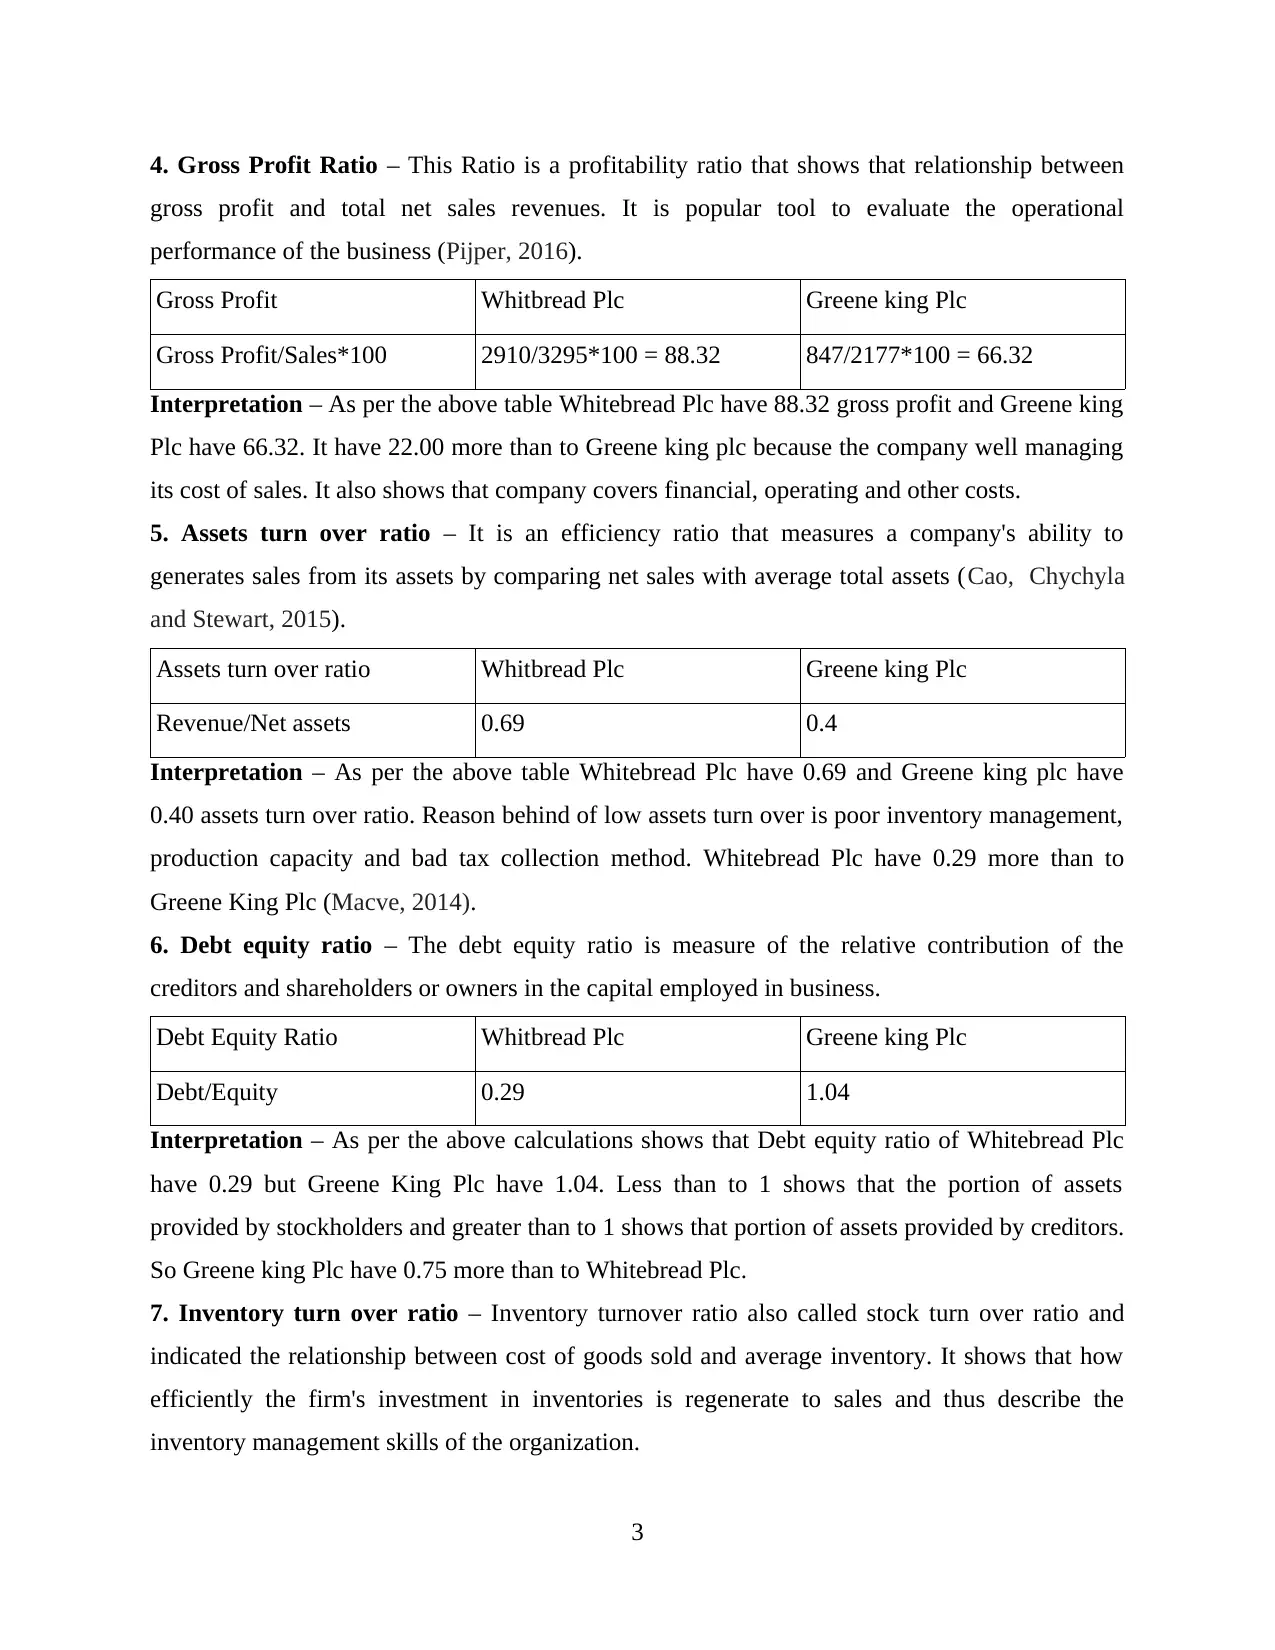
4. Gross Profit Ratio – This Ratio is a profitability ratio that shows that relationship between
gross profit and total net sales revenues. It is popular tool to evaluate the operational
performance of the business (Pijper, 2016).
Gross Profit Whitbread Plc Greene king Plc
Gross Profit/Sales*100 2910/3295*100 = 88.32 847/2177*100 = 66.32
Interpretation – As per the above table Whitebread Plc have 88.32 gross profit and Greene king
Plc have 66.32. It have 22.00 more than to Greene king plc because the company well managing
its cost of sales. It also shows that company covers financial, operating and other costs.
5. Assets turn over ratio – It is an efficiency ratio that measures a company's ability to
generates sales from its assets by comparing net sales with average total assets (Cao, Chychyla
and Stewart, 2015).
Assets turn over ratio Whitbread Plc Greene king Plc
Revenue/Net assets 0.69 0.4
Interpretation – As per the above table Whitebread Plc have 0.69 and Greene king plc have
0.40 assets turn over ratio. Reason behind of low assets turn over is poor inventory management,
production capacity and bad tax collection method. Whitebread Plc have 0.29 more than to
Greene King Plc (Macve, 2014).
6. Debt equity ratio – The debt equity ratio is measure of the relative contribution of the
creditors and shareholders or owners in the capital employed in business.
Debt Equity Ratio Whitbread Plc Greene king Plc
Debt/Equity 0.29 1.04
Interpretation – As per the above calculations shows that Debt equity ratio of Whitebread Plc
have 0.29 but Greene King Plc have 1.04. Less than to 1 shows that the portion of assets
provided by stockholders and greater than to 1 shows that portion of assets provided by creditors.
So Greene king Plc have 0.75 more than to Whitebread Plc.
7. Inventory turn over ratio – Inventory turnover ratio also called stock turn over ratio and
indicated the relationship between cost of goods sold and average inventory. It shows that how
efficiently the firm's investment in inventories is regenerate to sales and thus describe the
inventory management skills of the organization.
3
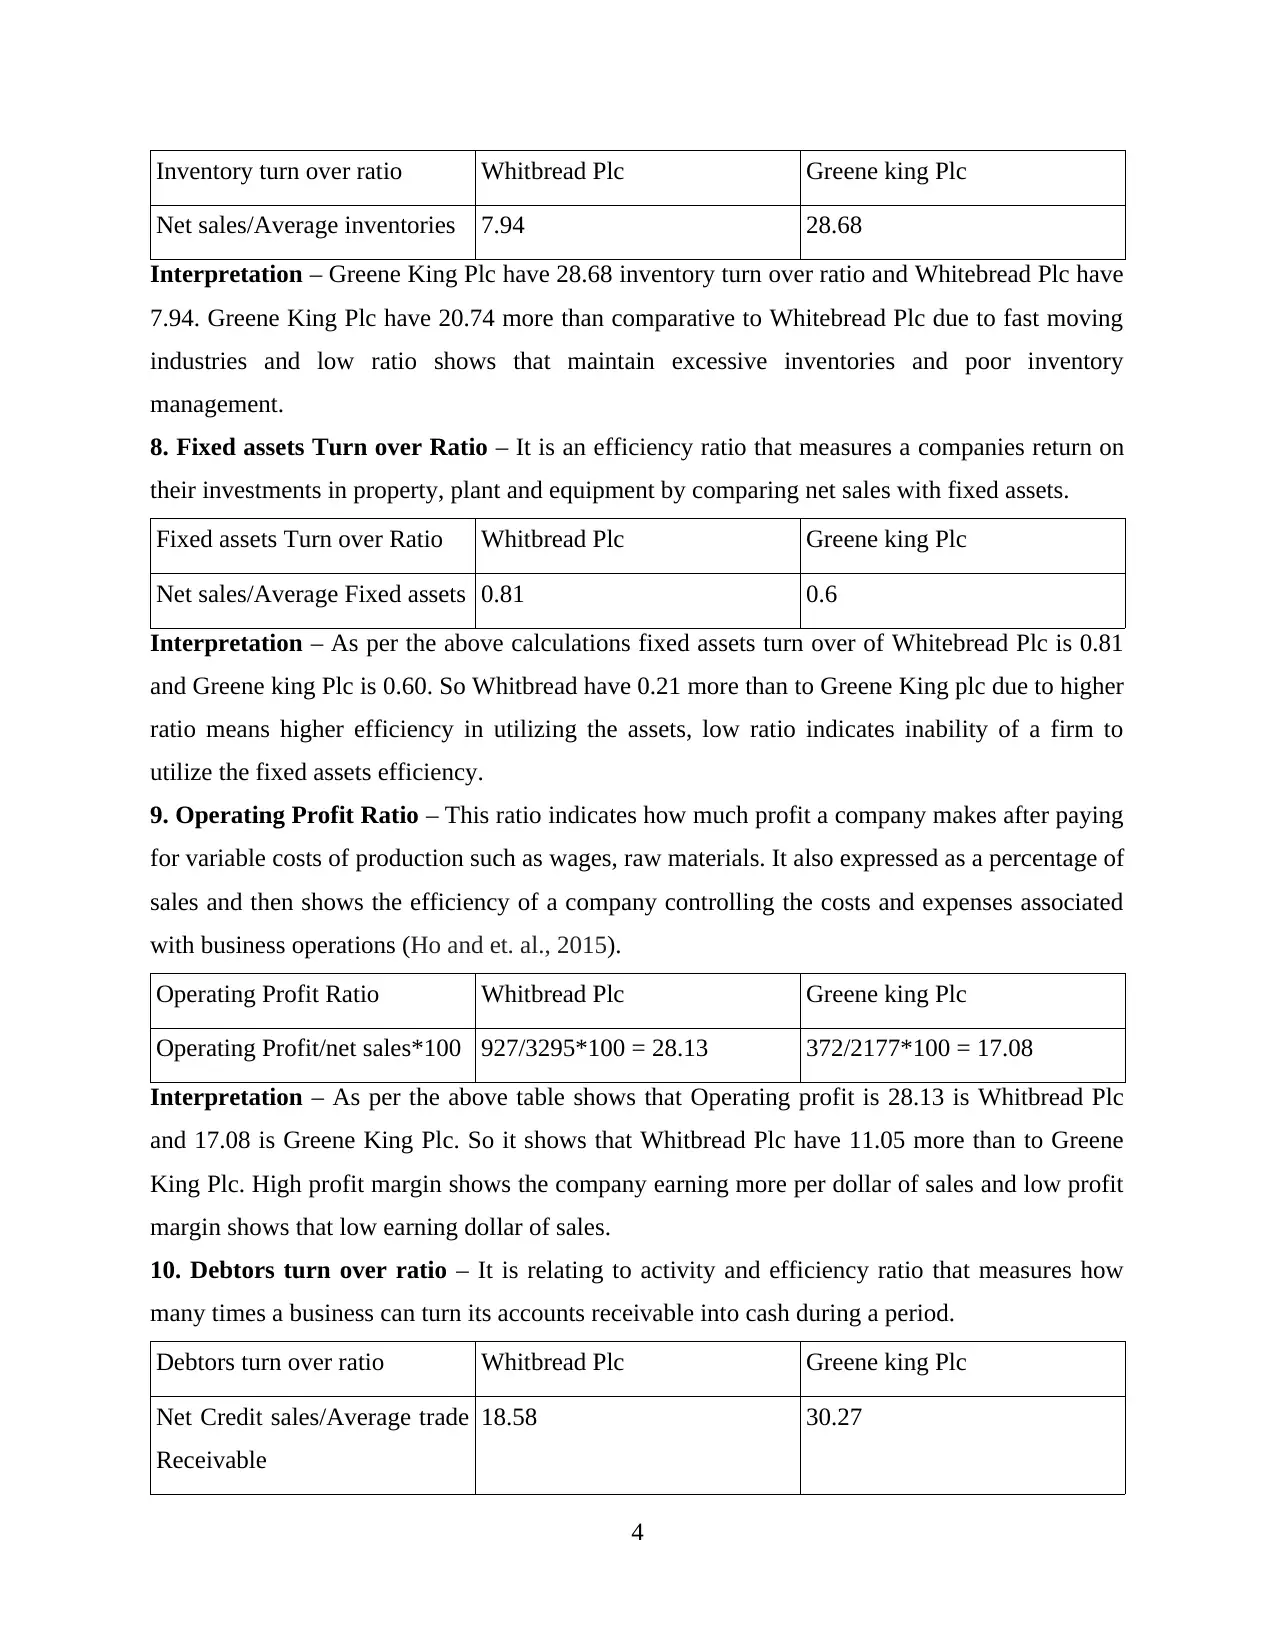
Inventory turn over ratio Whitbread Plc Greene king Plc
Net sales/Average inventories 7.94 28.68
Interpretation – Greene King Plc have 28.68 inventory turn over ratio and Whitebread Plc have
7.94. Greene King Plc have 20.74 more than comparative to Whitebread Plc due to fast moving
industries and low ratio shows that maintain excessive inventories and poor inventory
management.
8. Fixed assets Turn over Ratio – It is an efficiency ratio that measures a companies return on
their investments in property, plant and equipment by comparing net sales with fixed assets.
Fixed assets Turn over Ratio Whitbread Plc Greene king Plc
Net sales/Average Fixed assets 0.81 0.6
Interpretation – As per the above calculations fixed assets turn over of Whitebread Plc is 0.81
and Greene king Plc is 0.60. So Whitbread have 0.21 more than to Greene King plc due to higher
ratio means higher efficiency in utilizing the assets, low ratio indicates inability of a firm to
utilize the fixed assets efficiency.
9. Operating Profit Ratio – This ratio indicates how much profit a company makes after paying
for variable costs of production such as wages, raw materials. It also expressed as a percentage of
sales and then shows the efficiency of a company controlling the costs and expenses associated
with business operations (Ho and et. al., 2015).
Operating Profit Ratio Whitbread Plc Greene king Plc
Operating Profit/net sales*100 927/3295*100 = 28.13 372/2177*100 = 17.08
Interpretation – As per the above table shows that Operating profit is 28.13 is Whitbread Plc
and 17.08 is Greene King Plc. So it shows that Whitbread Plc have 11.05 more than to Greene
King Plc. High profit margin shows the company earning more per dollar of sales and low profit
margin shows that low earning dollar of sales.
10. Debtors turn over ratio – It is relating to activity and efficiency ratio that measures how
many times a business can turn its accounts receivable into cash during a period.
Debtors turn over ratio Whitbread Plc Greene king Plc
Net Credit sales/Average trade
Receivable
18.58 30.27
4
⊘ This is a preview!⊘
Do you want full access?
Subscribe today to unlock all pages.
Trusted by 1+ million students worldwide
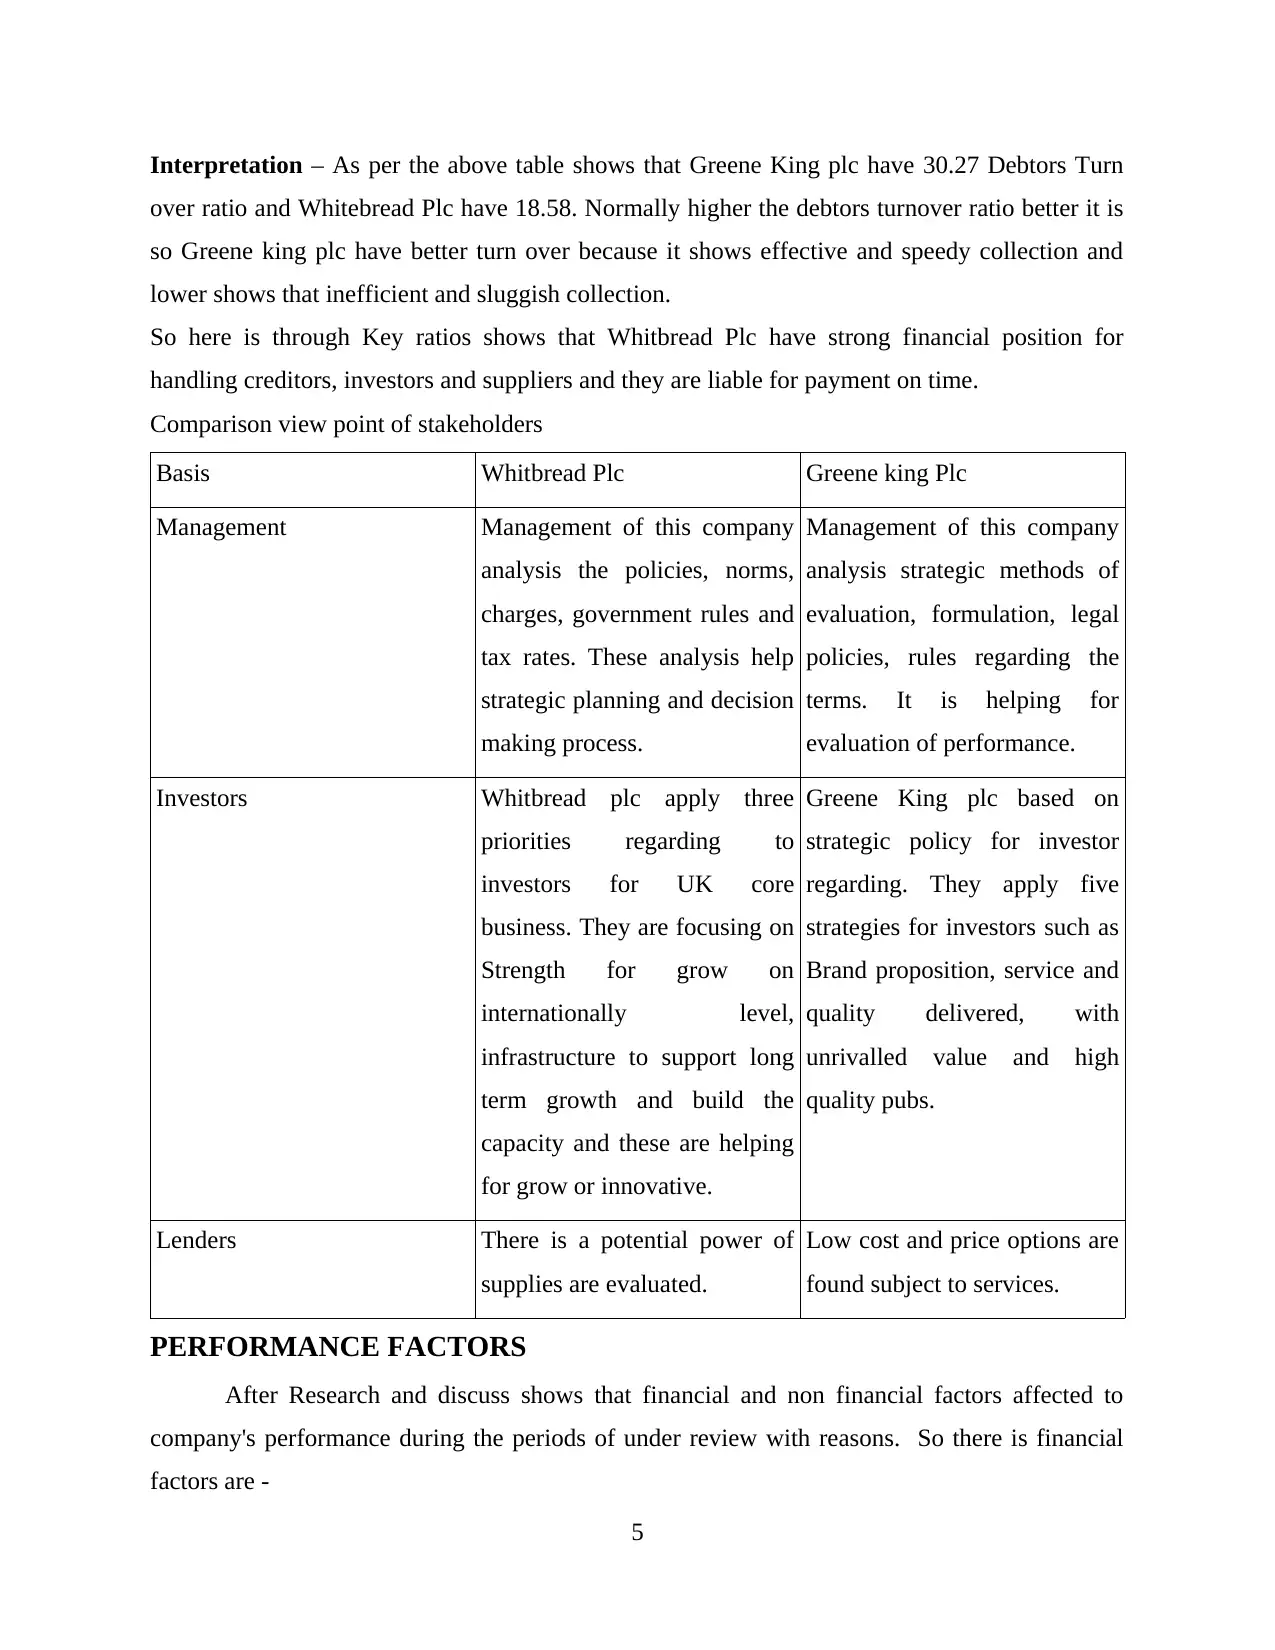
Interpretation – As per the above table shows that Greene King plc have 30.27 Debtors Turn
over ratio and Whitebread Plc have 18.58. Normally higher the debtors turnover ratio better it is
so Greene king plc have better turn over because it shows effective and speedy collection and
lower shows that inefficient and sluggish collection.
So here is through Key ratios shows that Whitbread Plc have strong financial position for
handling creditors, investors and suppliers and they are liable for payment on time.
Comparison view point of stakeholders
Basis Whitbread Plc Greene king Plc
Management Management of this company
analysis the policies, norms,
charges, government rules and
tax rates. These analysis help
strategic planning and decision
making process.
Management of this company
analysis strategic methods of
evaluation, formulation, legal
policies, rules regarding the
terms. It is helping for
evaluation of performance.
Investors Whitbread plc apply three
priorities regarding to
investors for UK core
business. They are focusing on
Strength for grow on
internationally level,
infrastructure to support long
term growth and build the
capacity and these are helping
for grow or innovative.
Greene King plc based on
strategic policy for investor
regarding. They apply five
strategies for investors such as
Brand proposition, service and
quality delivered, with
unrivalled value and high
quality pubs.
Lenders There is a potential power of
supplies are evaluated.
Low cost and price options are
found subject to services.
PERFORMANCE FACTORS
After Research and discuss shows that financial and non financial factors affected to
company's performance during the periods of under review with reasons. So there is financial
factors are -
5
Paraphrase This Document
Need a fresh take? Get an instant paraphrase of this document with our AI Paraphraser
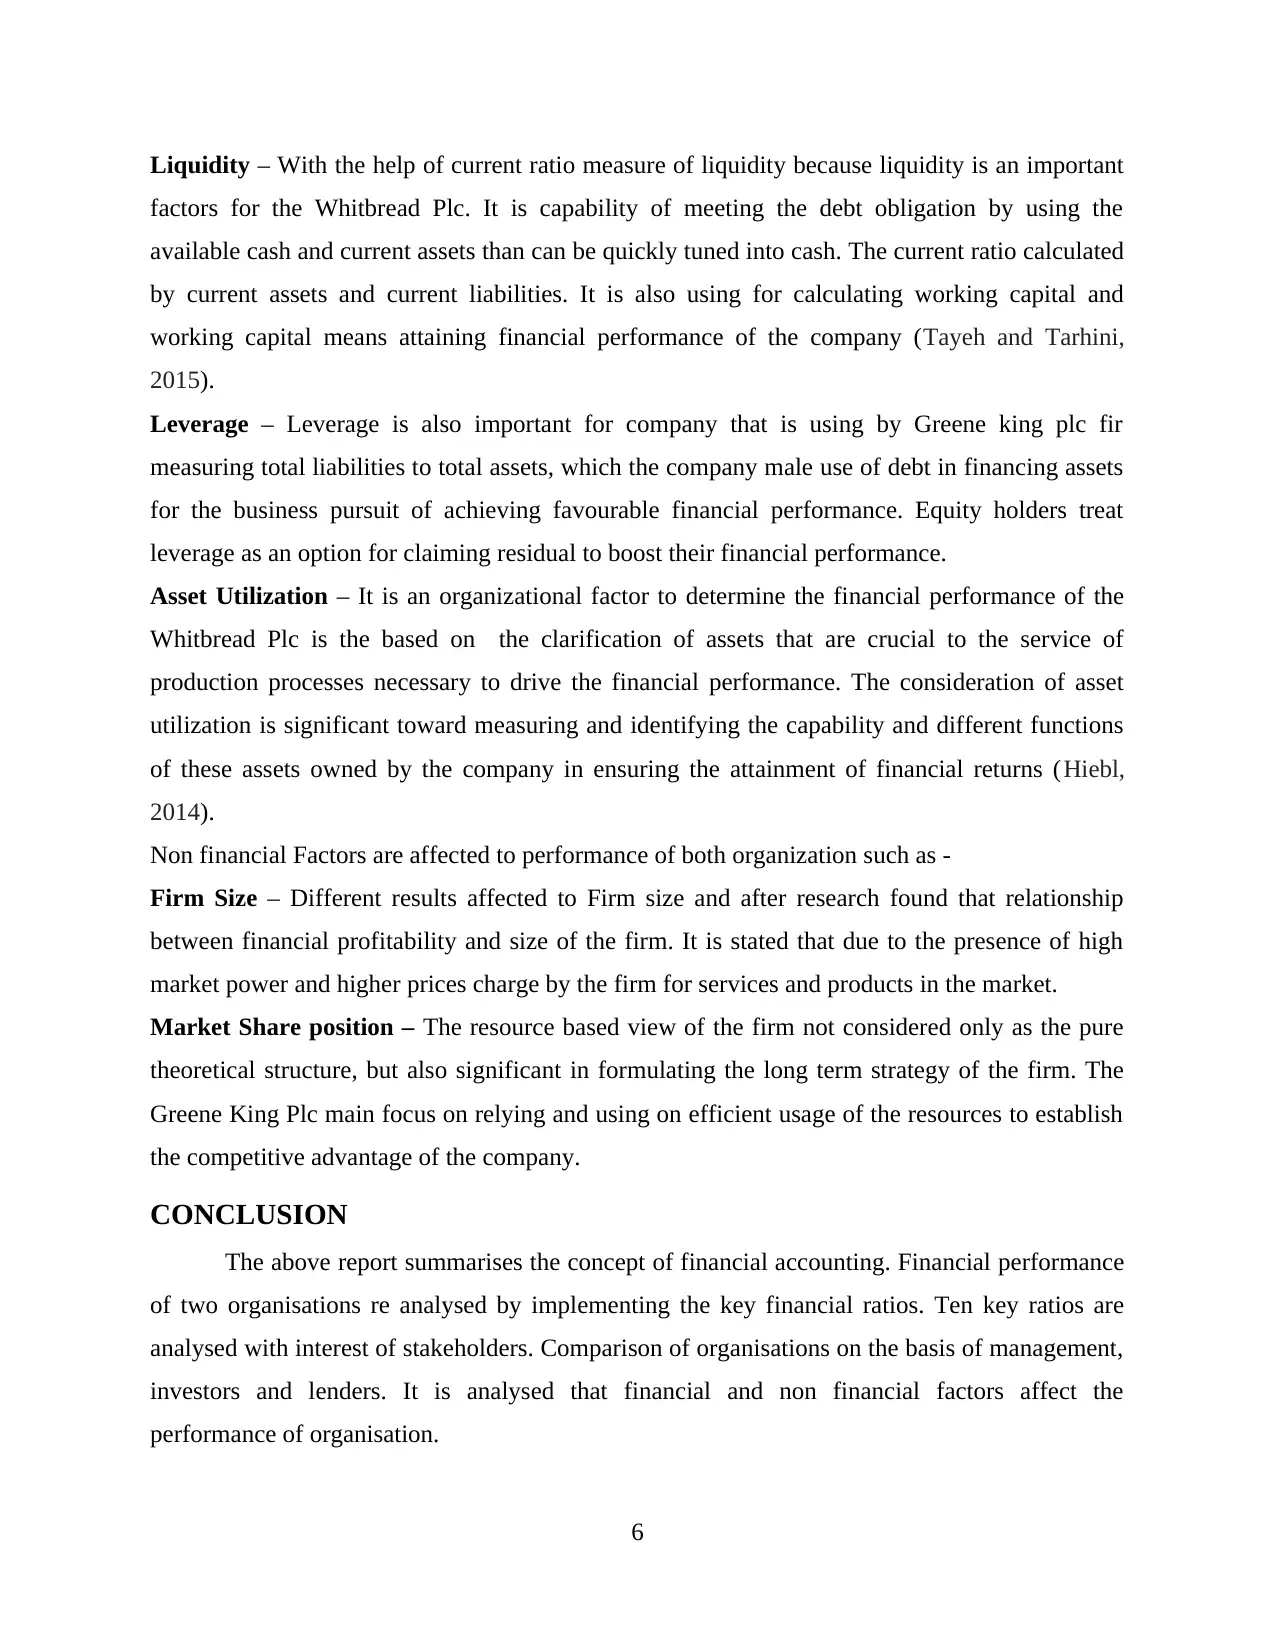
Liquidity – With the help of current ratio measure of liquidity because liquidity is an important
factors for the Whitbread Plc. It is capability of meeting the debt obligation by using the
available cash and current assets than can be quickly tuned into cash. The current ratio calculated
by current assets and current liabilities. It is also using for calculating working capital and
working capital means attaining financial performance of the company (Tayeh and Tarhini,
2015).
Leverage – Leverage is also important for company that is using by Greene king plc fir
measuring total liabilities to total assets, which the company male use of debt in financing assets
for the business pursuit of achieving favourable financial performance. Equity holders treat
leverage as an option for claiming residual to boost their financial performance.
Asset Utilization – It is an organizational factor to determine the financial performance of the
Whitbread Plc is the based on the clarification of assets that are crucial to the service of
production processes necessary to drive the financial performance. The consideration of asset
utilization is significant toward measuring and identifying the capability and different functions
of these assets owned by the company in ensuring the attainment of financial returns (Hiebl,
2014).
Non financial Factors are affected to performance of both organization such as -
Firm Size – Different results affected to Firm size and after research found that relationship
between financial profitability and size of the firm. It is stated that due to the presence of high
market power and higher prices charge by the firm for services and products in the market.
Market Share position – The resource based view of the firm not considered only as the pure
theoretical structure, but also significant in formulating the long term strategy of the firm. The
Greene King Plc main focus on relying and using on efficient usage of the resources to establish
the competitive advantage of the company.
CONCLUSION
The above report summarises the concept of financial accounting. Financial performance
of two organisations re analysed by implementing the key financial ratios. Ten key ratios are
analysed with interest of stakeholders. Comparison of organisations on the basis of management,
investors and lenders. It is analysed that financial and non financial factors affect the
performance of organisation.
6
REFERENCES
Books and Journals:
Cao, M., Chychyla, R. and Stewart, T., 2015. Big Data analytics in financial statement
audits. Accounting Horizons. 29(2). pp.423-429.
Chatfield, M. and Vangermeersch, R., 2014. The history of accounting (RLE accounting): an
international encylopedia. Routledge.
Epstein, M .J., Buhovac, A. R. and Yuthas, K., 2015. Managing social, environmental and
financial performance simultaneously. Long range planning. 48(1). pp.35-45.
Hiebl, M. R., 2014. Upper echelons theory in management accounting and control
research. Journal of Management Control. 24(3). pp.223-240.
Ho, S .S. and et. al., 2015. CEO gender, ethical leadership, and accounting conservatism. Journal
of Business Ethics. 127(2). pp.351-370.
Ikbal, O. and Al-Qdau, M., 2014. The impact of the financial crisis to support the accounting
conservatism policy: A study in the Jordanian industrial corporations. An-Najah
University Journal for Research. 4. pp.896-920.
Li, X., 2015. Accounting conservatism and the cost of capital: An international analysis. Journal
of Business Finance & Accounting. 42(5-6). pp.555-582.
Macve, R., 2014. “Trading Places”: A UK (and IFRS) Comment. Accounting, Economics and
Law Account. Econ. Law. 4(1). pp.27-40.
Pijper, T., 2016. Creative accounting: The effectiveness of financial reporting in the UK.
Springer.
Tayeh, M., Al-Jarrah, I.M. and Tarhini, A., 2015. Accounting vs. market-based measures of firm
performance related to information technology investments. International Review of
Social Sciences and Humanities. 9(1). pp.129-145.
Online
Financial data of WTB plc, 2018. [online]. Available
through:<https://www.morningstar.com/stocks/xlon/wtb/quote.html>.
⊘ This is a preview!⊘
Do you want full access?
Subscribe today to unlock all pages.
Trusted by 1+ million students worldwide
1 out of 9
Related Documents


Your All-in-One AI-Powered Toolkit for Academic Success.
+13062052269
info@desklib.com
Available 24*7 on WhatsApp / Email
![[object Object]](/_next/static/media/star-bottom.7253800d.svg)
Unlock your academic potential
Copyright © 2020–2026 A2Z Services. All Rights Reserved. Developed and managed by ZUCOL.