Finance Report: Comparative Ratio Analysis of Theme Parks (2015-2016)

Verified

Added on  2023/01/19

|8
|600
|499
Report
AI Summary
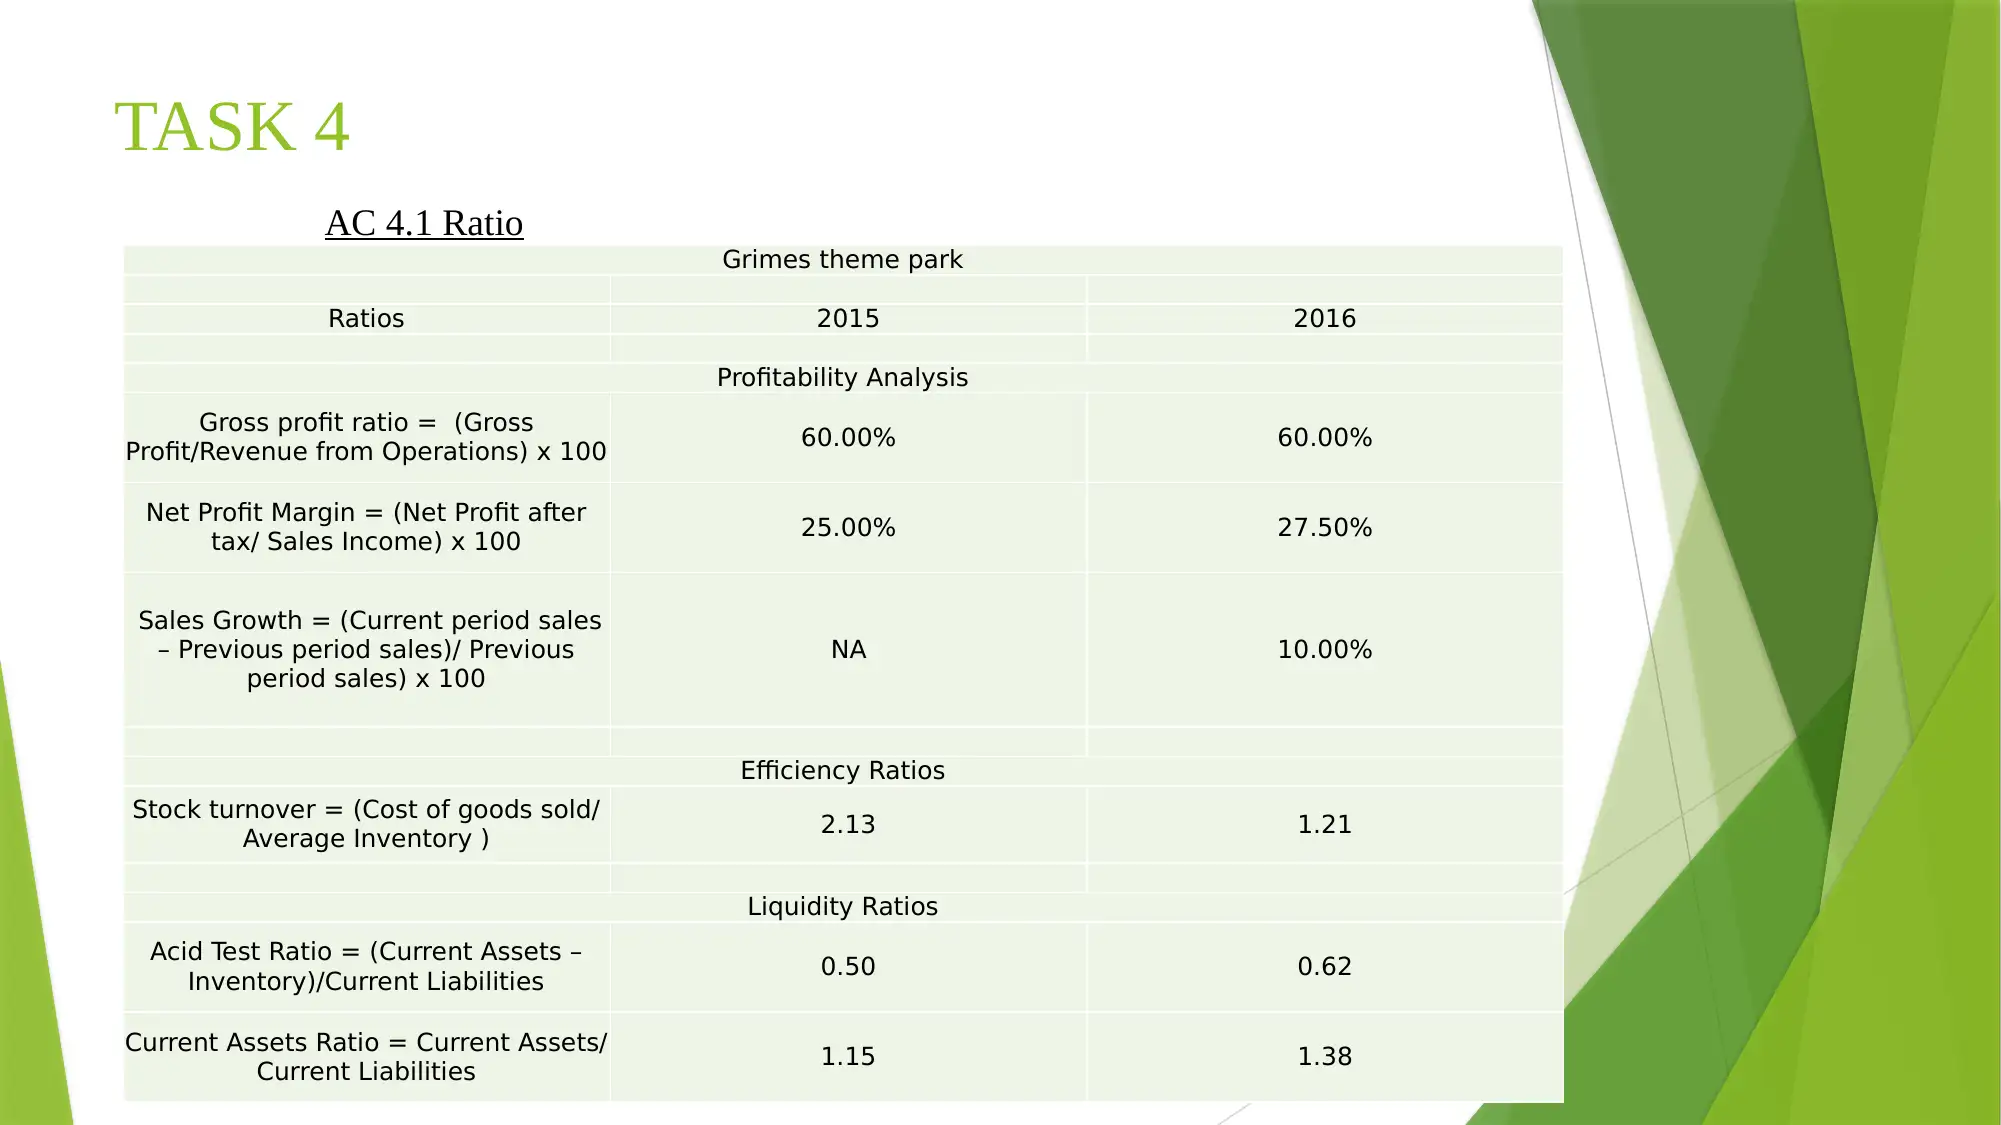
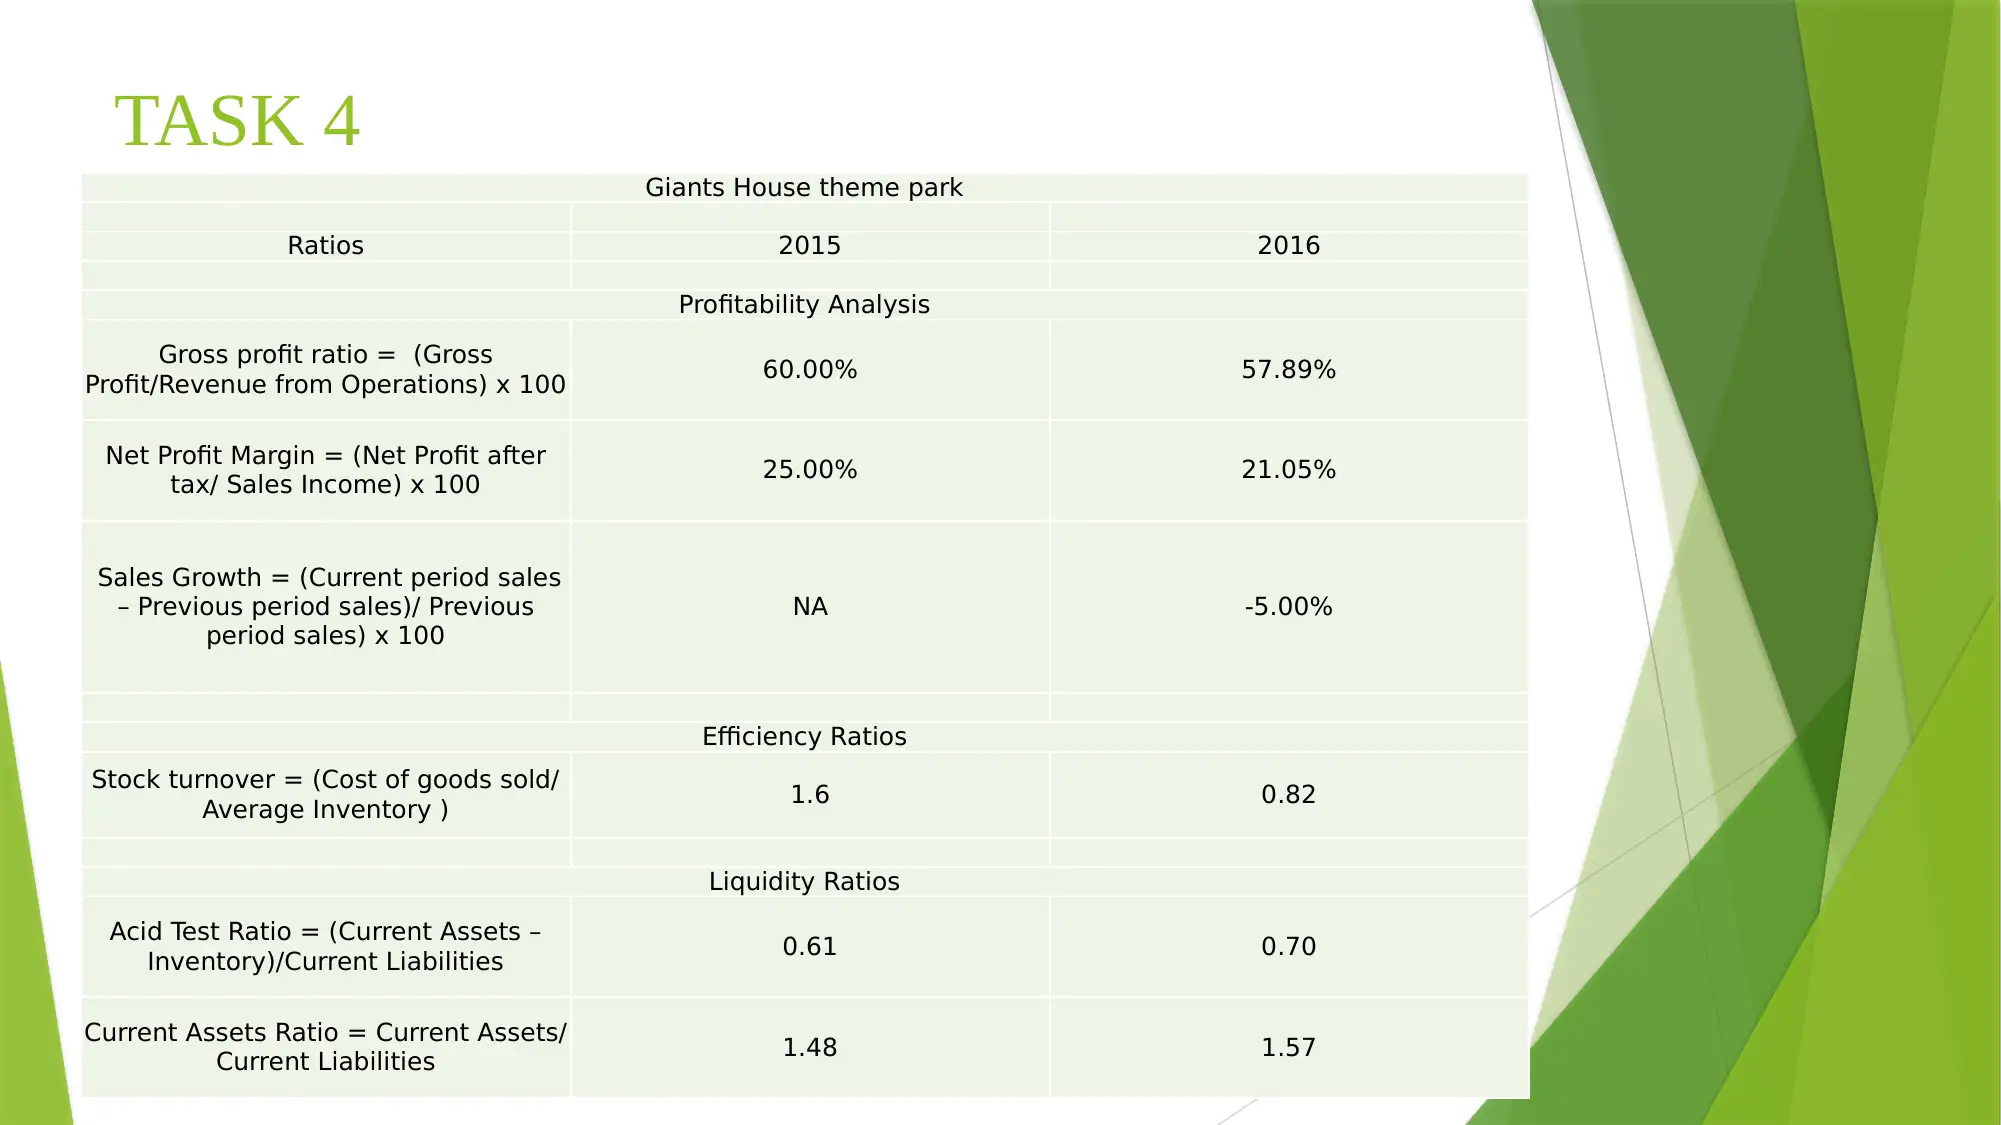
This report presents a financial ratio analysis of two theme parks, Grimes and Giants House, comparing their performance in 2015 and 2016. The analysis encompasses profitability ratios (gross profit margin, net profit margin, and sales growth), efficiency ratios (stock turnover), and liquidity ratios (acid test ratio and current assets ratio). The report interprets the financial data, highlighting the strengths and weaknesses of each theme park. Grimes demonstrates improved profitability and sales growth, while Giants House exhibits a decline in financial performance. The report concludes with recommendations for management strategies, emphasizing the importance of financial planning, resource allocation, and continuous performance analysis. The report cites relevant academic sources and online resources to support the analysis and recommendations.
Document Page
Finance in the Hospitality
Industry
tabler-icon-diamond-filled.svg

Paraphrase This Document

Need a fresh take? Get an instant paraphrase of this document with our AI Paraphraser
Document Page
TASK 4
Grimes theme park
Ratios 2015 2016
Profitability Analysis
Gross profit ratio = (Gross
Profit/Revenue from Operations) x 100 60.00% 60.00%
Net Profit Margin = (Net Profit after
tax/ Sales Income) x 100 25.00% 27.50%
Sales Growth = (Current period sales
– Previous period sales)/ Previous
period sales) x 100
NA 10.00%
Efficiency Ratios
Stock turnover = (Cost of goods sold/
Average Inventory ) 2.13 1.21
Liquidity Ratios
Acid Test Ratio = (Current Assets –
Inventory)/Current Liabilities 0.50 0.62
Current Assets Ratio = Current Assets/
Current Liabilities 1.15 1.38
AC 4.1 Ratio
Document Page
Interpretation
In case of Grimes theme park, as per the profitability aspect the company is performing in
effective manner with increase in its net profit margin from 25% to 27.50% in the year
2016. Also, its sales has been increased by 10%.
As per the profitability ratio, it can be assessed that Grimes is capable enough of
converting its sales into profit margin effectively.
Document Page
TASK 4 Giants House theme park
Ratios 2015 2016
Profitability Analysis
Gross profit ratio = (Gross
Profit/Revenue from Operations) x 100 60.00% 57.89%
Net Profit Margin = (Net Profit after
tax/ Sales Income) x 100 25.00% 21.05%
Sales Growth = (Current period sales
– Previous period sales)/ Previous
period sales) x 100
NA -5.00%
Efficiency Ratios
Stock turnover = (Cost of goods sold/
Average Inventory ) 1.6 0.82
Liquidity Ratios
Acid Test Ratio = (Current Assets –
Inventory)/Current Liabilities 0.61 0.70
Current Assets Ratio = Current Assets/
Current Liabilities 1.48 1.57
tabler-icon-diamond-filled.svg

Paraphrase This Document

Need a fresh take? Get an instant paraphrase of this document with our AI Paraphraser
Document Page
Interpretation
After calculating financial ratios of Giants House theme park, it has been evaluated that
the company's business as well as financial performance is decreasing in terms of
profitability scenario. There has been decline in its gross profit from 60% to 57.89% and
net profit ratio from 25% to 21.05% in the year 2016.
Document Page
TASK 4
AC 4.2 Recommendation
Management strategy in relation to conducting of future business operations in
smooth manner, it is very much essential for the business firm to formulate sound
business plans and policies in line with business aims and objectives. Following are
recommendation:
Before implementing any strategy or plan, it is very much important to first analyse the
current financial as well as business performance level of the company with the help of
profitability ratio, liquidity norms, solvency ratio (Penman, 2015).
Management must ensure availability of enough financial resources with the business
and its proper allocation as per financial plan formed.
Document Page
REFERENCES
Books and Journals
Arkan, T., 2016. The importance of financial ratios in predicting stock price trends: A case
study in emerging markets. Finanse, Rynki Finansowe, Ubezpieczenia. 79(1). pp.13-26.
Meriç, E., Kamışlı, M. and Temizel, F., 2017. Interactions among Stock Price and Financial
Ratios: The Case of Turkish Banking Sector. Applied Economics and Finance. 4(6). pp.107-
115.
Penman, S. H., 2015. Financial Ratios and Equity Valuation. Wiley Encyclopedia of
Management, pp.1-7.
Online
Future Management strategies. 2018. [Online]. Available through: <
https://www.tools-and-techniques.24xls.com/en201>.
tabler-icon-diamond-filled.svg

Paraphrase This Document

Need a fresh take? Get an instant paraphrase of this document with our AI Paraphraser
Document Page
chevron_up_icon
1 out of 8
circle_padding
hide_on_mobile
zoom_out_icon
[object Object]