Financial Analysis of Tesco: A Detailed Ratio Performance Report
VerifiedAdded on 2021/02/19
|8
|717
|90
Report
AI Summary
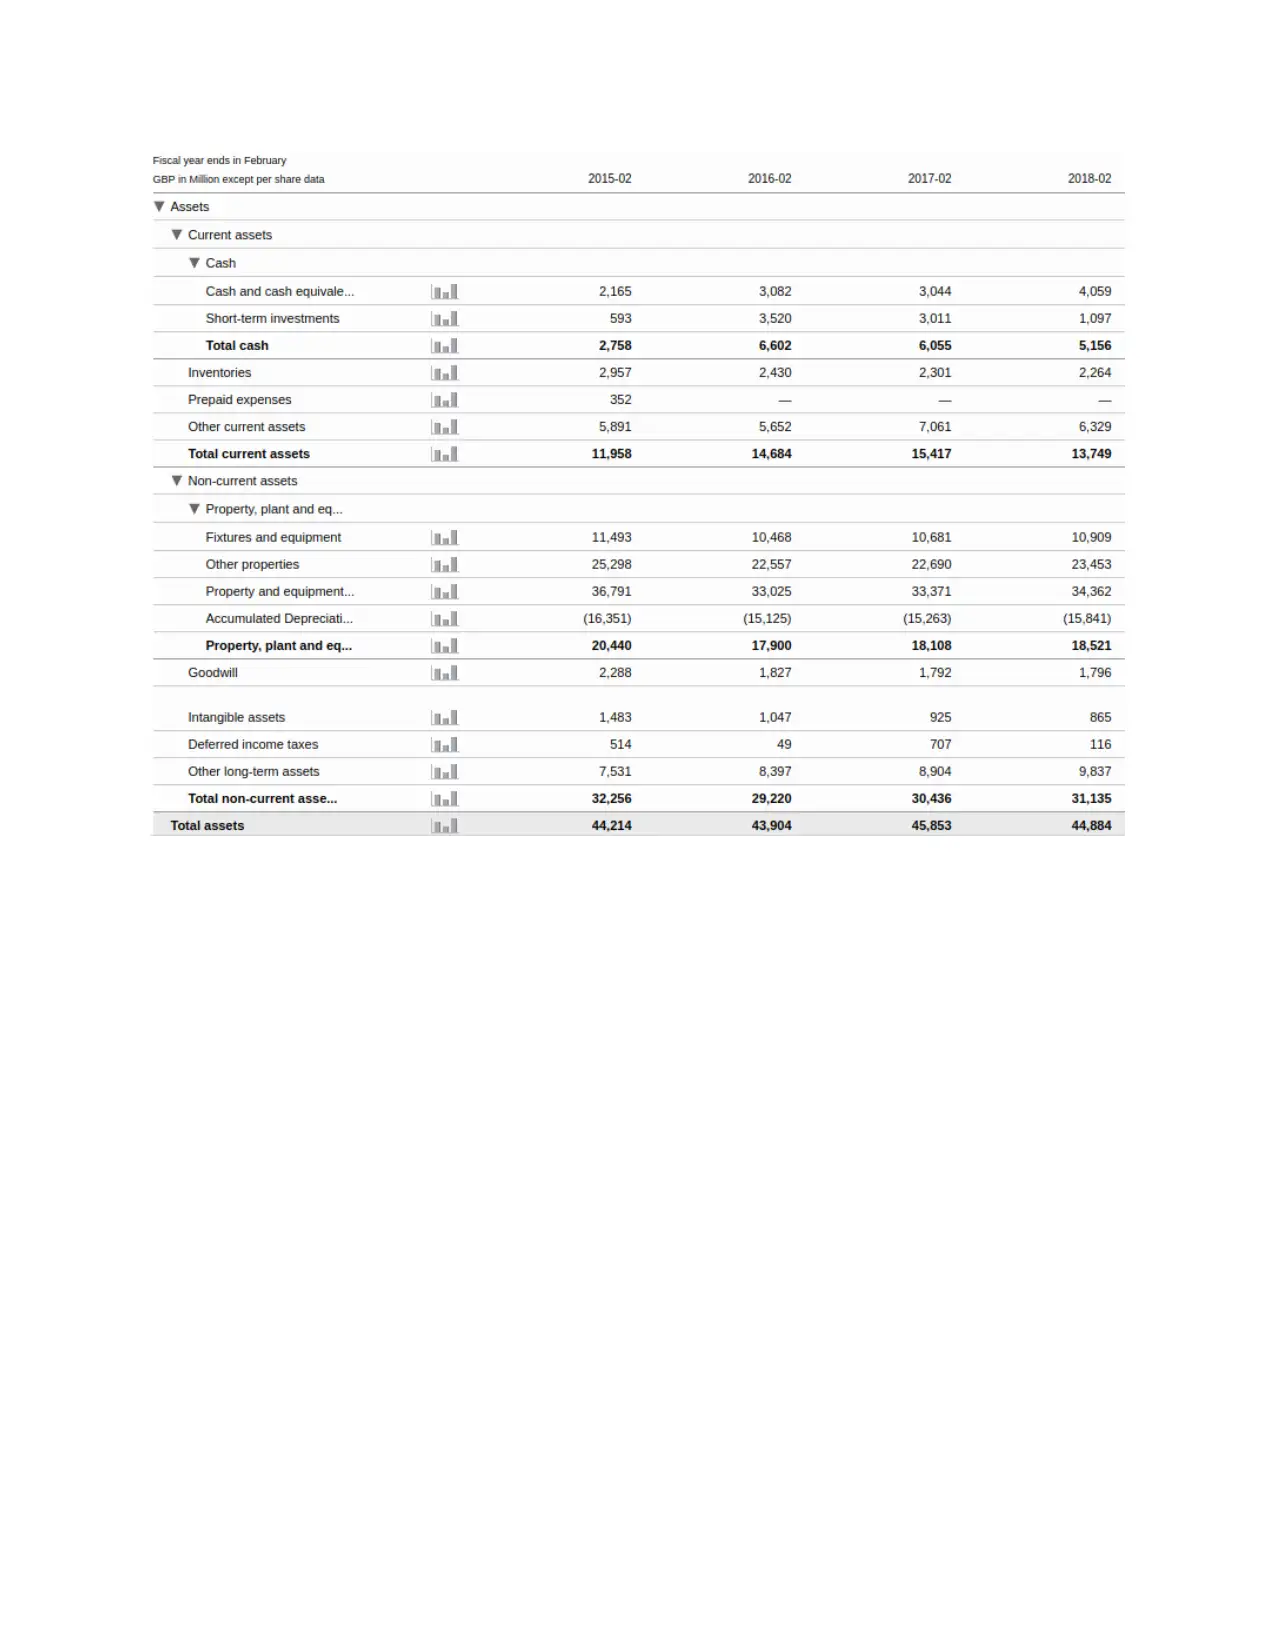
This report provides a financial analysis of Tesco, examining key financial ratios to assess its performance in 2017 and 2018. The analysis includes profitability ratios like operating profit margin, efficiency ratios such as sales revenue to capital employed, and liquidity ratios like the current ratio. Investment ratios, including Earnings Per Share (EPS), are also evaluated. The report highlights the trends and limitations of these ratios, offering insights into Tesco's financial health, and concluding with a summary of the findings. The study utilizes data from Tesco's financial reports, providing a comprehensive overview of the company's financial position and performance metrics.

Financial Analysis
Paraphrase This Document
Need a fresh take? Get an instant paraphrase of this document with our AI Paraphraser

Table of Contents
INTRODUCTION...........................................................................................................................3
TASK...............................................................................................................................................3
CONCLUSION................................................................................................................................4
REFERENCES................................................................................................................................5
ANNEXURE....................................................................................................................................6

INTRODUCTION
Financial Ratios defines actual fiscal position of business organisation. They help in
critical business-decisions. This report contains financial ratios of Tesco to describe liquidity,
financial viability, profitability, solvency and other performance goals.
TASK
A financial ratio reflects statistical manifestation that shows a connection between two
autonomous or linked figures of accounting (Hoesli and MacGregor, 2014). These ratios are
measured on the grounds of annual reports collected financial reporting data. In this context
following are key-financial ratios of Tesco, as follows:
Profitability Ratios demonstrates organisation's actual periodic profitability situations of
a business enterprise. Following is one of the major profitability ratio of Tesco as follows:
Operating Profit Ratio: This shows the firm's working effectiveness – how well its
primary processes can transform the firm's revenues into earnings by its everyday activities.
Operating Profit Margin= Operating Profit/ Turnover *100
2018 2017
Operating Profit 1564 1168
Turnover 57491 55917
Operating Profit Margin 2.72 2.09
Above table display that Tesco's earning through its main business activities has been
increased as margin in 2017 was 2.09% which has been reached at 2.72% in 2018.
Efficiency Ratios outline the effectiveness of fund generating operations of an enterprise
and how effectively it utilizes and regulates its resources and assets like different inventories.
Here is one key efficiency ratio of Tesco Plc, as follows:
Sales Revenue to Capital Employed Ratio of a company express the sales income of
the enterprise as a proportion of its capital funds to evaluate the sales income produced by each
dollar of the resources engaged in the company.
Sales Revenue to Capital Employed Ratio = Sales / Capital Employed
2018 2017
Turnover 57491 55917
Capital Employed 10480 6438
⊘ This is a preview!⊘
Do you want full access?
Subscribe today to unlock all pages.

Trusted by 1+ million students worldwide

Sales Revenue to Capital Employed Ratio 5.48 8.69
Table exhibits that Tesco's efficiency to generate income on employed in business has
been declined since company's ratio has been declined from 8.69 in 2017 to 5.48 in 2018.
Liquidity Ratio: Liquidity ratios assess the potential of the business to fulfil its small-
term (liquid) debts. Following is one of the significant liquidity ratio in context of company
Tesco, as follows:
Current Ratio demonstrates whether company has sufficient current assets to fulfil its
present loan repayment with a margin of security for potential losses in present assets, such as
stock deformation or accounts receivables (Harris, 2017).
Current Ratio = All Current Assets / All Current Liabilities
Year 2018 2017
Current Assets 13726 15417
Current Liabilities 19238 19405
Current Ratio 0.71 0.79
Investment Ratio is a ratio of the sum of money spent to the profits generated from it.
Below is one of the major investment ratio of Tesco as follows:
EPS indicates how much share company is providing to its shareholders in company's
total turnover.
Earning Per Share = Net Profit / Weighted Average Number of Share
2018 2017
Net Profit 1206 -40
Weighted Average Number of Share 2741 4000
EPS 0.44 -0.01
Above table is showing that EPS of Tesco is increased as company has achieved net
profit in year 2018 and EPS has increased - 0.01 to 0.44 in year 2018.
Limitation of Financial Ratios:
Major limitation of such ratio are ignorance of factors like size of business, contingent
liability, uniform accounting policies, Inflation impacts, market condition, seasonality impact
etc. Also these ratio are not suitable for comparison of different industries, based on historical
data,
Paraphrase This Document
Need a fresh take? Get an instant paraphrase of this document with our AI Paraphraser

CONCLUSION
From above assessment it has been concluded that for financial analysis use of financial
ratio provides more clarity in presentation of analysis report.
From above assessment it has been concluded that for financial analysis use of financial
ratio provides more clarity in presentation of analysis report.

REFERENCES
Books and Journals:
Hoesli, M. and MacGregor, B.D., 2014. Property investment: principles and practice of portfolio
management. Routledge.
Harris, E., 2017. Strategic project risk appraisal and management. Routledge.
Books and Journals:
Hoesli, M. and MacGregor, B.D., 2014. Property investment: principles and practice of portfolio
management. Routledge.
Harris, E., 2017. Strategic project risk appraisal and management. Routledge.
⊘ This is a preview!⊘
Do you want full access?
Subscribe today to unlock all pages.

Trusted by 1+ million students worldwide

ANNEXURE
Paraphrase This Document
Need a fresh take? Get an instant paraphrase of this document with our AI Paraphraser

1 out of 8
Related Documents

Your All-in-One AI-Powered Toolkit for Academic Success.
+13062052269
info@desklib.com
Available 24*7 on WhatsApp / Email
Unlock your academic potential
Copyright © 2020–2025 A2Z Services. All Rights Reserved. Developed and managed by ZUCOL.