Tesco & Sainsbury: A Financial Performance and Ratio Analysis
VerifiedAdded on 2023/01/04
|15
|3727
|69
Report
AI Summary
This report provides a comprehensive financial analysis of Tesco and Sainsbury, two major UK retailers, using various financial ratios to assess their performance. The analysis covers key metrics such as current ratio, quick ratio, net profit margin, gross profit margin, gearing ratio, price earnings ratio, earnings per share, return on capital employed, stock turnover ratio, and dividend pay-out ratio. The report compares the financial health and investment potential of both companies, concluding that Sainsbury currently offers a better investment opportunity due to higher sales rates and dividend payouts. The report also explores the limitations of using financial ratios for performance measurement and suggests strategies for Tesco to improve its financial performance. Capital budgeting techniques and their limitations are also discussed in the context of investment decision-making. Desklib offers a wealth of similar solved assignments and resources for students.

MANAGERIAL
FINANCE
FINANCE
Paraphrase This Document
Need a fresh take? Get an instant paraphrase of this document with our AI Paraphraser
Contents
INTRODUCTION...........................................................................................................................3
PORTFOLIO 1................................................................................................................................3
a. calculation of ratio...................................................................................................................3
b. Analysis of financial performance of Tesco & Sainsbury.......................................................6
c. Reason of poor performance of business.................................................................................8
d. Limitations of measuring financial performance by using financial ratio method..................9
PORTFOLIO 2..............................................................................................................................10
a. Use of capital budgeting technique for taking investment decision......................................10
b. Limitations of investment appraisal techniques....................................................................13
CONCLUSION..............................................................................................................................14
REFERENCES..............................................................................................................................16
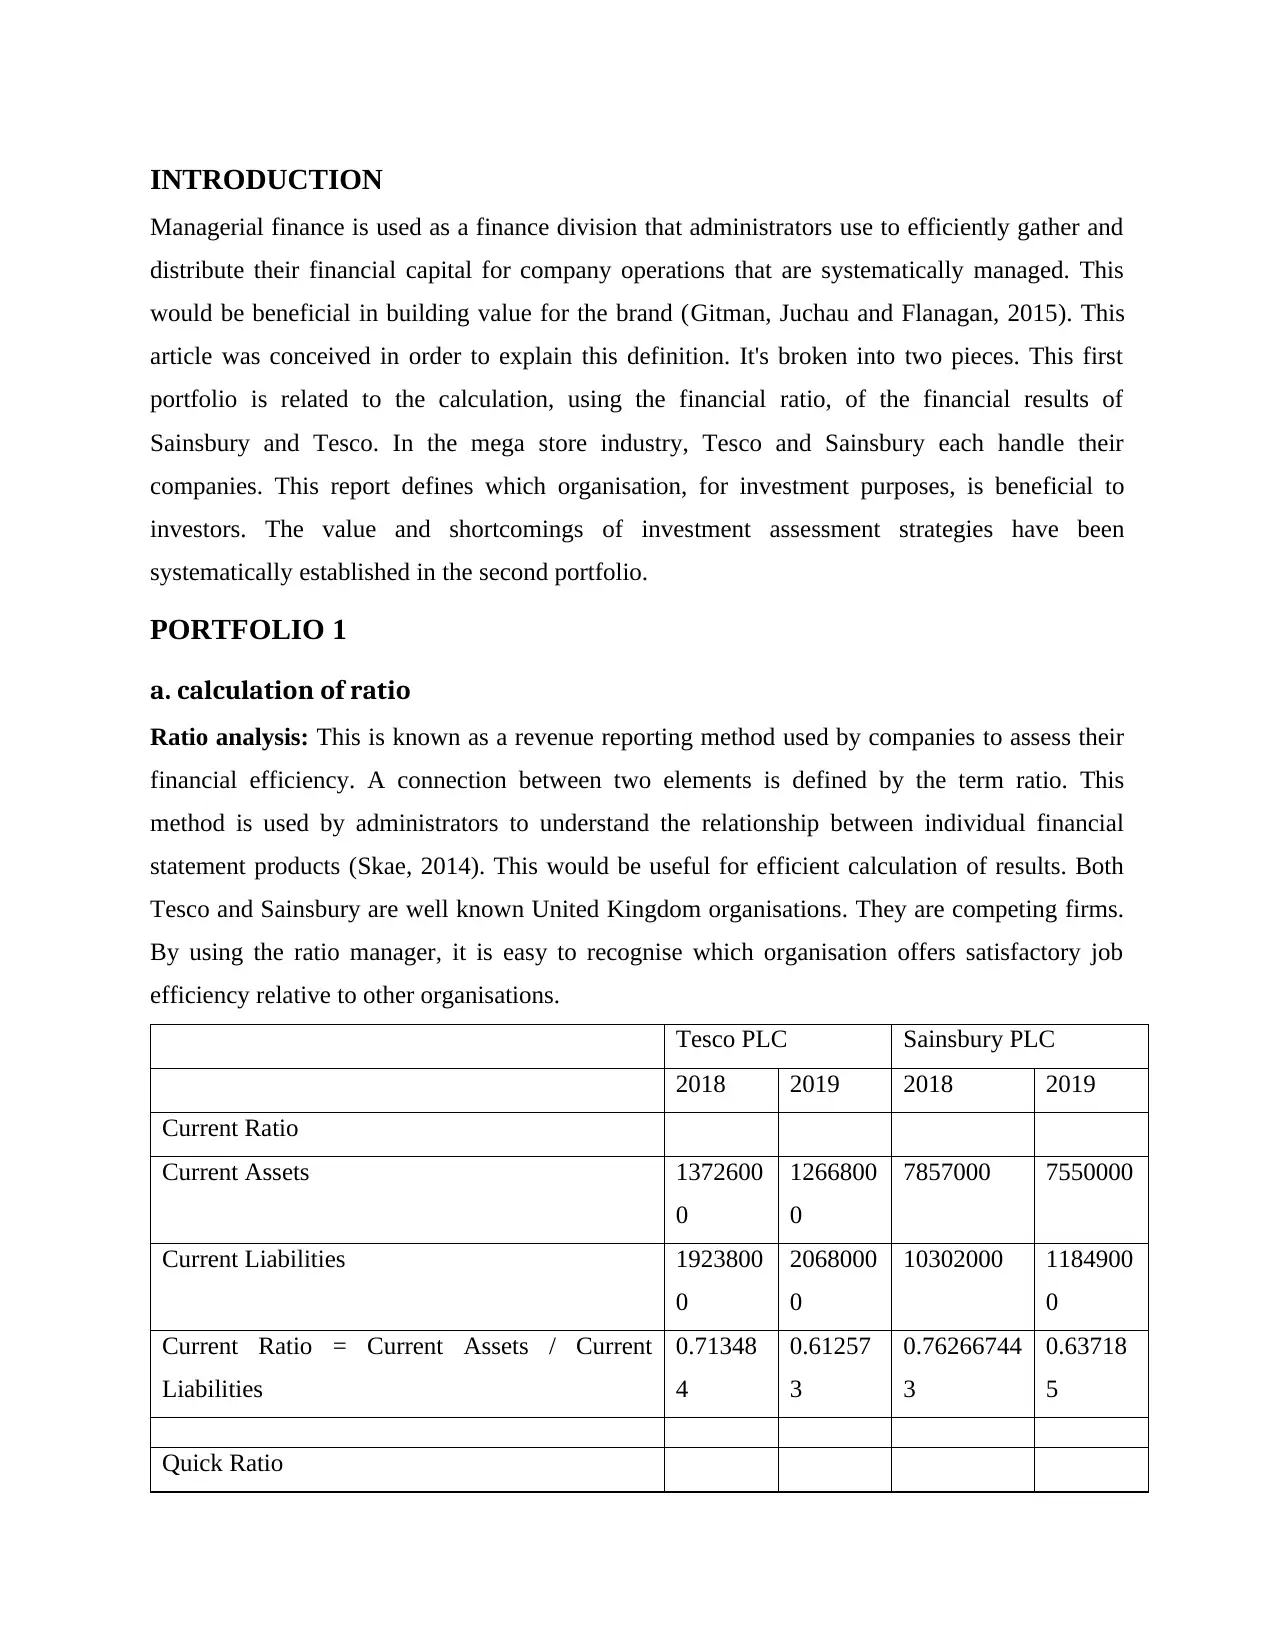
INTRODUCTION
Managerial finance is used as a finance division that administrators use to efficiently gather and
distribute their financial capital for company operations that are systematically managed. This
would be beneficial in building value for the brand (Gitman, Juchau and Flanagan, 2015). This
article was conceived in order to explain this definition. It's broken into two pieces. This first
portfolio is related to the calculation, using the financial ratio, of the financial results of
Sainsbury and Tesco. In the mega store industry, Tesco and Sainsbury each handle their
companies. This report defines which organisation, for investment purposes, is beneficial to
investors. The value and shortcomings of investment assessment strategies have been
systematically established in the second portfolio.
PORTFOLIO 1
a. calculation of ratio
Ratio analysis: This is known as a revenue reporting method used by companies to assess their
financial efficiency. A connection between two elements is defined by the term ratio. This
method is used by administrators to understand the relationship between individual financial
statement products (Skae, 2014). This would be useful for efficient calculation of results. Both
Tesco and Sainsbury are well known United Kingdom organisations. They are competing firms.
By using the ratio manager, it is easy to recognise which organisation offers satisfactory job
efficiency relative to other organisations.
Tesco PLC Sainsbury PLC
2018 2019 2018 2019
Current Ratio
Current Assets 1372600
0
1266800
0
7857000 7550000
Current Liabilities 1923800
0
2068000
0
10302000 1184900
0
Current Ratio = Current Assets / Current
Liabilities
0.71348
4
0.61257
3
0.76266744
3
0.63718
5
Quick Ratio
⊘ This is a preview!⊘
Do you want full access?
Subscribe today to unlock all pages.
Trusted by 1+ million students worldwide
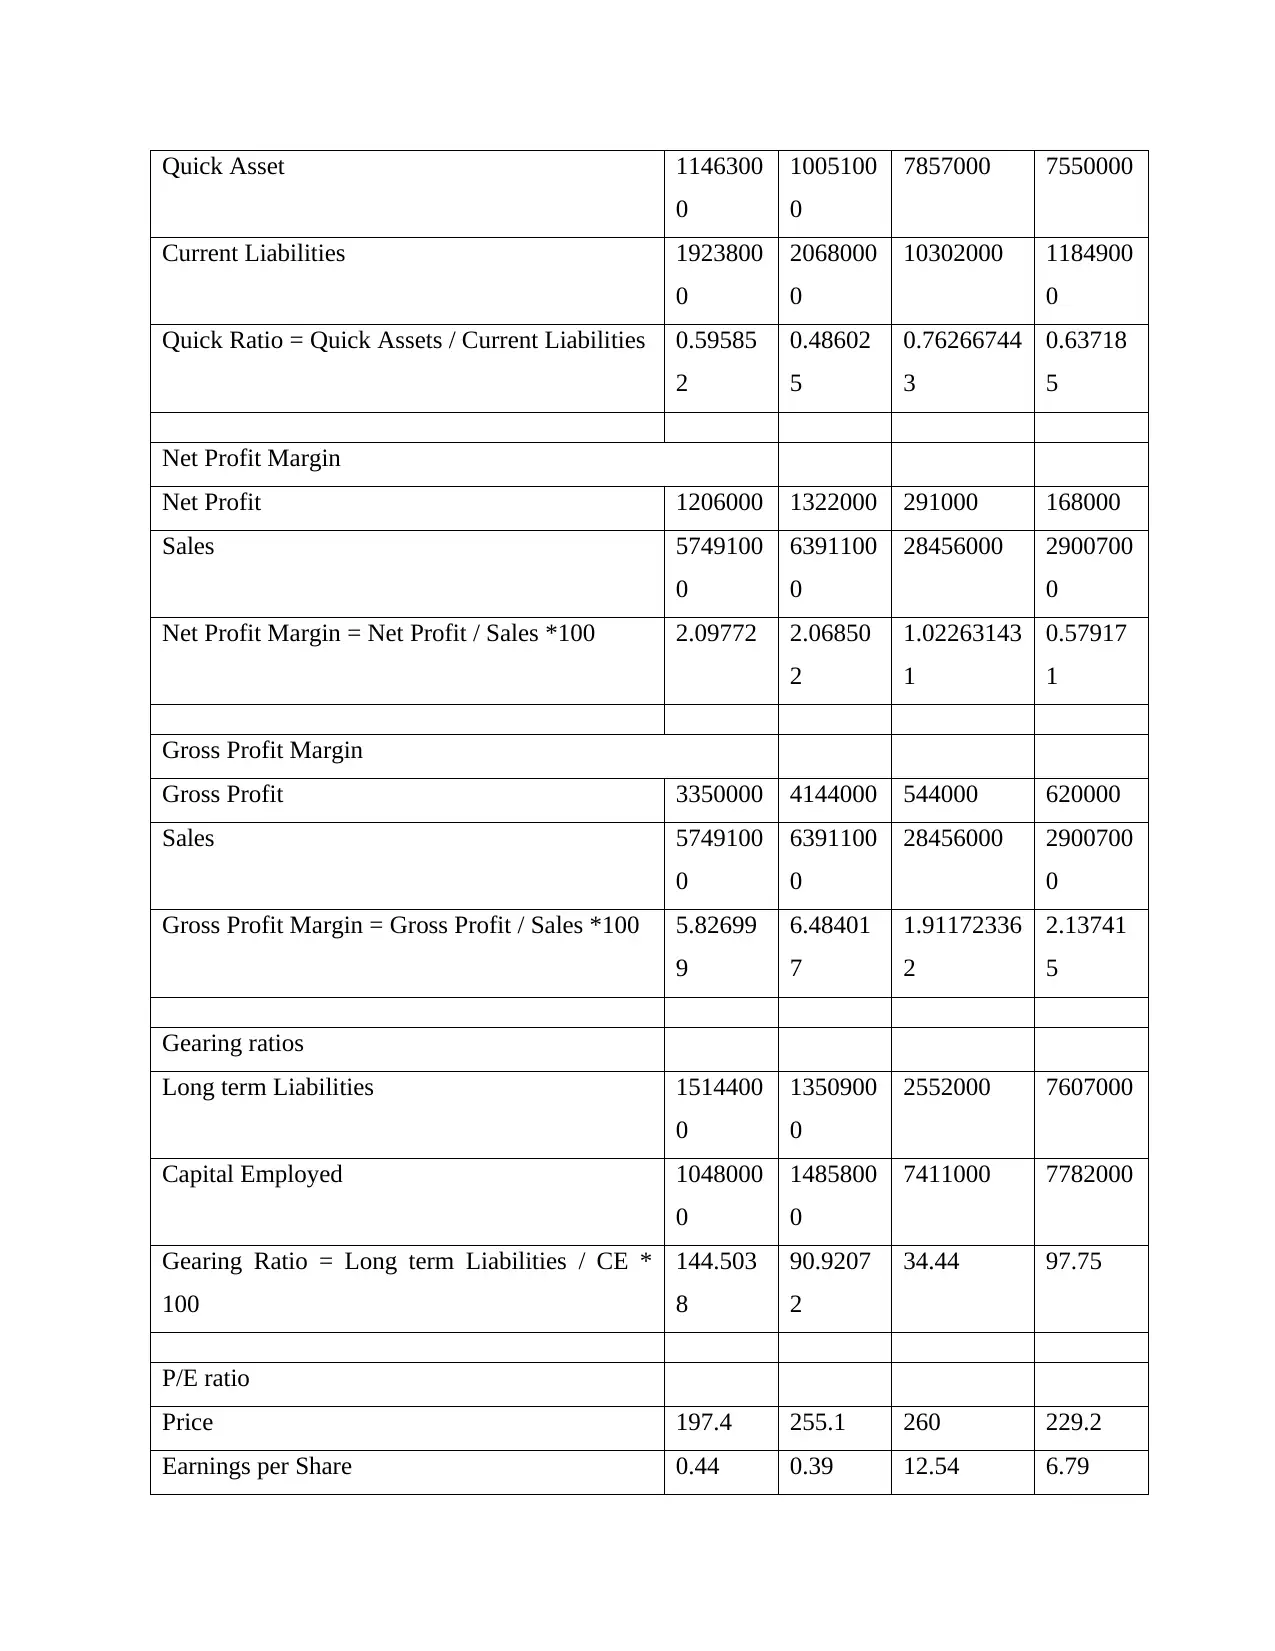
Quick Asset 1146300
0
1005100
0
7857000 7550000
Current Liabilities 1923800
0
2068000
0
10302000 1184900
0
Quick Ratio = Quick Assets / Current Liabilities 0.59585
2
0.48602
5
0.76266744
3
0.63718
5
Net Profit Margin
Net Profit 1206000 1322000 291000 168000
Sales 5749100
0
6391100
0
28456000 2900700
0
Net Profit Margin = Net Profit / Sales *100 2.09772 2.06850
2
1.02263143
1
0.57917
1
Gross Profit Margin
Gross Profit 3350000 4144000 544000 620000
Sales 5749100
0
6391100
0
28456000 2900700
0
Gross Profit Margin = Gross Profit / Sales *100 5.82699
9
6.48401
7
1.91172336
2
2.13741
5
Gearing ratios
Long term Liabilities 1514400
0
1350900
0
2552000 7607000
Capital Employed 1048000
0
1485800
0
7411000 7782000
Gearing Ratio = Long term Liabilities / CE *
100
144.503
8
90.9207
2
34.44 97.75
P/E ratio
Price 197.4 255.1 260 229.2
Earnings per Share 0.44 0.39 12.54 6.79
0
1005100
0
7857000 7550000
Current Liabilities 1923800
0
2068000
0
10302000 1184900
0
Quick Ratio = Quick Assets / Current Liabilities 0.59585
2
0.48602
5
0.76266744
3
0.63718
5
Net Profit Margin
Net Profit 1206000 1322000 291000 168000
Sales 5749100
0
6391100
0
28456000 2900700
0
Net Profit Margin = Net Profit / Sales *100 2.09772 2.06850
2
1.02263143
1
0.57917
1
Gross Profit Margin
Gross Profit 3350000 4144000 544000 620000
Sales 5749100
0
6391100
0
28456000 2900700
0
Gross Profit Margin = Gross Profit / Sales *100 5.82699
9
6.48401
7
1.91172336
2
2.13741
5
Gearing ratios
Long term Liabilities 1514400
0
1350900
0
2552000 7607000
Capital Employed 1048000
0
1485800
0
7411000 7782000
Gearing Ratio = Long term Liabilities / CE *
100
144.503
8
90.9207
2
34.44 97.75
P/E ratio
Price 197.4 255.1 260 229.2
Earnings per Share 0.44 0.39 12.54 6.79
Paraphrase This Document
Need a fresh take? Get an instant paraphrase of this document with our AI Paraphraser
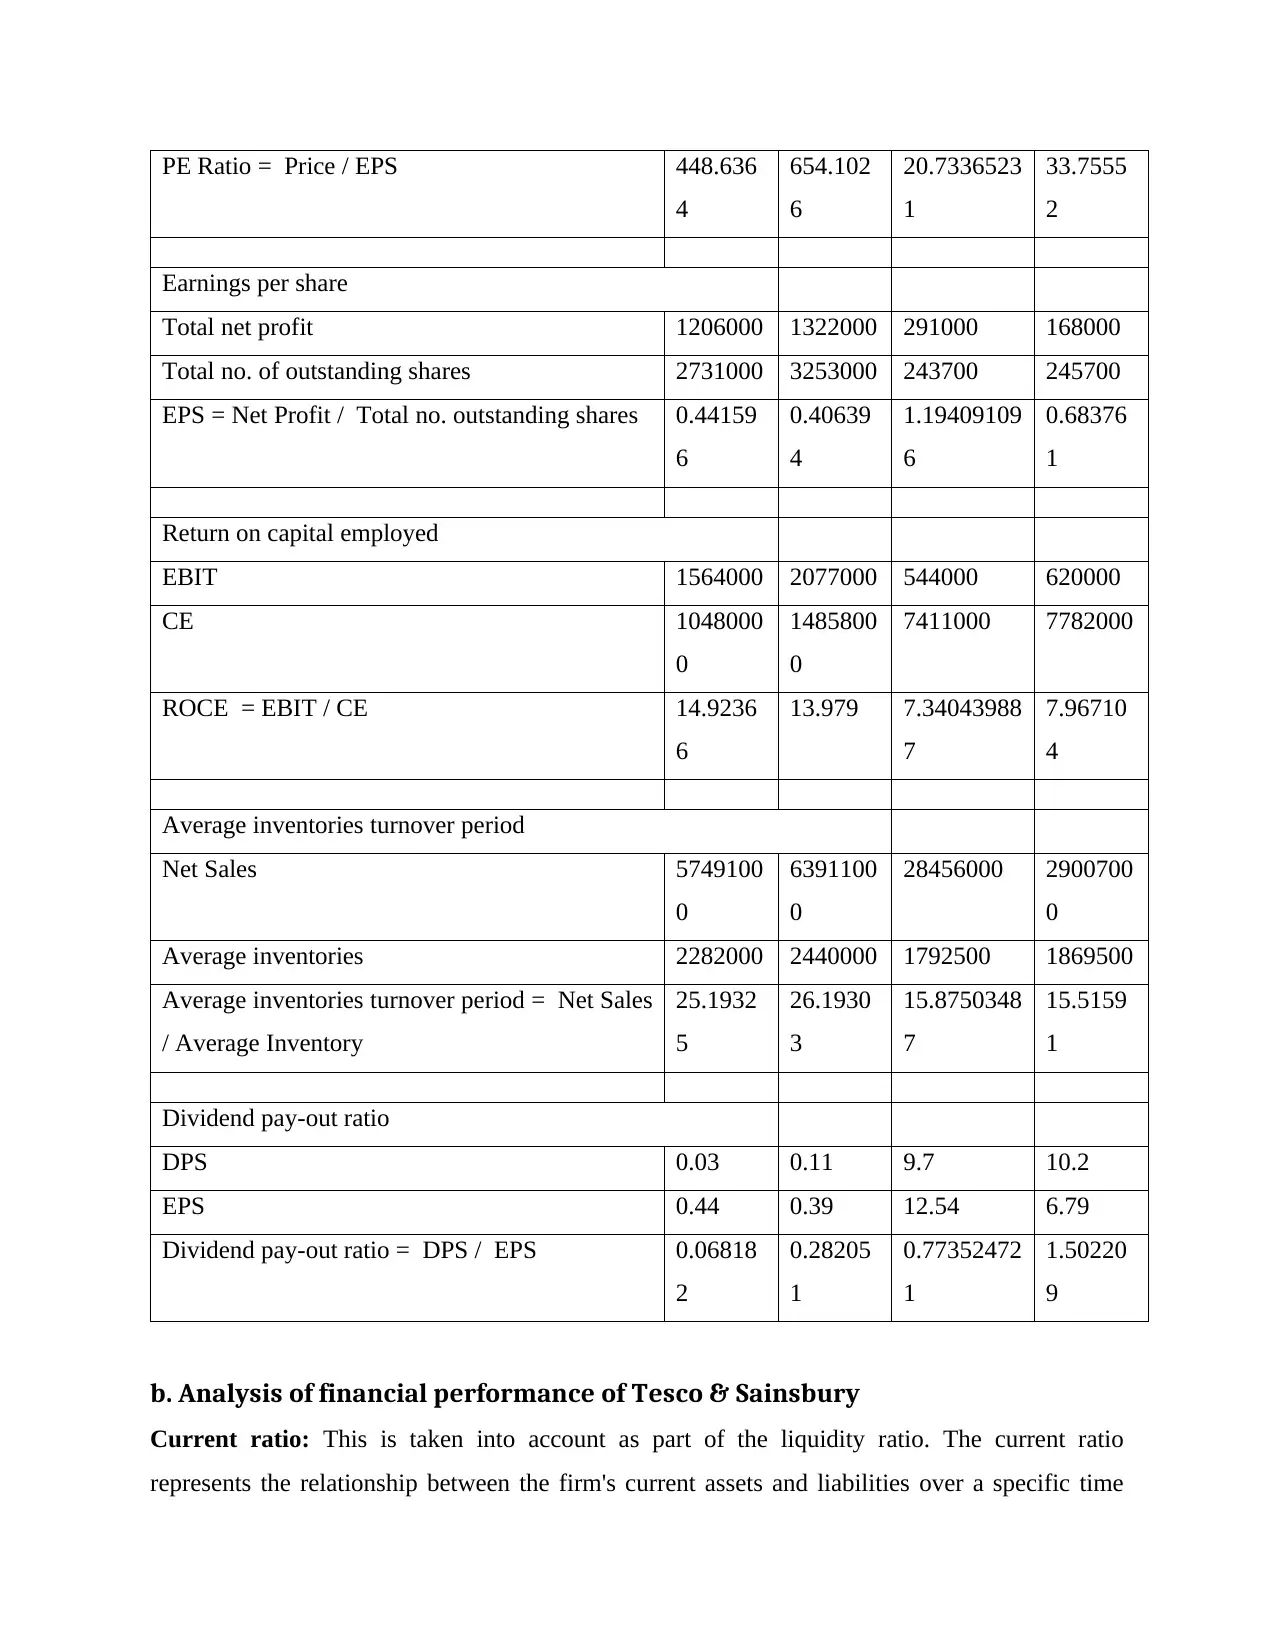
PE Ratio = Price / EPS 448.636
4
654.102
6
20.7336523
1
33.7555
2
Earnings per share
Total net profit 1206000 1322000 291000 168000
Total no. of outstanding shares 2731000 3253000 243700 245700
EPS = Net Profit / Total no. outstanding shares 0.44159
6
0.40639
4
1.19409109
6
0.68376
1
Return on capital employed
EBIT 1564000 2077000 544000 620000
CE 1048000
0
1485800
0
7411000 7782000
ROCE = EBIT / CE 14.9236
6
13.979 7.34043988
7
7.96710
4
Average inventories turnover period
Net Sales 5749100
0
6391100
0
28456000 2900700
0
Average inventories 2282000 2440000 1792500 1869500
Average inventories turnover period = Net Sales
/ Average Inventory
25.1932
5
26.1930
3
15.8750348
7
15.5159
1
Dividend pay-out ratio
DPS 0.03 0.11 9.7 10.2
EPS 0.44 0.39 12.54 6.79
Dividend pay-out ratio = DPS / EPS 0.06818
2
0.28205
1
0.77352472
1
1.50220
9
b. Analysis of financial performance of Tesco & Sainsbury
Current ratio: This is taken into account as part of the liquidity ratio. The current ratio
represents the relationship between the firm's current assets and liabilities over a specific time
4
654.102
6
20.7336523
1
33.7555
2
Earnings per share
Total net profit 1206000 1322000 291000 168000
Total no. of outstanding shares 2731000 3253000 243700 245700
EPS = Net Profit / Total no. outstanding shares 0.44159
6
0.40639
4
1.19409109
6
0.68376
1
Return on capital employed
EBIT 1564000 2077000 544000 620000
CE 1048000
0
1485800
0
7411000 7782000
ROCE = EBIT / CE 14.9236
6
13.979 7.34043988
7
7.96710
4
Average inventories turnover period
Net Sales 5749100
0
6391100
0
28456000 2900700
0
Average inventories 2282000 2440000 1792500 1869500
Average inventories turnover period = Net Sales
/ Average Inventory
25.1932
5
26.1930
3
15.8750348
7
15.5159
1
Dividend pay-out ratio
DPS 0.03 0.11 9.7 10.2
EPS 0.44 0.39 12.54 6.79
Dividend pay-out ratio = DPS / EPS 0.06818
2
0.28205
1
0.77352472
1
1.50220
9
b. Analysis of financial performance of Tesco & Sainsbury
Current ratio: This is taken into account as part of the liquidity ratio. The current ratio
represents the relationship between the firm's current assets and liabilities over a specific time

frame. Consider 2:1 as the desired current ratio (Schlegel, 2015). This shows that any
corporation has more money to meet their existing responsibilities. This demonstrates the firm's
willingness to satisfy its short-term obligations. The map was created to calculate Tesco and
Sainsbury's financial results.
Sainsbury's current ratio is far greater than Tesco's as per this above value, since the current
value obtained was 0.71 and 0.61 in 2019 and the Sainsbury value obtained was 0.76 and 066,
this defines that Sainsbury has far more current assets to meet its short-term debt obligations.
Quick ratio- This is also part of the ratio for calculating liquidity. To use quick ratio managers
to figure out the location of the company of liquid resources within a given amount of time. This
ratio demonstrates the connection between current liabilities and expedited properties. The
higher fast ratio suggests that the company has enough cash reserves. The cash availability of the
operational map is used for estimation.
This reveals that Sainsbury's fast asset ratio will be much better than Tesco in contrast with
Tesco's valuation. The rapid value of Sainsbury's proportion was determined at .60 in 2018
and .5 in 2019. In the case of Tesco, the fast ratio value was estimated at 0.59 and it declined in
2019. While both companies have lowered the valuation of the fast ratio, they have ample cash
or liquidity management buffer relative to Tesco Sainsbury that they use for the day-to-day daily
operations.
Net profit ratio- To figure out the organization's likelihood amount, this ratio is determined.
This is viewed as an important ratio as the ownership group considers their place within the
sector on the basis of calculating the net profit ratio (Hull and Dawar, 2014). This shows the
organization's potential to achieve profit from its revenue by deducting all the necessary costs.
This above value indicates that the total benefit ratio quality of Tesco was greater than
Sainsbury, since the net benefit level rate was estimated at 2.1 and improved in 2019 and that
level of Sainsbury fell from 1.09 to 0.75.
Gross profit margin- This percentage shows the measure of profitability and revenue,
describing the overall potential to produce sales profit from trading. When comparing the value
of gross profit with revenue, the Gross Profit Ratio is determined.
⊘ This is a preview!⊘
Do you want full access?
Subscribe today to unlock all pages.
Trusted by 1+ million students worldwide
The magnitude of Sainsbury's gross profit margin is much higher than Tesco's. When compared
to Tesco, this means that Sainsbury earns more operating profit.
Gearing ratio- This measure is measured in order to analyse the importance of an organisation's
financial leverage. It is measured to equate equity with obligation for debt. This ratio defines the
extent at which a company needs to comply with its long-term commitments relative to the
valuation of its shareholder. Compared to their internal capital, corporate companies need to
provide ample external funds that help offer them tax advantages. Research will be achieved
through the use of Tesco and Sainsbury total equity for graphical map analysis calculation.
This graph reveals that Tesco is in a strong spot relative to Sainsbury, which suggests that
Tesco's top management conducts efficient policies about its internally and externally assets,
while systematically retaining these funds.
Price earnings ratio- In order to evaluate the relationship between stocks and net sales produced
from company operations, managers use relative valuation ratios (Asongu, 2015). This ratio is
used to assess the firm's potential to attract or not attract business buyers. The price earnings
ratio map was developed using rise in average ratio to assess the value.
It can be calculated from this map that the valuation of Sainsbury's stock values is relatively very
high meaning that buying in Sainsbury is valuable to customers because the value of the stock is
large.
Earnings per share- This ratio is determined in order to determine the profits of each share over
a given period of time. It also is calculated as the market benefit assigned to the assets (Lee and
Isa, 2015).
The size of Tesco's earnings per share was 4.96 in 2018 and 6.14 in 2019, and 4.75 in 2018 and
4.06 in 2019 is estimated for Sainsbury. That suggests that Tesco is in a stronger situation than
its competing organisation, and their share is more important than that.
Return on capital employed- To evaluate the capacity to use resources to produce income,
managers measured this ratio. That's also part of the financial ratios, and it shows the relationship
among capital and earnings staff. The importance of this ratio map has been developed to
calculate it.
As per this description, Tesco's amount of money invested is far greater than Sainsbury's value.
That suggests that Tesco performs its corporate processes in a relatively more structured way.
Paraphrase This Document
Need a fresh take? Get an instant paraphrase of this document with our AI Paraphraser
Although the rate of capital invested is rising in both firms, Tesco is much stronger for
comparative purposes.
Stock turnover ratio- This ratio suggests that organisations require time to turn their inputs into
outputs and sell them mostly on marketplace. It is used to determine the time inventory was sold
out. Higher proportion indicates the company require longer time to transform their stocks.
It has been established from this graph that Tesco's inventory turnover is relatively high,
indicating that it takes a lot longer for this retailers to produce its stocks.
Dividend pay-out ratio: This ratio being determined to recognise the dividend-net income ratio.
In the grounds of such a ratio measurement, administrators are able to determine the dividend
amount they are capable of paying through the net earnings (Hull, Danso and Adomako, 2014).
This ratio is helpful in finding the dividend value. Investors take their judgment to allocate the
quality of dived company to their owners on the grounds of calculation.
It should be understood by this calculation that the amount of the dividend paid out by Sainsbury
is also much greater than that of Tesco. The above calculation defines that Tesco was able to
allocate 6.78 per quarter of dividends to its investors in 2019. This level became improved by
giving their stakeholders 27.05 regular dividend. On the opposite hand, the dividend paid out
ratio level of Sainsbury was 76.05 and the level for this dividends rose from 76.05 to 112.79 in
2019. Each company have remained in a sustainable position since the magnitude of their
dividend yield has improved. That ensures that as opposed to Tesco, Sainsbury offers its owners
a high rate of dividend. While Tesco raised the size of the dividends, Sainsbury showed higher
returns to its owners in the context of a results contrast.
c. Reason of poor performance of business.
By evaluating financial results through the Tesco and Sainsbury ratio process, it was revealed
that the quality of both companies is improving, but for the sake of contrast, Sainsbury earns
high sales rates and delivers dividends, so Sainsbury is a superior choice relative to Tesco for
productive investments (Wang, Jiang and Lin, 2014).
The general manager of Tesco must apply certain market methods that help increase the rate of
sales. It would be useful for market practises that raise cash inflow.
Tesco does not use an efficient pricing policy on their commodity, but as opposed to Sainsbury,
their efficiency has decreased.
Even in the case of other ratios, such as earnings per share, the Tesco ratio offers a reasonably
high return on invested capital. The below are few suggestions to better boost Tesco's financial
results.
Tesco management teams need to devise strategies and legislation that tend to improve their
company practises with cash inflows.
In order to minimise product turnaround time span, they need to use an inventory control strategy
that is helpful in minimising time and handling stock levels.
d. Limitations of measuring financial performance by using financial ratio
method
Business or companies use the different ratios to calculate their efficiency, although this
metric is considered the most appropriate and effective method, although there are certain
drawbacks when using this financial accounting instrument, which is described below.
It is used for calculating purposes since it becomes complicated often when many companies
use multiple accounting methods for their function (Gottardo and Moisello, 2014).
Seasons influence the valuation of financial reports explicitly. Decisions based on high or
reduce the frequency numbers are not accurate.
Only this aspect is taken into consideration, and can be true in quantitative terms and not in
measurable terms, because organisations are unable to quantify the expertise of their human
capital.
Personnel with outstanding labelling experience and expertise that have expertise of each accrual
basis need to be employed to use the financial ratio company. Although the measurement of this
ratio is difficult, all the changes need to be defined before analyse the economic equation.
PORTFOLIO 2
a. Use of capital budgeting technique for taking investment decision
Net Profits Project A
Project
B
Plant 1 Plant 2
⊘ This is a preview!⊘
Do you want full access?
Subscribe today to unlock all pages.
Trusted by 1+ million students worldwide
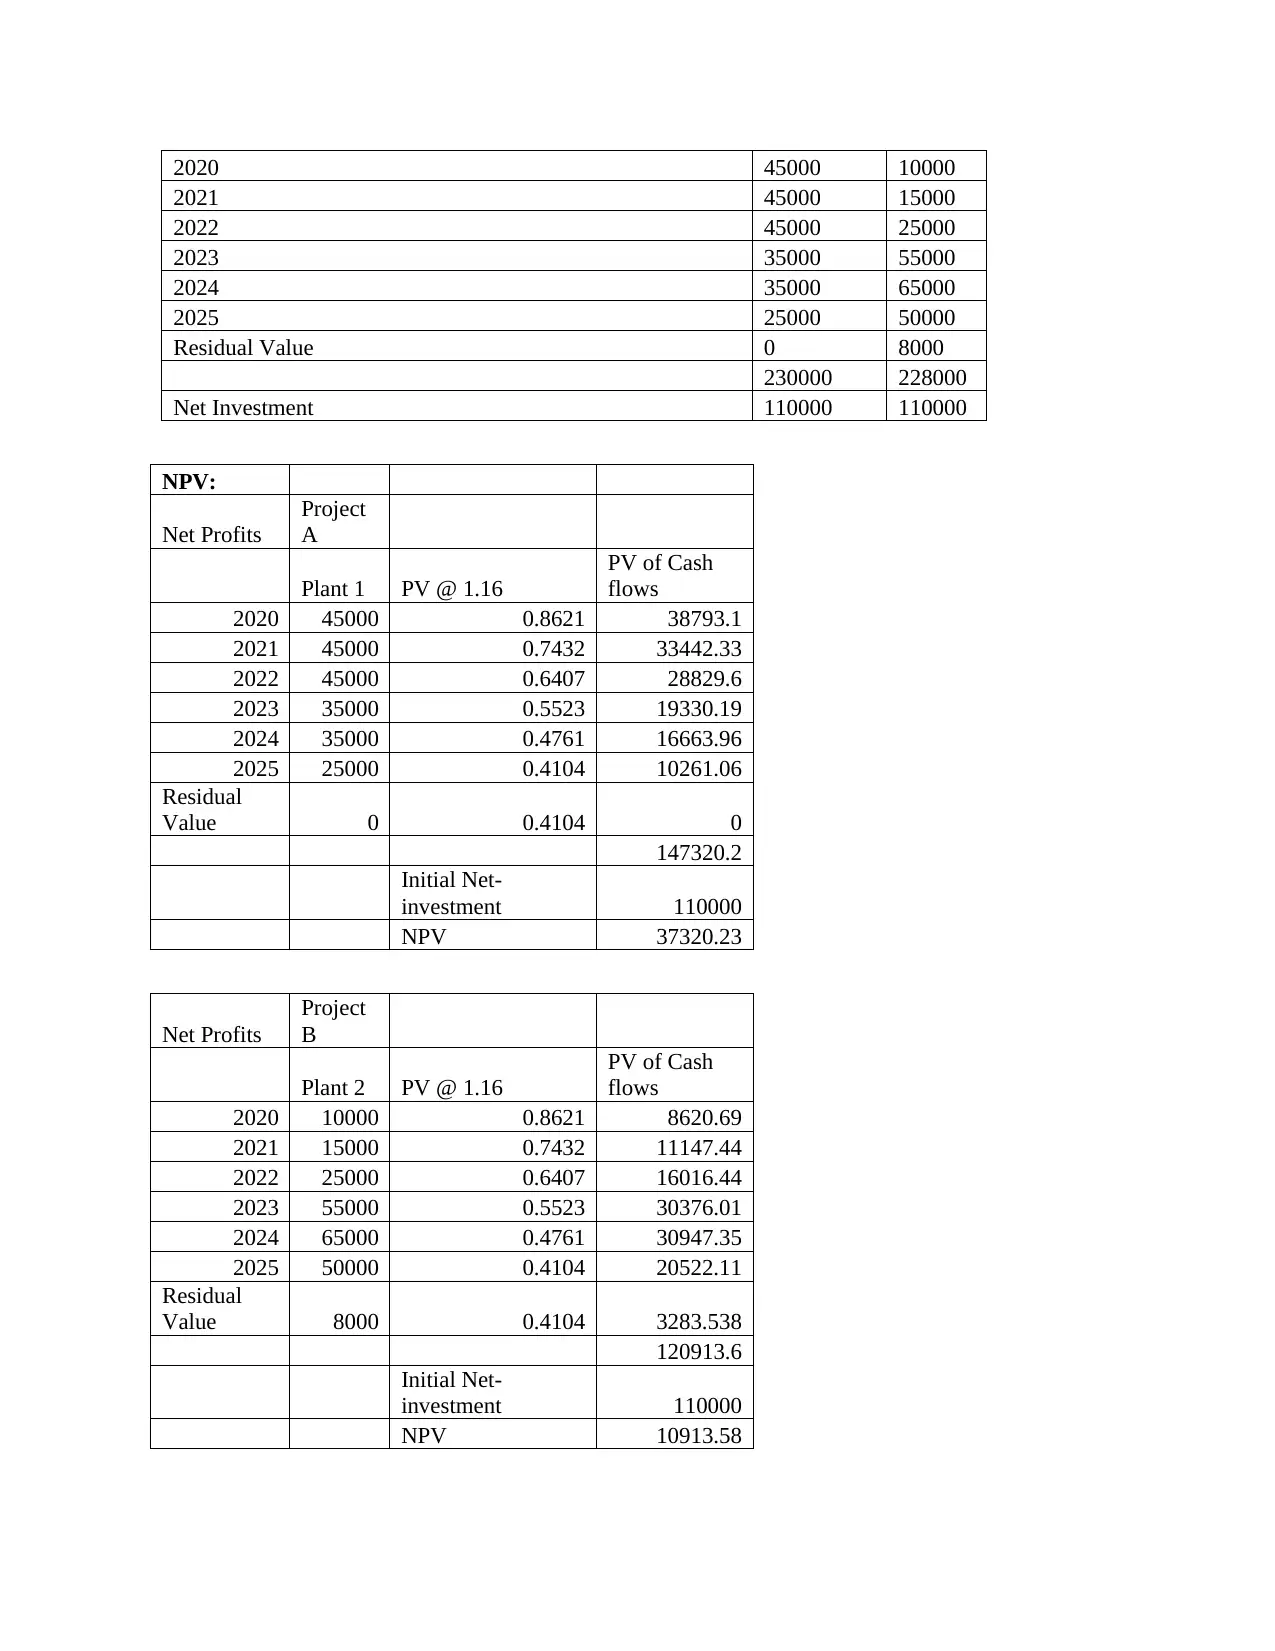
2020 45000 10000
2021 45000 15000
2022 45000 25000
2023 35000 55000
2024 35000 65000
2025 25000 50000
Residual Value 0 8000
230000 228000
Net Investment 110000 110000
NPV:
Net Profits
Project
A
Plant 1 PV @ 1.16
PV of Cash
flows
2020 45000 0.8621 38793.1
2021 45000 0.7432 33442.33
2022 45000 0.6407 28829.6
2023 35000 0.5523 19330.19
2024 35000 0.4761 16663.96
2025 25000 0.4104 10261.06
Residual
Value 0 0.4104 0
147320.2
Initial Net-
investment 110000
NPV 37320.23
Net Profits
Project
B
Plant 2 PV @ 1.16
PV of Cash
flows
2020 10000 0.8621 8620.69
2021 15000 0.7432 11147.44
2022 25000 0.6407 16016.44
2023 55000 0.5523 30376.01
2024 65000 0.4761 30947.35
2025 50000 0.4104 20522.11
Residual
Value 8000 0.4104 3283.538
120913.6
Initial Net-
investment 110000
NPV 10913.58
Paraphrase This Document
Need a fresh take? Get an instant paraphrase of this document with our AI Paraphraser
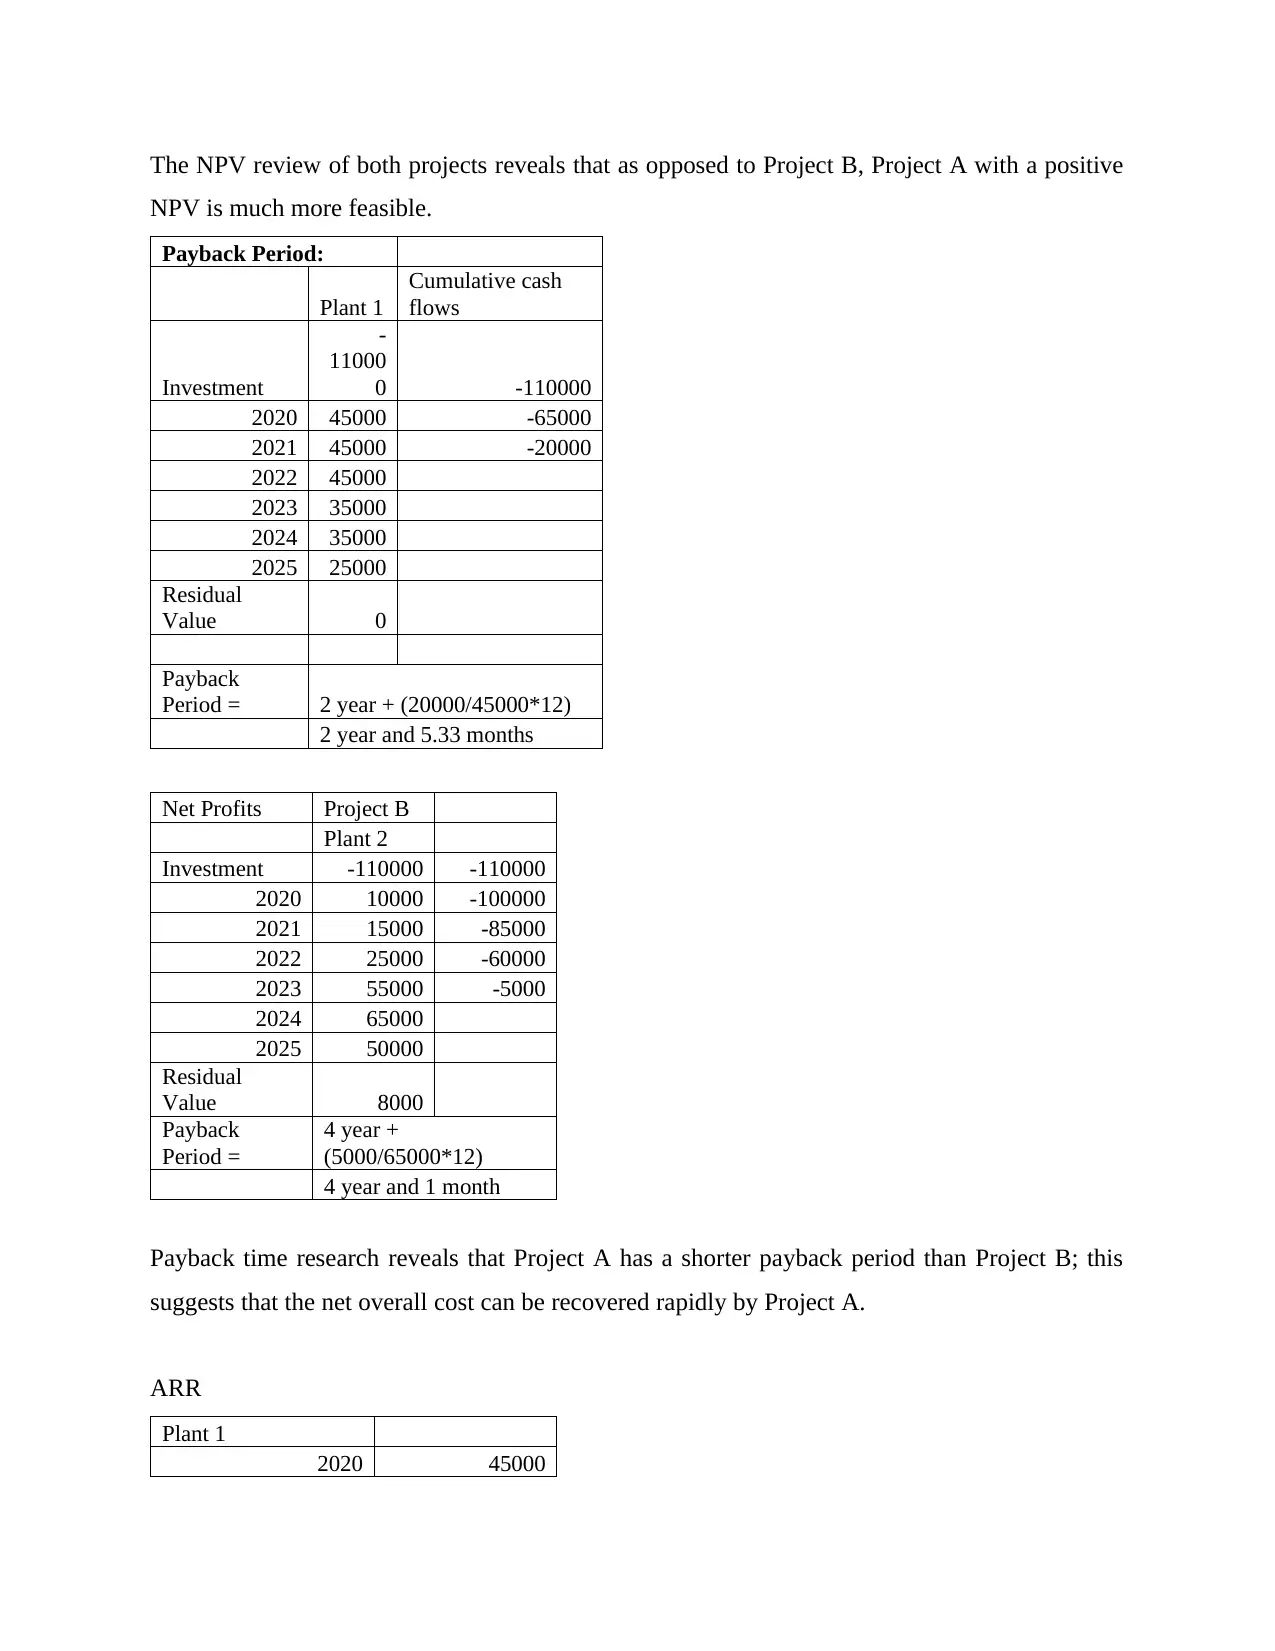
The NPV review of both projects reveals that as opposed to Project B, Project A with a positive
NPV is much more feasible.
Payback Period:
Plant 1
Cumulative cash
flows
Investment
-
11000
0 -110000
2020 45000 -65000
2021 45000 -20000
2022 45000
2023 35000
2024 35000
2025 25000
Residual
Value 0
Payback
Period = 2 year + (20000/45000*12)
2 year and 5.33 months
Net Profits Project B
Plant 2
Investment -110000 -110000
2020 10000 -100000
2021 15000 -85000
2022 25000 -60000
2023 55000 -5000
2024 65000
2025 50000
Residual
Value 8000
Payback
Period =
4 year +
(5000/65000*12)
4 year and 1 month
Payback time research reveals that Project A has a shorter payback period than Project B; this
suggests that the net overall cost can be recovered rapidly by Project A.
ARR
Plant 1
2020 45000
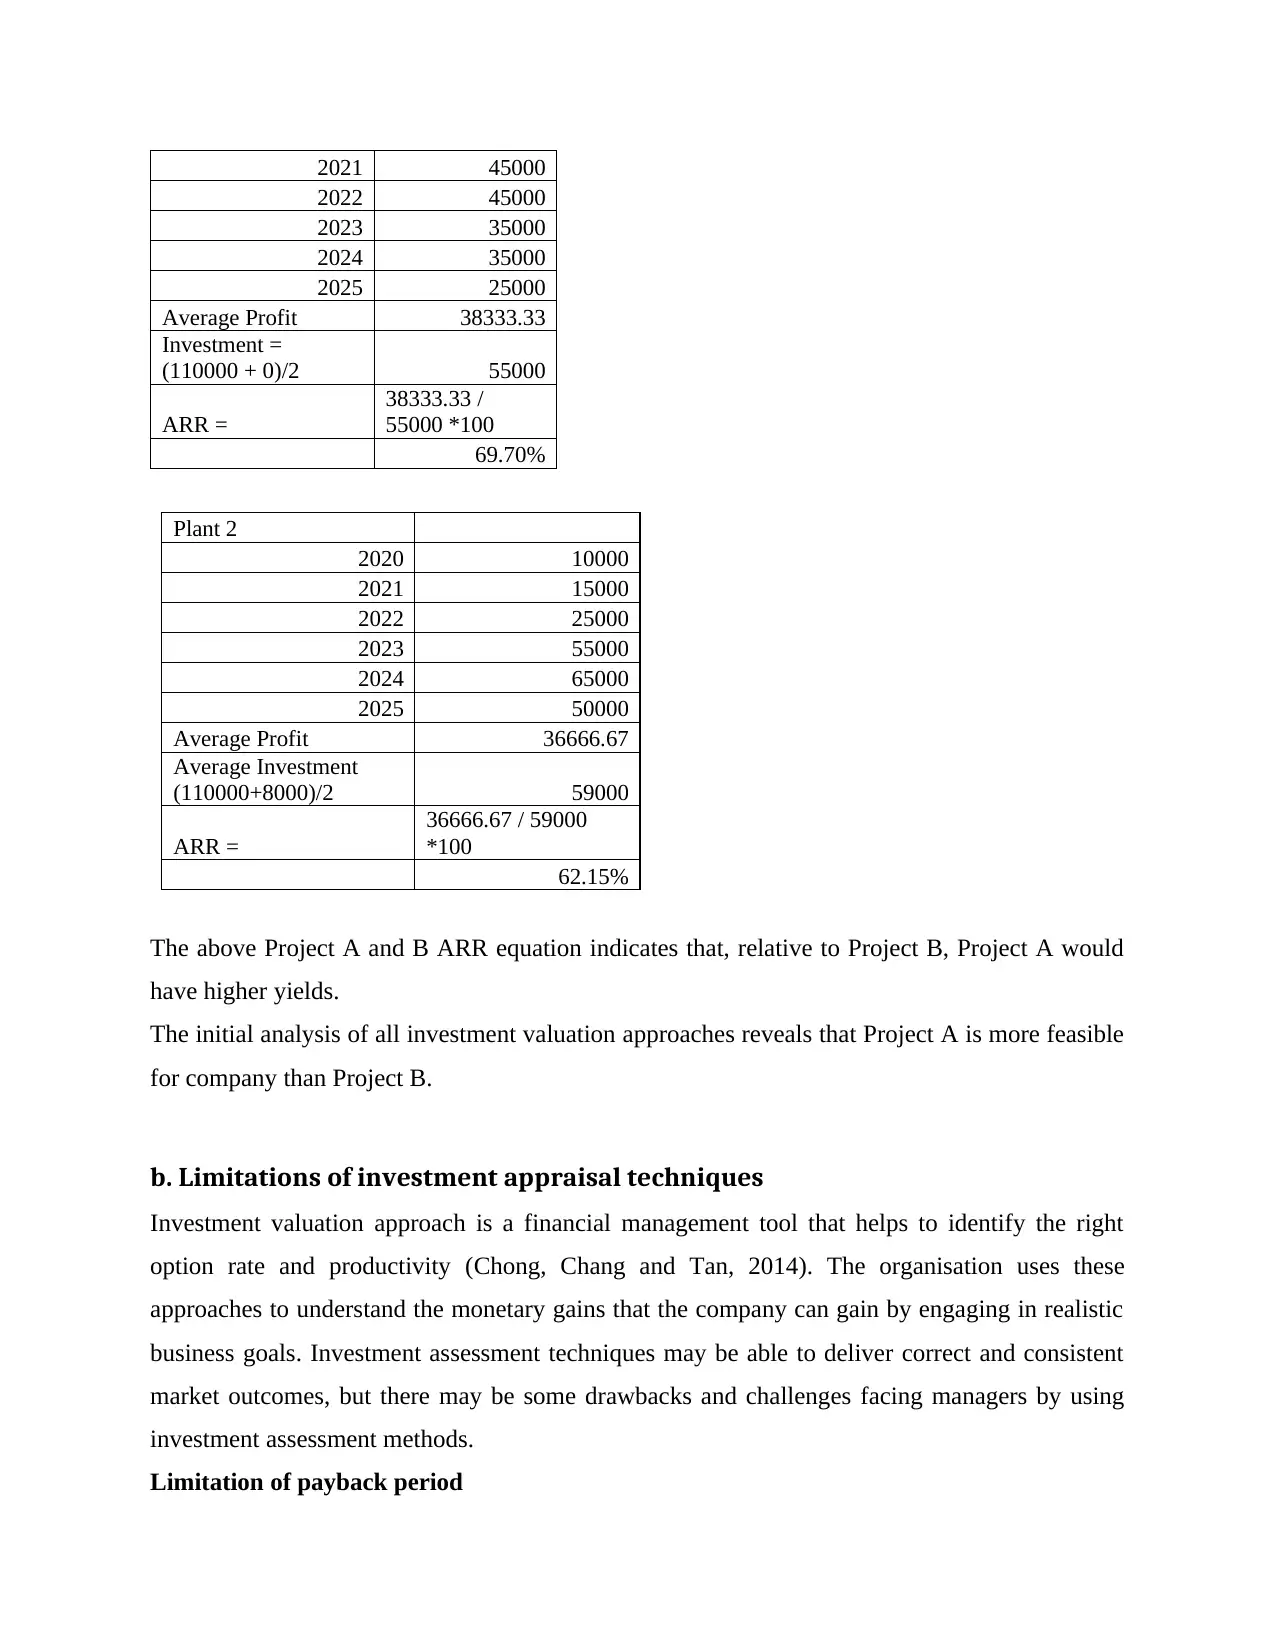
2021 45000
2022 45000
2023 35000
2024 35000
2025 25000
Average Profit 38333.33
Investment =
(110000 + 0)/2 55000
ARR =
38333.33 /
55000 *100
69.70%
Plant 2
2020 10000
2021 15000
2022 25000
2023 55000
2024 65000
2025 50000
Average Profit 36666.67
Average Investment
(110000+8000)/2 59000
ARR =
36666.67 / 59000
*100
62.15%
The above Project A and B ARR equation indicates that, relative to Project B, Project A would
have higher yields.
The initial analysis of all investment valuation approaches reveals that Project A is more feasible
for company than Project B.
b. Limitations of investment appraisal techniques
Investment valuation approach is a financial management tool that helps to identify the right
option rate and productivity (Chong, Chang and Tan, 2014). The organisation uses these
approaches to understand the monetary gains that the company can gain by engaging in realistic
business goals. Investment assessment techniques may be able to deliver correct and consistent
market outcomes, but there may be some drawbacks and challenges facing managers by using
investment assessment methods.
Limitation of payback period
⊘ This is a preview!⊘
Do you want full access?
Subscribe today to unlock all pages.
Trusted by 1+ million students worldwide
1 out of 15
Related Documents


Your All-in-One AI-Powered Toolkit for Academic Success.
+13062052269
info@desklib.com
Available 24*7 on WhatsApp / Email
![[object Object]](/_next/static/media/star-bottom.7253800d.svg)
Unlock your academic potential
Copyright © 2020–2026 A2Z Services. All Rights Reserved. Developed and managed by ZUCOL.