Evaluating Financial Performance: GlaxoSmithKline, Shire, Astrazeneca
VerifiedAdded on 2023/06/13
|28
|4899
|469
Report
AI Summary
This report provides a comprehensive financial analysis of three leading pharmaceutical companies in the UK: GlaxoSmithKline Plc, Shire Plc, and Astrazeneca Plc. It evaluates their financial performance using a range of financial ratios, including profitability ratios (gross margin, net margin), liquidity ratios (current ratio, quick ratio), efficiency ratios (inventory turnover, receivables turnover), solvency ratios (debt-to-equity ratio, interest coverage ratio), and investment ratios (market value per share, earnings per share, dividend payout ratio). The analysis covers the period from 2015 to 2017, offering insights into each company's strengths and weaknesses in areas such as managing production costs, meeting short-term obligations, inventory management, debt financing, and shareholder returns. The report identifies leaders in each category, providing a comparative overview of the competitive landscape within the UK pharmaceutical industry.
Running head: ACCOUNTING AND FINANCE FOR MANAGERS
Accounting and Finance for Managers
Name of the Student:
Name of the University:
Author’s Note:
Course ID:
Accounting and Finance for Managers
Name of the Student:
Name of the University:
Author’s Note:
Course ID:
Paraphrase This Document
Need a fresh take? Get an instant paraphrase of this document with our AI Paraphraser
1ACCOUNTING AND FINANCE FOR MANAGERS
Table of Contents
Question 1:.........................................................................................................................2
Answer to Part (a):.........................................................................................................2
Answer to Part (b):.......................................................................................................12
Answer to Part (c):.......................................................................................................14
Question 2:.......................................................................................................................14
Answer to Part (a):.......................................................................................................15
Answer to Part (b):.......................................................................................................16
References:......................................................................................................................19
Appendices:.....................................................................................................................22
2ACCOUNTING AND FINANCE FOR MANAGERS
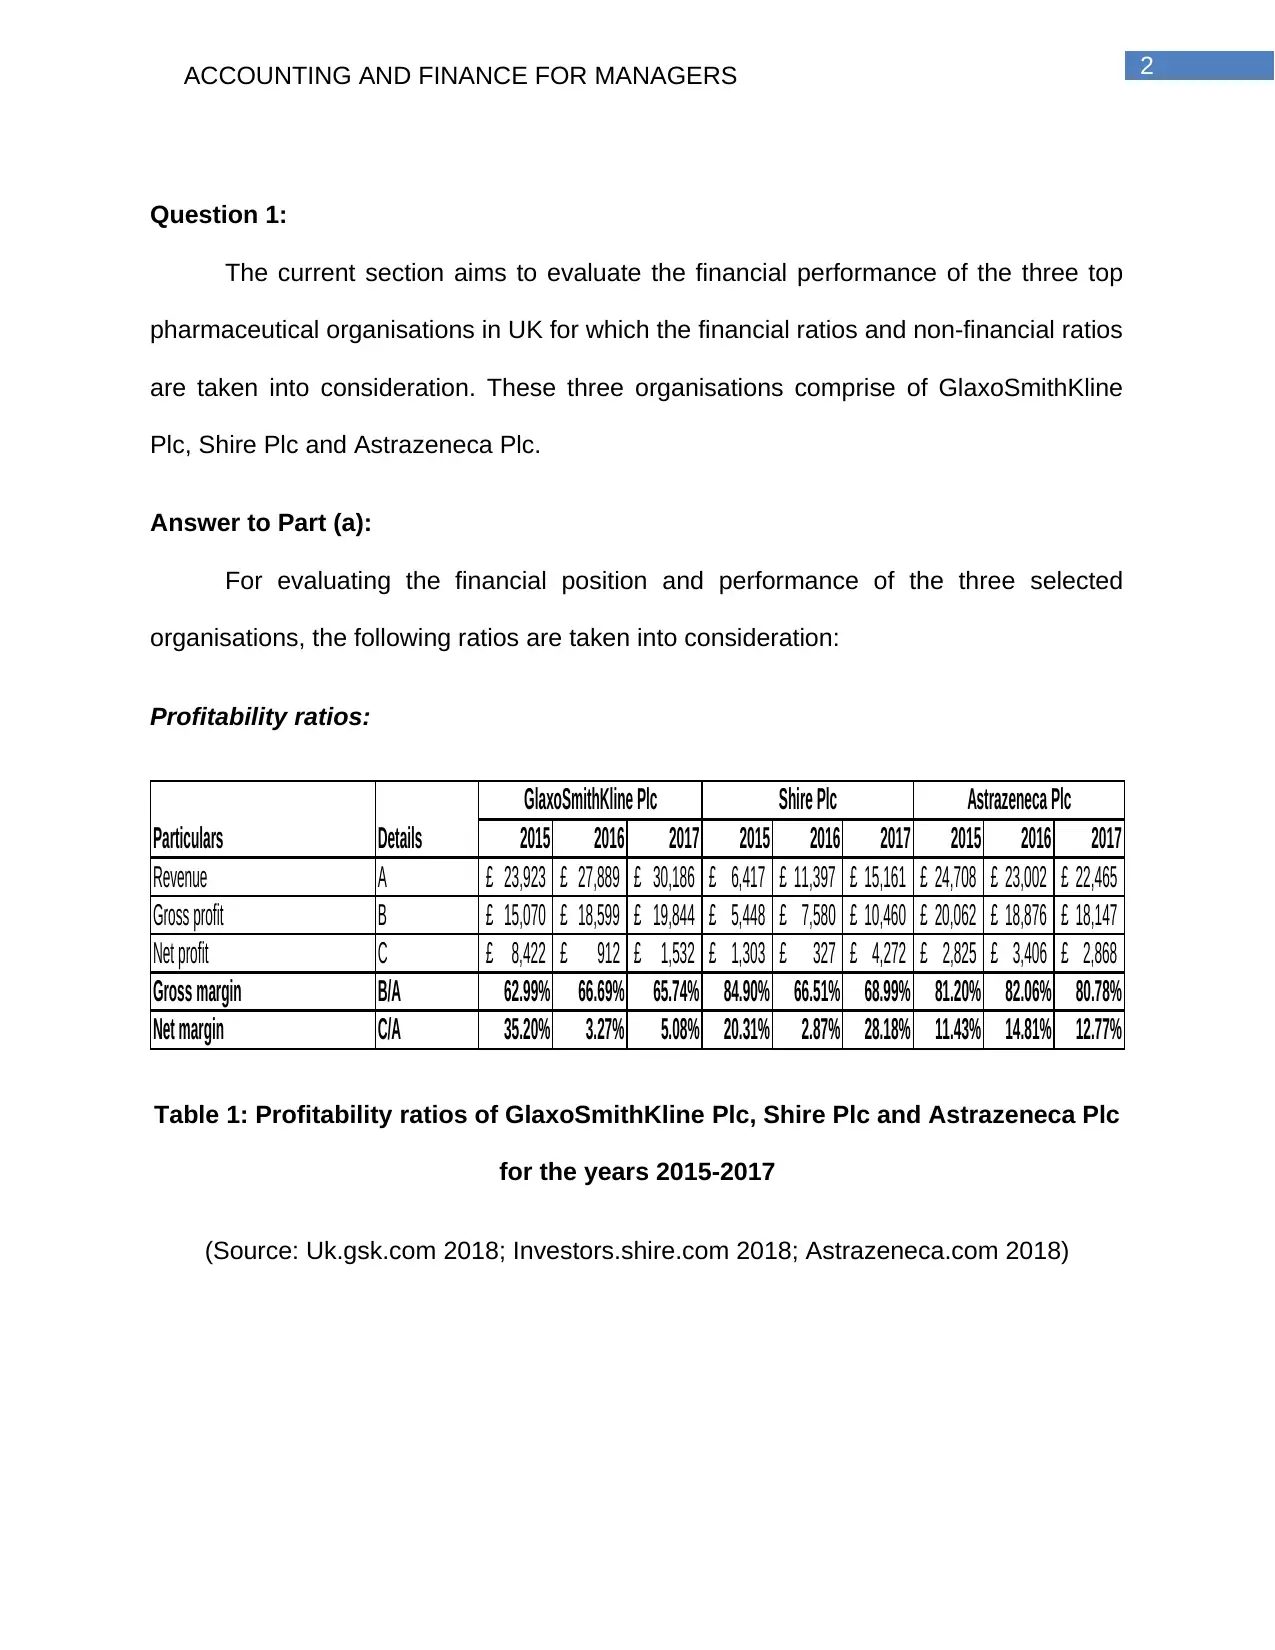
Question 1:
The current section aims to evaluate the financial performance of the three top
pharmaceutical organisations in UK for which the financial ratios and non-financial ratios
are taken into consideration. These three organisations comprise of GlaxoSmithKline
Plc, Shire Plc and Astrazeneca Plc.
Answer to Part (a):
For evaluating the financial position and performance of the three selected
organisations, the following ratios are taken into consideration:
Profitability ratios:
2015 2016 2017 2015 2016 2017 2015 2016 2017
Revenue A 23,923£ 27,889£ 30,186£ 6,417£ 11,397£ 15,161£ 24,708£ 23,002£ 22,465£
Gross profit B 15,070£ 18,599£ 19,844£ 5,448£ 7,580£ 10,460£ 20,062£ 18,876£ 18,147£
Net profit C 8,422£ 912£ 1,532£ 1,303£ 327£ 4,272£ 2,825£ 3,406£ 2,868£
Gross margin B/A 62.99% 66.69% 65.74% 84.90% 66.51% 68.99% 81.20% 82.06% 80.78%
Net margin C/A 35.20% 3.27% 5.08% 20.31% 2.87% 28.18% 11.43% 14.81% 12.77%
GlaxoSmithKline Plc Shire Plc Astrazeneca Plc
Particulars Details
Table 1: Profitability ratios of GlaxoSmithKline Plc, Shire Plc and Astrazeneca Plc
for the years 2015-2017
(Source: Uk.gsk.com 2018; Investors.shire.com 2018; Astrazeneca.com 2018)
⊘ This is a preview!⊘
Do you want full access?
Subscribe today to unlock all pages.
Trusted by 1+ million students worldwide
3ACCOUNTING AND FINANCE FOR MANAGERS
2015 2016 2017 2015 2016 2017 2015 2016 2017
GlaxoSmithKline
Plc Shire Plc Astrazeneca Plc
0.00%
10.00%
20.00%
30.00%
40.00%
50.00%
60.00%
70.00%
80.00%
90.00%
Profitability Ratios
Gross margin
Net margin
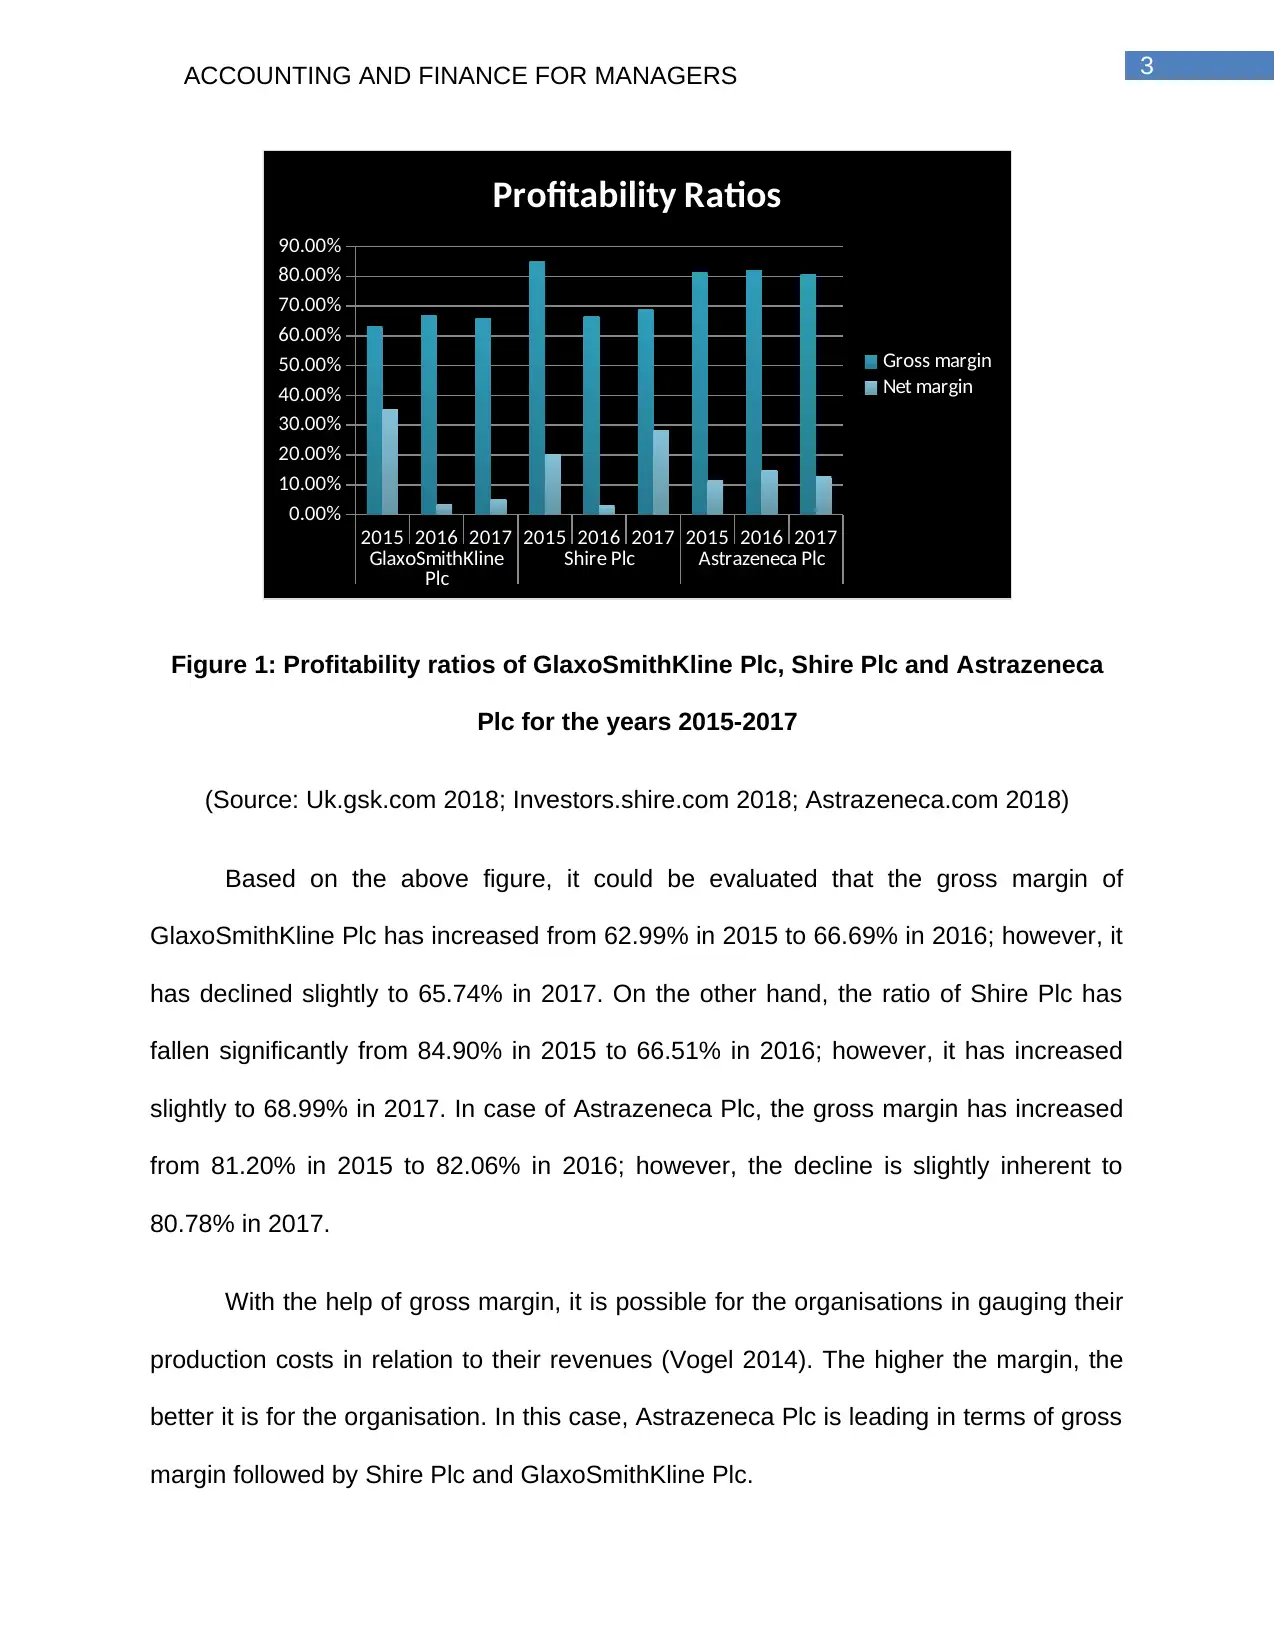
Figure 1: Profitability ratios of GlaxoSmithKline Plc, Shire Plc and Astrazeneca
Plc for the years 2015-2017
(Source: Uk.gsk.com 2018; Investors.shire.com 2018; Astrazeneca.com 2018)
Based on the above figure, it could be evaluated that the gross margin of
GlaxoSmithKline Plc has increased from 62.99% in 2015 to 66.69% in 2016; however, it
has declined slightly to 65.74% in 2017. On the other hand, the ratio of Shire Plc has
fallen significantly from 84.90% in 2015 to 66.51% in 2016; however, it has increased
slightly to 68.99% in 2017. In case of Astrazeneca Plc, the gross margin has increased
from 81.20% in 2015 to 82.06% in 2016; however, the decline is slightly inherent to
80.78% in 2017.
With the help of gross margin, it is possible for the organisations in gauging their
production costs in relation to their revenues (Vogel 2014). The higher the margin, the
better it is for the organisation. In this case, Astrazeneca Plc is leading in terms of gross
margin followed by Shire Plc and GlaxoSmithKline Plc.
2015 2016 2017 2015 2016 2017 2015 2016 2017
GlaxoSmithKline
Plc Shire Plc Astrazeneca Plc
0.00%
10.00%
20.00%
30.00%
40.00%
50.00%
60.00%
70.00%
80.00%
90.00%
Profitability Ratios
Gross margin
Net margin
Figure 1: Profitability ratios of GlaxoSmithKline Plc, Shire Plc and Astrazeneca
Plc for the years 2015-2017
(Source: Uk.gsk.com 2018; Investors.shire.com 2018; Astrazeneca.com 2018)
Based on the above figure, it could be evaluated that the gross margin of
GlaxoSmithKline Plc has increased from 62.99% in 2015 to 66.69% in 2016; however, it
has declined slightly to 65.74% in 2017. On the other hand, the ratio of Shire Plc has
fallen significantly from 84.90% in 2015 to 66.51% in 2016; however, it has increased
slightly to 68.99% in 2017. In case of Astrazeneca Plc, the gross margin has increased
from 81.20% in 2015 to 82.06% in 2016; however, the decline is slightly inherent to
80.78% in 2017.
With the help of gross margin, it is possible for the organisations in gauging their
production costs in relation to their revenues (Vogel 2014). The higher the margin, the
better it is for the organisation. In this case, Astrazeneca Plc is leading in terms of gross
margin followed by Shire Plc and GlaxoSmithKline Plc.
Paraphrase This Document
Need a fresh take? Get an instant paraphrase of this document with our AI Paraphraser
4ACCOUNTING AND FINANCE FOR MANAGERS
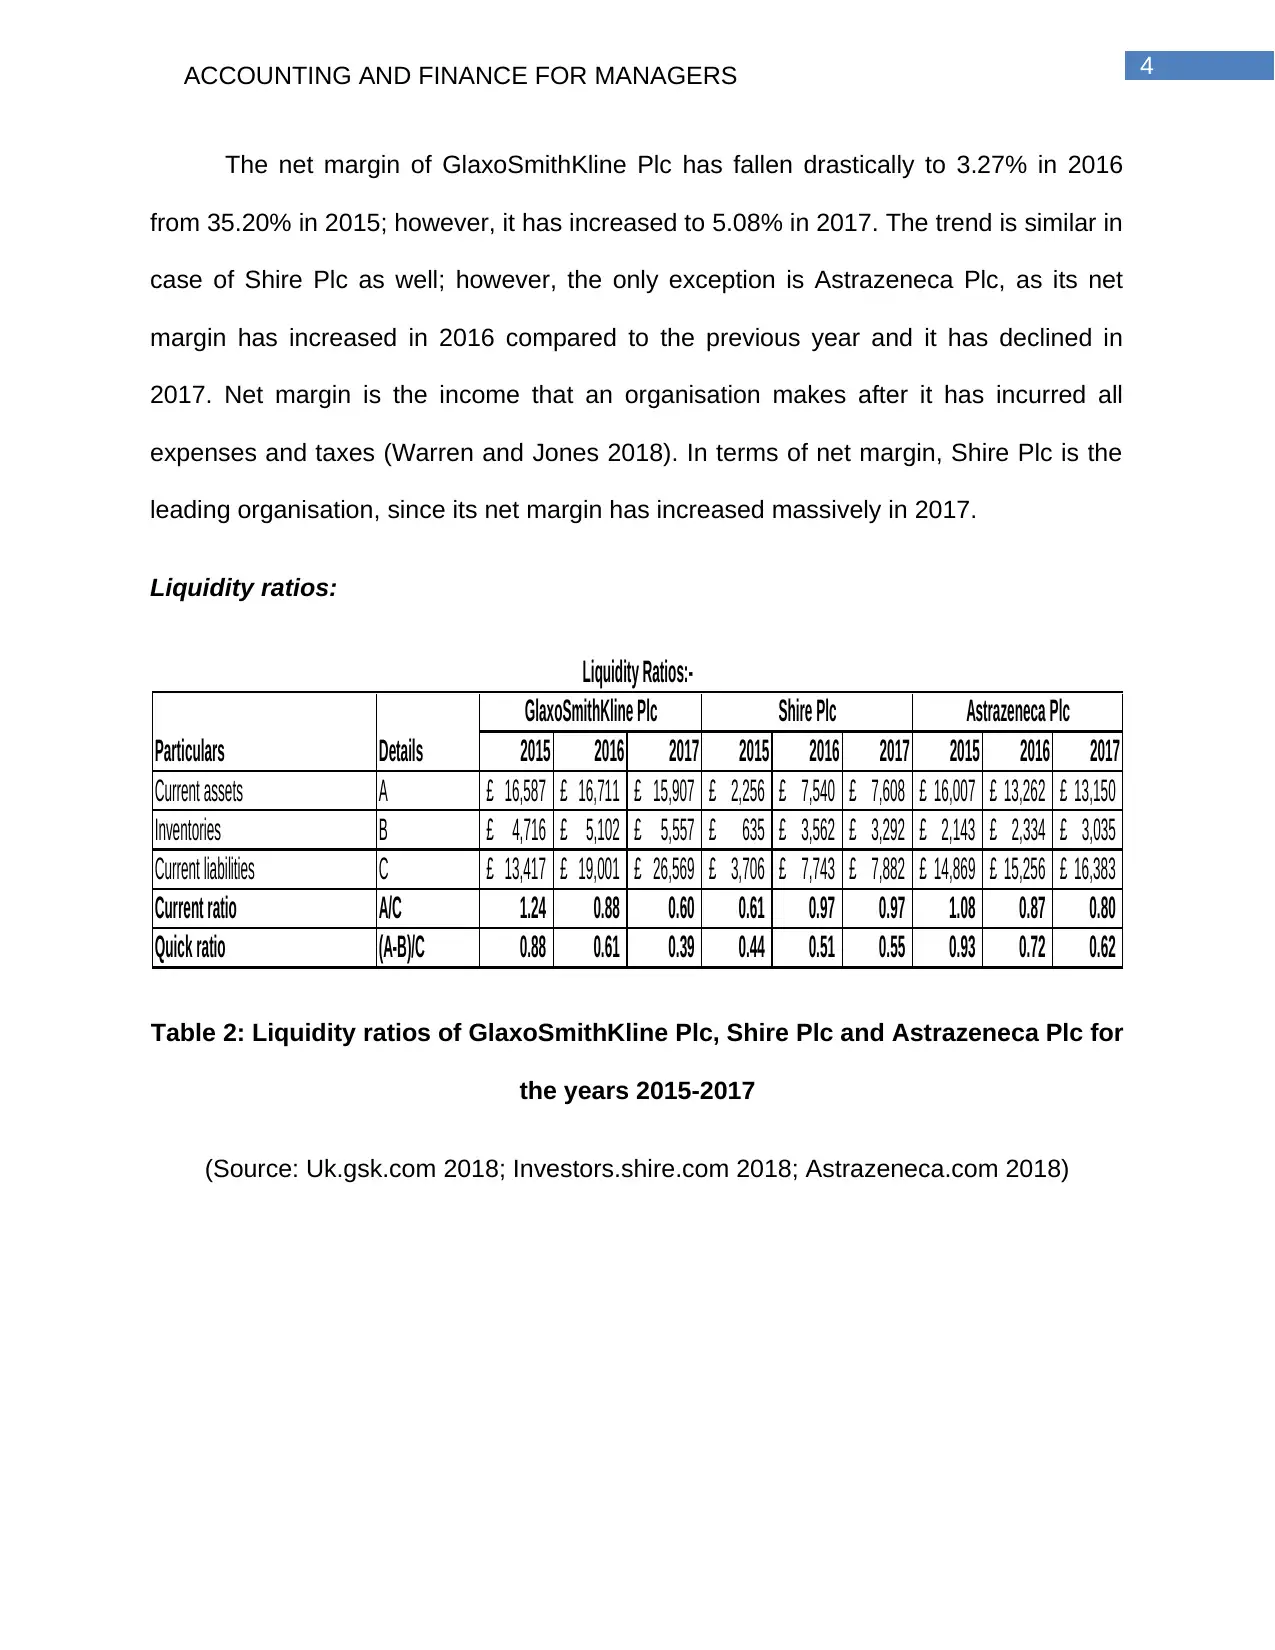
The net margin of GlaxoSmithKline Plc has fallen drastically to 3.27% in 2016
from 35.20% in 2015; however, it has increased to 5.08% in 2017. The trend is similar in
case of Shire Plc as well; however, the only exception is Astrazeneca Plc, as its net
margin has increased in 2016 compared to the previous year and it has declined in
2017. Net margin is the income that an organisation makes after it has incurred all
expenses and taxes (Warren and Jones 2018). In terms of net margin, Shire Plc is the
leading organisation, since its net margin has increased massively in 2017.
Liquidity ratios:
2015 2016 2017 2015 2016 2017 2015 2016 2017
Current assets A 16,587£ 16,711£ 15,907£ 2,256£ 7,540£ 7,608£ 16,007£ 13,262£ 13,150£
Inventories B 4,716£ 5,102£ 5,557£ 635£ 3,562£ 3,292£ 2,143£ 2,334£ 3,035£
Current liabilities C 13,417£ 19,001£ 26,569£ 3,706£ 7,743£ 7,882£ 14,869£ 15,256£ 16,383£
Current ratio A/C 1.24 0.88 0.60 0.61 0.97 0.97 1.08 0.87 0.80
Quick ratio (A-B)/C 0.88 0.61 0.39 0.44 0.51 0.55 0.93 0.72 0.62
Liquidity Ratios:-
Particulars Details
GlaxoSmithKline Plc Shire Plc Astrazeneca Plc
Table 2: Liquidity ratios of GlaxoSmithKline Plc, Shire Plc and Astrazeneca Plc for
the years 2015-2017
(Source: Uk.gsk.com 2018; Investors.shire.com 2018; Astrazeneca.com 2018)
5ACCOUNTING AND FINANCE FOR MANAGERS
2015 2016 2017 2015 2016 2017 2015 2016 2017
GlaxoSmithKline
Plc Shire Plc Astrazeneca Plc
-
0.20
0.40
0.60
0.80
1.00
1.20
1.40
Liquidity Ratios
Current ratio
Quick ratio
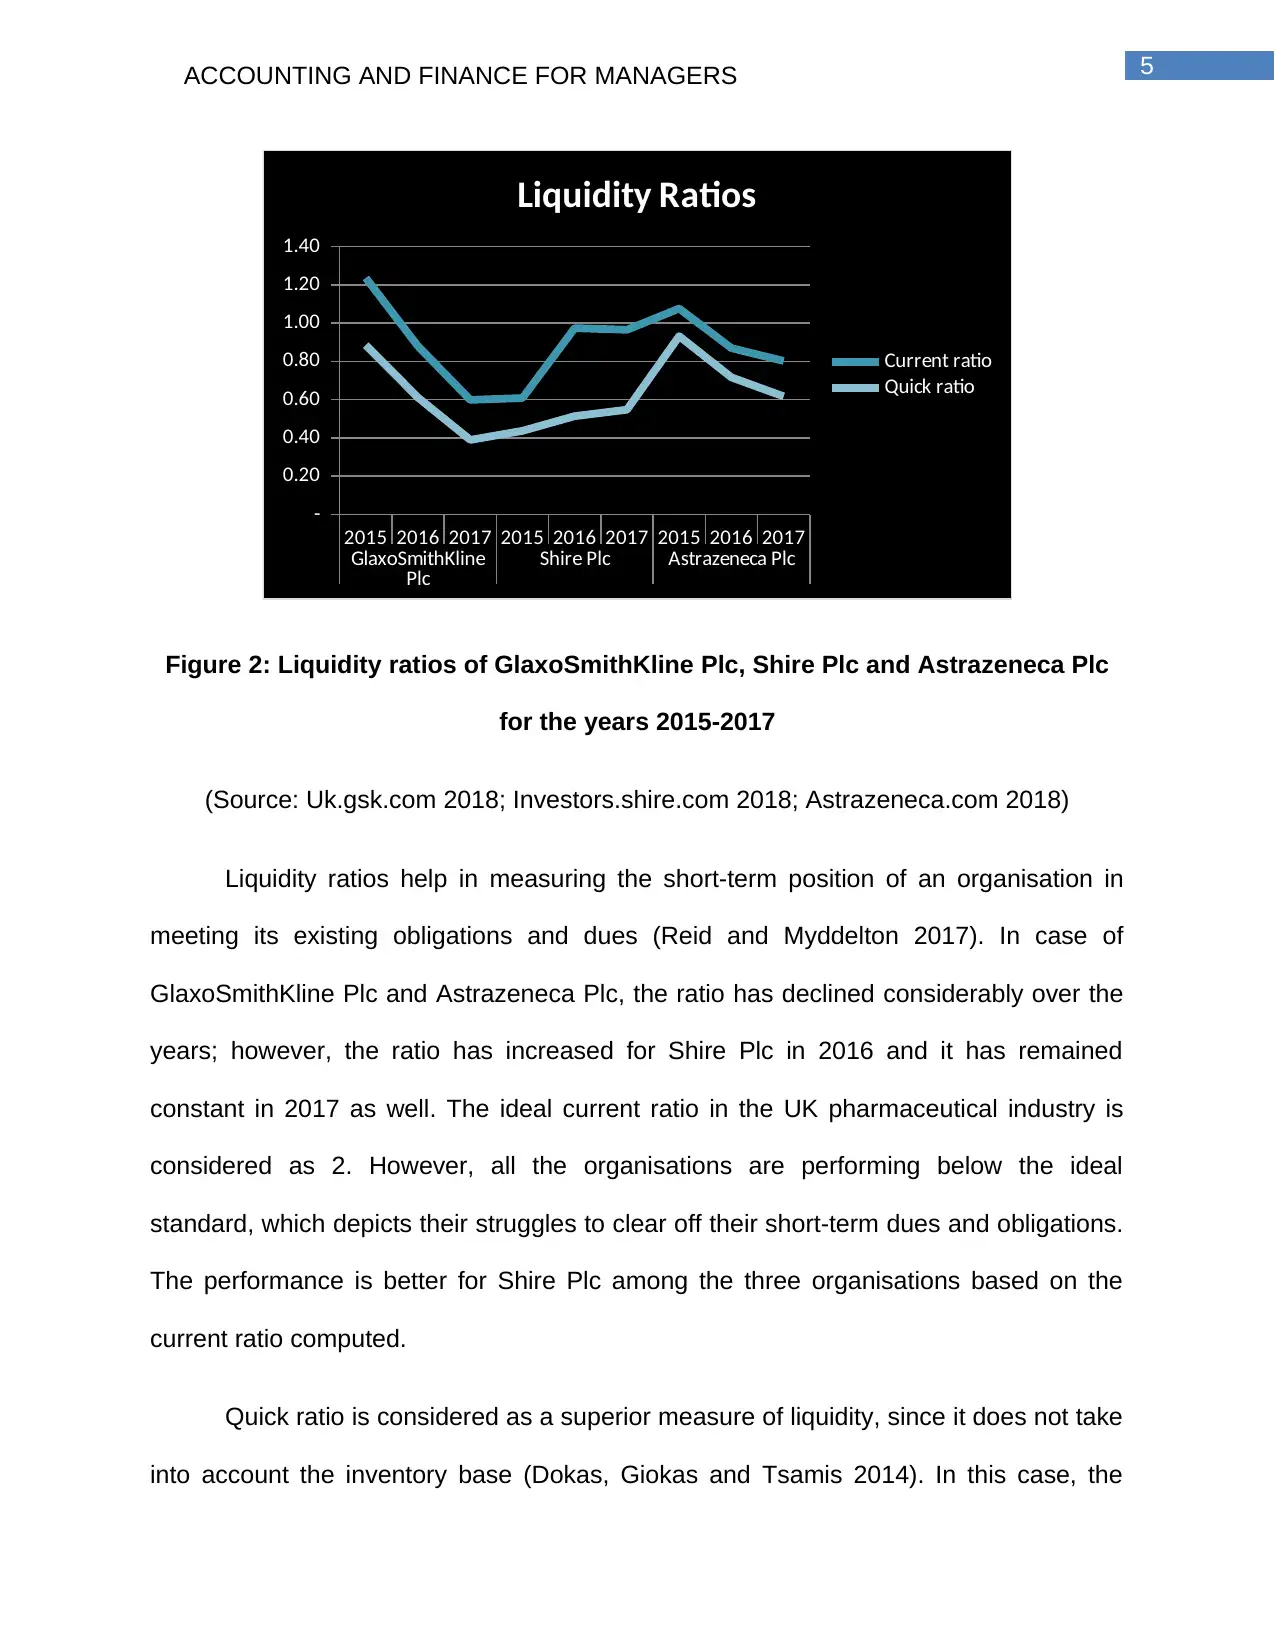
Figure 2: Liquidity ratios of GlaxoSmithKline Plc, Shire Plc and Astrazeneca Plc
for the years 2015-2017
(Source: Uk.gsk.com 2018; Investors.shire.com 2018; Astrazeneca.com 2018)
Liquidity ratios help in measuring the short-term position of an organisation in
meeting its existing obligations and dues (Reid and Myddelton 2017). In case of
GlaxoSmithKline Plc and Astrazeneca Plc, the ratio has declined considerably over the
years; however, the ratio has increased for Shire Plc in 2016 and it has remained
constant in 2017 as well. The ideal current ratio in the UK pharmaceutical industry is
considered as 2. However, all the organisations are performing below the ideal
standard, which depicts their struggles to clear off their short-term dues and obligations.
The performance is better for Shire Plc among the three organisations based on the
current ratio computed.
Quick ratio is considered as a superior measure of liquidity, since it does not take
into account the inventory base (Dokas, Giokas and Tsamis 2014). In this case, the
2015 2016 2017 2015 2016 2017 2015 2016 2017
GlaxoSmithKline
Plc Shire Plc Astrazeneca Plc
-
0.20
0.40
0.60
0.80
1.00
1.20
1.40
Liquidity Ratios
Current ratio
Quick ratio
Figure 2: Liquidity ratios of GlaxoSmithKline Plc, Shire Plc and Astrazeneca Plc
for the years 2015-2017
(Source: Uk.gsk.com 2018; Investors.shire.com 2018; Astrazeneca.com 2018)
Liquidity ratios help in measuring the short-term position of an organisation in
meeting its existing obligations and dues (Reid and Myddelton 2017). In case of
GlaxoSmithKline Plc and Astrazeneca Plc, the ratio has declined considerably over the
years; however, the ratio has increased for Shire Plc in 2016 and it has remained
constant in 2017 as well. The ideal current ratio in the UK pharmaceutical industry is
considered as 2. However, all the organisations are performing below the ideal
standard, which depicts their struggles to clear off their short-term dues and obligations.
The performance is better for Shire Plc among the three organisations based on the
current ratio computed.
Quick ratio is considered as a superior measure of liquidity, since it does not take
into account the inventory base (Dokas, Giokas and Tsamis 2014). In this case, the
⊘ This is a preview!⊘
Do you want full access?
Subscribe today to unlock all pages.
Trusted by 1+ million students worldwide
6ACCOUNTING AND FINANCE FOR MANAGERS
trend is similar for GlaxoSmithKline Plc, as the ratio has declined from 0.88 in 2015 to
0.61 in 2016 and 0.39 in 2017. However, the ratio has increased for Shire Plc from 0.44
in 2015 to 0.51 in 2016 and 0.55 in 2017. Even though the ratio has declined from
Astrazeneca Plc, it is still higher compared to the other two organisations and higher the
ratio, the better is for the organisation. Hence, in terms of liquidity, Astrozeneca Plc is in
a better position in the UK pharmaceutical industry.
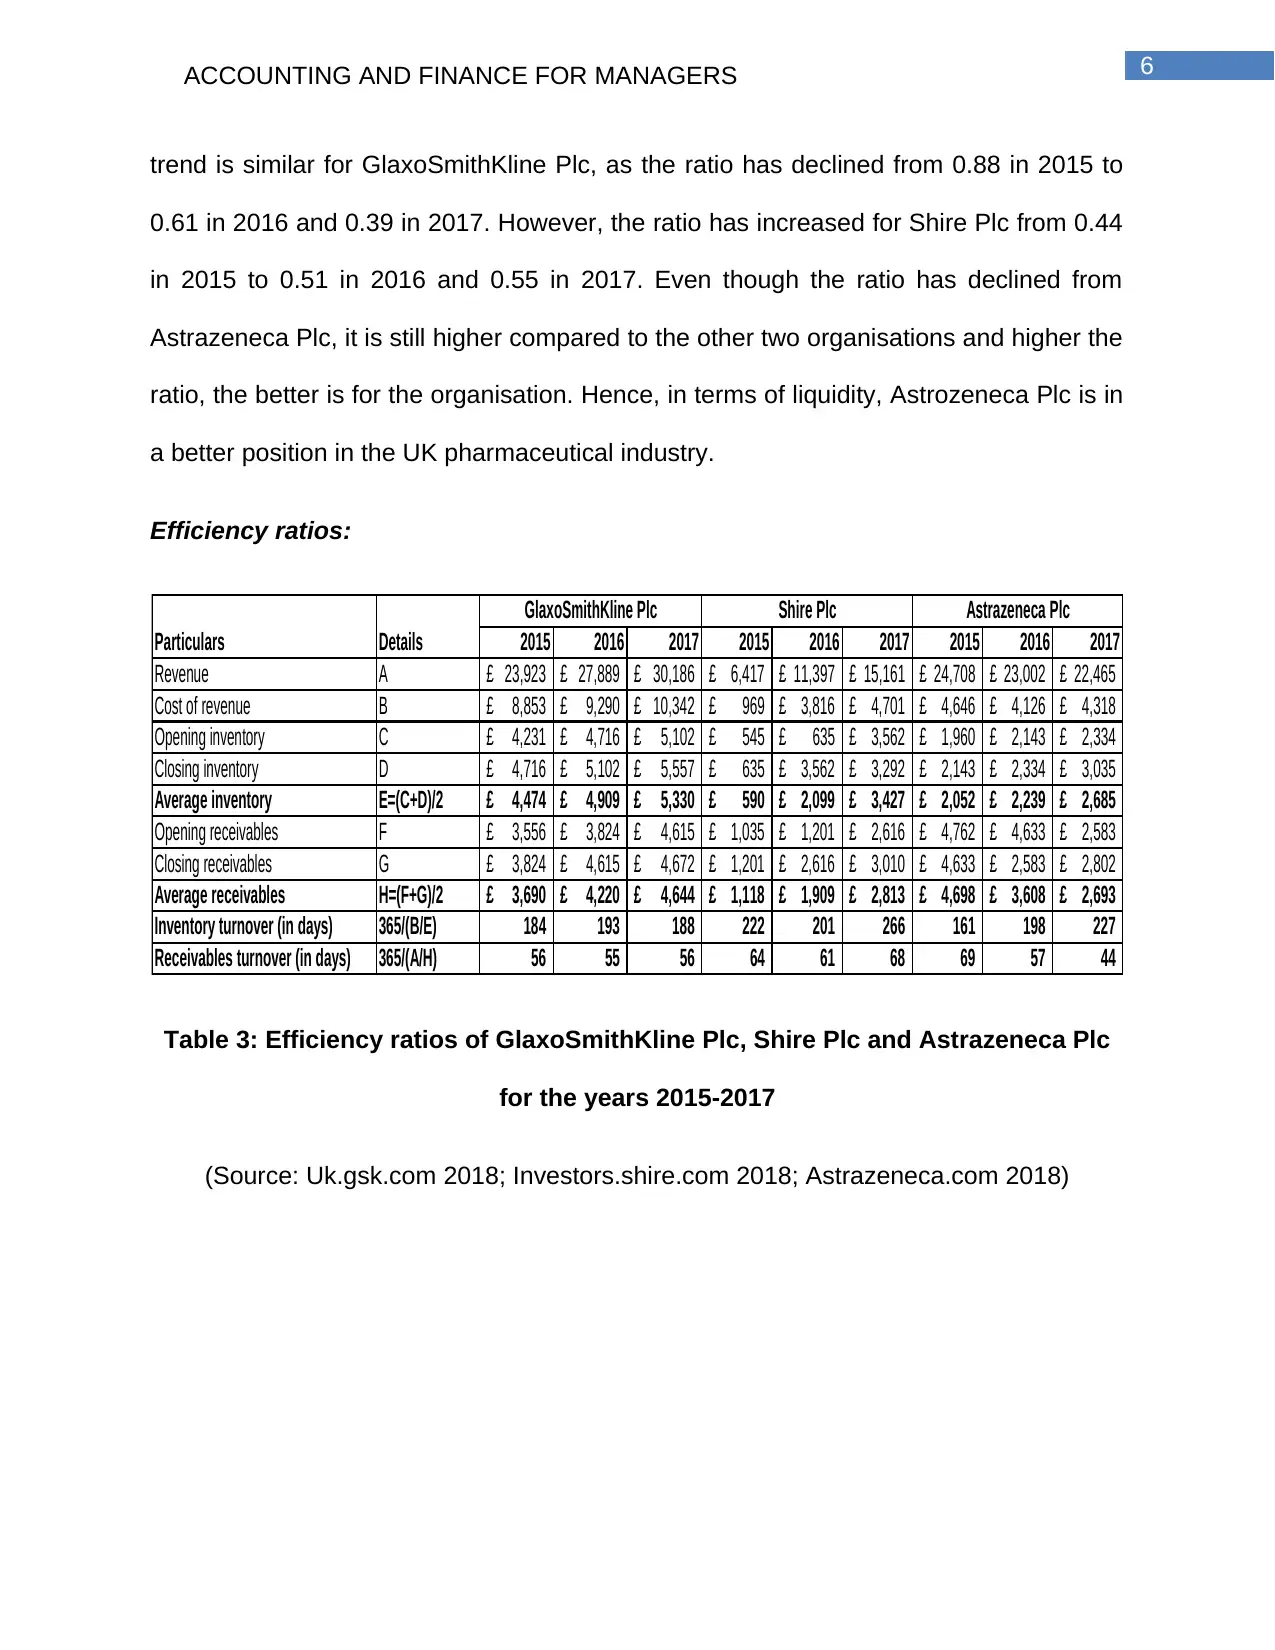
Efficiency ratios:
2015 2016 2017 2015 2016 2017 2015 2016 2017
Revenue A 23,923£ 27,889£ 30,186£ 6,417£ 11,397£ 15,161£ 24,708£ 23,002£ 22,465£
Cost of revenue B 8,853£ 9,290£ 10,342£ 969£ 3,816£ 4,701£ 4,646£ 4,126£ 4,318£
Opening inventory C 4,231£ 4,716£ 5,102£ 545£ 635£ 3,562£ 1,960£ 2,143£ 2,334£
Closing inventory D 4,716£ 5,102£ 5,557£ 635£ 3,562£ 3,292£ 2,143£ 2,334£ 3,035£
Average inventory E=(C+D)/2 4,474£ 4,909£ 5,330£ 590£ 2,099£ 3,427£ 2,052£ 2,239£ 2,685£
Opening receivables F 3,556£ 3,824£ 4,615£ 1,035£ 1,201£ 2,616£ 4,762£ 4,633£ 2,583£
Closing receivables G 3,824£ 4,615£ 4,672£ 1,201£ 2,616£ 3,010£ 4,633£ 2,583£ 2,802£
Average receivables H=(F+G)/2 3,690£ 4,220£ 4,644£ 1,118£ 1,909£ 2,813£ 4,698£ 3,608£ 2,693£
Inventory turnover (in days) 365/(B/E) 184 193 188 222 201 266 161 198 227
Receivables turnover (in days) 365/(A/H) 56 55 56 64 61 68 69 57 44
Particulars Details
GlaxoSmithKline Plc Shire Plc Astrazeneca Plc
Table 3: Efficiency ratios of GlaxoSmithKline Plc, Shire Plc and Astrazeneca Plc
for the years 2015-2017
(Source: Uk.gsk.com 2018; Investors.shire.com 2018; Astrazeneca.com 2018)
trend is similar for GlaxoSmithKline Plc, as the ratio has declined from 0.88 in 2015 to
0.61 in 2016 and 0.39 in 2017. However, the ratio has increased for Shire Plc from 0.44
in 2015 to 0.51 in 2016 and 0.55 in 2017. Even though the ratio has declined from
Astrazeneca Plc, it is still higher compared to the other two organisations and higher the
ratio, the better is for the organisation. Hence, in terms of liquidity, Astrozeneca Plc is in
a better position in the UK pharmaceutical industry.
Efficiency ratios:
2015 2016 2017 2015 2016 2017 2015 2016 2017
Revenue A 23,923£ 27,889£ 30,186£ 6,417£ 11,397£ 15,161£ 24,708£ 23,002£ 22,465£
Cost of revenue B 8,853£ 9,290£ 10,342£ 969£ 3,816£ 4,701£ 4,646£ 4,126£ 4,318£
Opening inventory C 4,231£ 4,716£ 5,102£ 545£ 635£ 3,562£ 1,960£ 2,143£ 2,334£
Closing inventory D 4,716£ 5,102£ 5,557£ 635£ 3,562£ 3,292£ 2,143£ 2,334£ 3,035£
Average inventory E=(C+D)/2 4,474£ 4,909£ 5,330£ 590£ 2,099£ 3,427£ 2,052£ 2,239£ 2,685£
Opening receivables F 3,556£ 3,824£ 4,615£ 1,035£ 1,201£ 2,616£ 4,762£ 4,633£ 2,583£
Closing receivables G 3,824£ 4,615£ 4,672£ 1,201£ 2,616£ 3,010£ 4,633£ 2,583£ 2,802£
Average receivables H=(F+G)/2 3,690£ 4,220£ 4,644£ 1,118£ 1,909£ 2,813£ 4,698£ 3,608£ 2,693£
Inventory turnover (in days) 365/(B/E) 184 193 188 222 201 266 161 198 227
Receivables turnover (in days) 365/(A/H) 56 55 56 64 61 68 69 57 44
Particulars Details
GlaxoSmithKline Plc Shire Plc Astrazeneca Plc
Table 3: Efficiency ratios of GlaxoSmithKline Plc, Shire Plc and Astrazeneca Plc
for the years 2015-2017
(Source: Uk.gsk.com 2018; Investors.shire.com 2018; Astrazeneca.com 2018)
Paraphrase This Document
Need a fresh take? Get an instant paraphrase of this document with our AI Paraphraser
7ACCOUNTING AND FINANCE FOR MANAGERS
2015
2016
2017
2015
2016
2017
2015
2016
2017
GlaxoSmithKlin
e Plc Shire Plc Astrazeneca Plc
0%
10%
20%
30%
40%
50%
60%
70%
80%
90%
100%
Efficiency Ratios
Receivables turnover (in
days)
Inventory turnover (in
days)
Figure 3: Efficiency ratios of GlaxoSmithKline Plc, Shire Plc and Astrazeneca Plc
for the years 2015-2017
(Source: Uk.gsk.com 2018; Investors.shire.com 2018; Astrazeneca.com 2018)
According to the above figure, it could be observed that the inventory turnover of
GlaxoSmithKline Plc has increased from 184 days in 2015 to 193 days in 2016;
however, it has declined to 188 days in 2017. On the other hand, the ratio for Shire Plc
has decreased from 222 days in 2015 to 201 days in 2016; however, it has increased
again to 266 days in 2017. In case of Astrazeneca Plc, the ratio has increased to 198
days in 2016 from 161 days in 2015 and the rise is inherent further to 227 days in 2017.
The lower the ratio in terms of days, the higher is the demand for the products and
services of the organisation in the market (Evans and Mathur 2014). In this case,
GlaxoSmithKline Plc is enjoying a better position in the market compared to its other
two competitors.
2015
2016
2017
2015
2016
2017
2015
2016
2017
GlaxoSmithKlin
e Plc Shire Plc Astrazeneca Plc
0%
10%
20%
30%
40%
50%
60%
70%
80%
90%
100%
Efficiency Ratios
Receivables turnover (in
days)
Inventory turnover (in
days)
Figure 3: Efficiency ratios of GlaxoSmithKline Plc, Shire Plc and Astrazeneca Plc
for the years 2015-2017
(Source: Uk.gsk.com 2018; Investors.shire.com 2018; Astrazeneca.com 2018)
According to the above figure, it could be observed that the inventory turnover of
GlaxoSmithKline Plc has increased from 184 days in 2015 to 193 days in 2016;
however, it has declined to 188 days in 2017. On the other hand, the ratio for Shire Plc
has decreased from 222 days in 2015 to 201 days in 2016; however, it has increased
again to 266 days in 2017. In case of Astrazeneca Plc, the ratio has increased to 198
days in 2016 from 161 days in 2015 and the rise is inherent further to 227 days in 2017.
The lower the ratio in terms of days, the higher is the demand for the products and
services of the organisation in the market (Evans and Mathur 2014). In this case,
GlaxoSmithKline Plc is enjoying a better position in the market compared to its other
two competitors.
8ACCOUNTING AND FINANCE FOR MANAGERS
Receivables turnover denotes the time, in which an organisation collects its dues
from the customers for the products and services rendered at a past date (Almamy,
Aston and Ngwa 2016). The lower the ratio, the better it is for the organisation in
collecting cash from its customers to increase its working capital. In this case, the ratio
is lower for GlaxoSmithKline Plc and hence, in terms of efficiency, it could be inferred
that the organisation is enjoying competitive supremacy over the other two
organisations in the UK pharmaceutical industry.
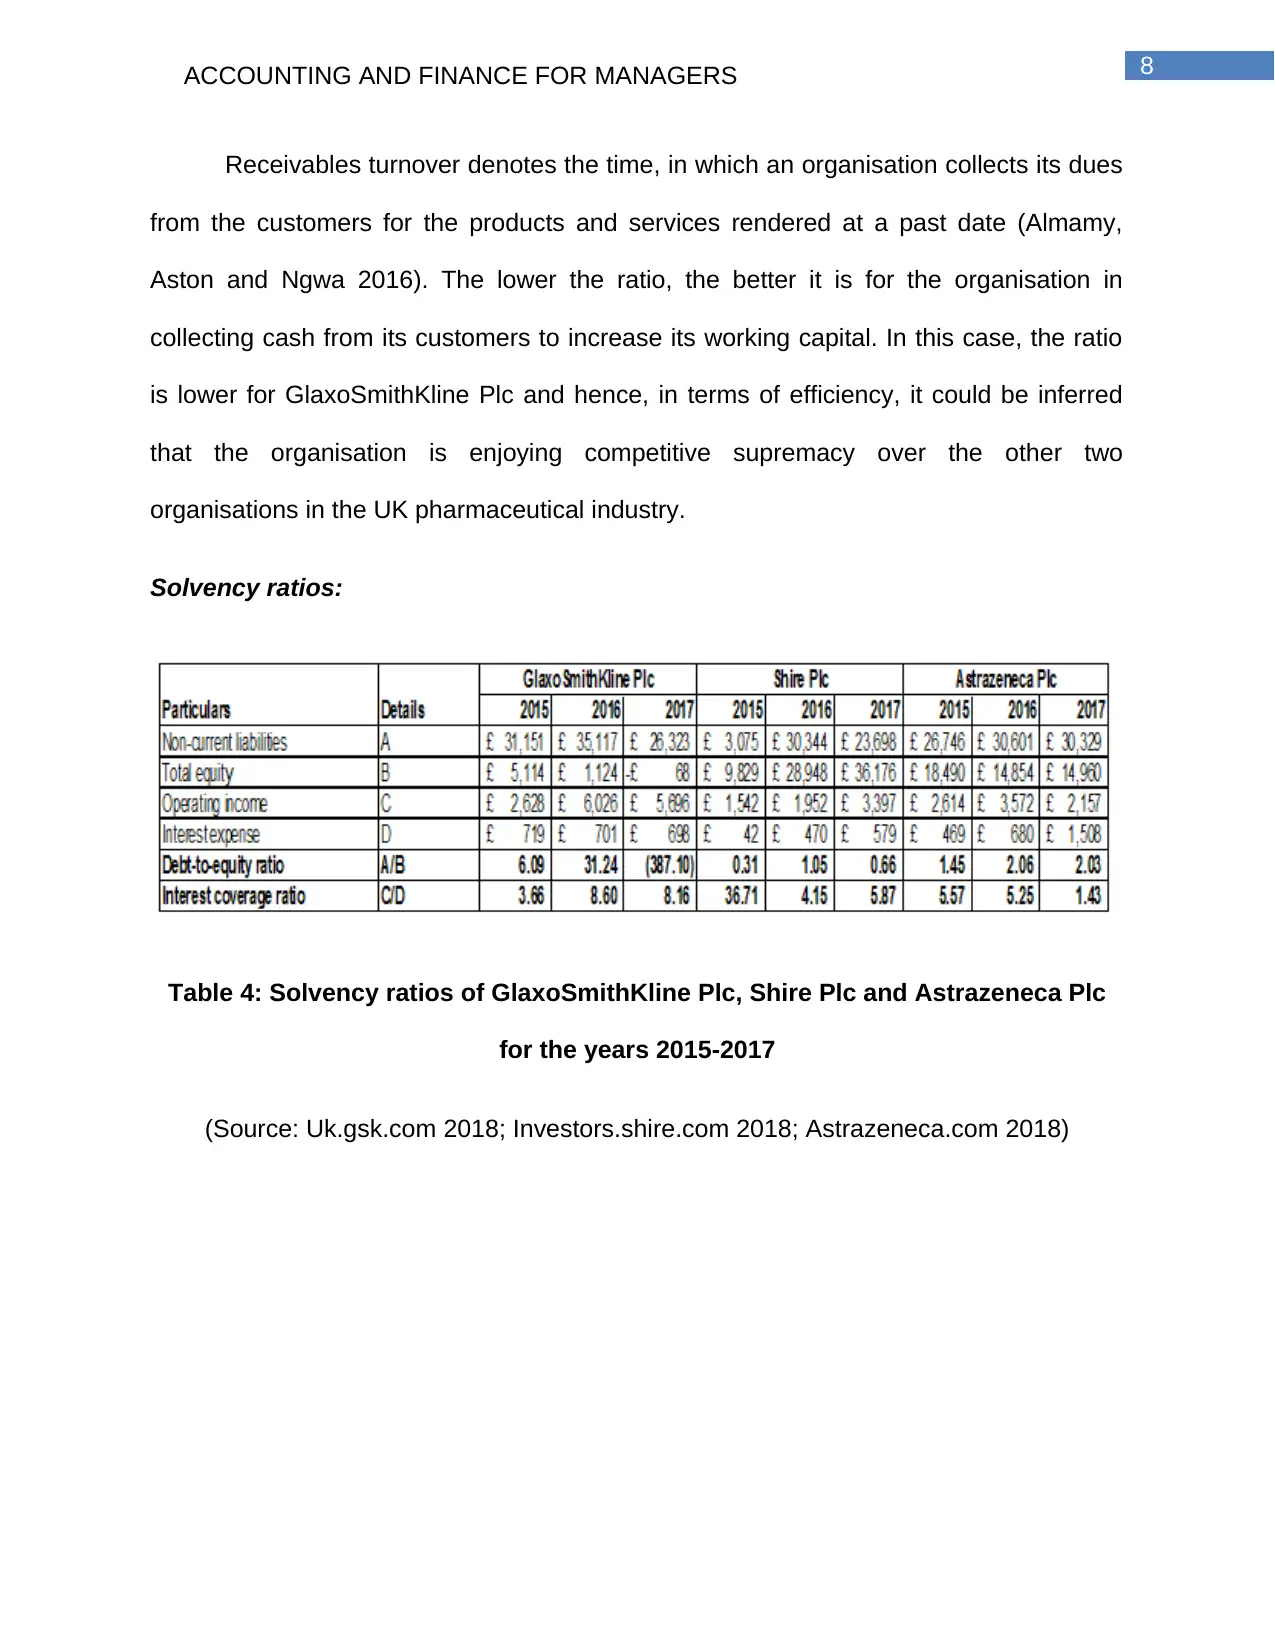
Solvency ratios:
Table 4: Solvency ratios of GlaxoSmithKline Plc, Shire Plc and Astrazeneca Plc
for the years 2015-2017
(Source: Uk.gsk.com 2018; Investors.shire.com 2018; Astrazeneca.com 2018)
Receivables turnover denotes the time, in which an organisation collects its dues
from the customers for the products and services rendered at a past date (Almamy,
Aston and Ngwa 2016). The lower the ratio, the better it is for the organisation in
collecting cash from its customers to increase its working capital. In this case, the ratio
is lower for GlaxoSmithKline Plc and hence, in terms of efficiency, it could be inferred
that the organisation is enjoying competitive supremacy over the other two
organisations in the UK pharmaceutical industry.
Solvency ratios:
Table 4: Solvency ratios of GlaxoSmithKline Plc, Shire Plc and Astrazeneca Plc
for the years 2015-2017
(Source: Uk.gsk.com 2018; Investors.shire.com 2018; Astrazeneca.com 2018)
⊘ This is a preview!⊘
Do you want full access?
Subscribe today to unlock all pages.
Trusted by 1+ million students worldwide
9ACCOUNTING AND FINANCE FOR MANAGERS
2015
2016
2017
2015
2016
2017
2015
2016
2017
GlaxoSmithKli
ne Plc Shire Plc Astrazeneca
Plc
-400.00
-350.00
-300.00
-250.00
-200.00
-150.00
-100.00
-50.00
-
50.00
Solvency Ratios
Interest coverage ratio
Debt-to-equity ratio
Figure 4: Solvency ratios of GlaxoSmithKline Plc, Shire Plc and Astrazeneca Plc
for the years 2015-2017
(Source: Uk.gsk.com 2018; Investors.shire.com 2018; Astrazeneca.com 2018)
Depending on the above figure, it could be stated that GlaxoSmithKline has
relied highly on debt financing for raising funds rather than equity financing. As a result,
it has increased the debt burden of the organisation severely, which might minimise the
overall return on investment for the shareholders of the organisation (Enekwe 2015). On
the other hand, the other two organisations have relied more on debt funding as well,
which denotes that they fail to attract sufficient investors for investing in their
organisations. However, out of the three firms, the ratio is lower for Shire Plc and the
lower the ratio; the better it is for the organisation. Thus, in terms of gearing, Shire Plc is
enjoying competitive advantage in the market.
In terms of interest coverage ratio, GlaxoSmithKline Plc is enjoying a better
position in the sector, as the ratio is increasing over the years. In case of Shire Plc, the
2015
2016
2017
2015
2016
2017
2015
2016
2017
GlaxoSmithKli
ne Plc Shire Plc Astrazeneca
Plc
-400.00
-350.00
-300.00
-250.00
-200.00
-150.00
-100.00
-50.00
-
50.00
Solvency Ratios
Interest coverage ratio
Debt-to-equity ratio
Figure 4: Solvency ratios of GlaxoSmithKline Plc, Shire Plc and Astrazeneca Plc
for the years 2015-2017
(Source: Uk.gsk.com 2018; Investors.shire.com 2018; Astrazeneca.com 2018)
Depending on the above figure, it could be stated that GlaxoSmithKline has
relied highly on debt financing for raising funds rather than equity financing. As a result,
it has increased the debt burden of the organisation severely, which might minimise the
overall return on investment for the shareholders of the organisation (Enekwe 2015). On
the other hand, the other two organisations have relied more on debt funding as well,
which denotes that they fail to attract sufficient investors for investing in their
organisations. However, out of the three firms, the ratio is lower for Shire Plc and the
lower the ratio; the better it is for the organisation. Thus, in terms of gearing, Shire Plc is
enjoying competitive advantage in the market.
In terms of interest coverage ratio, GlaxoSmithKline Plc is enjoying a better
position in the sector, as the ratio is increasing over the years. In case of Shire Plc, the
Paraphrase This Document
Need a fresh take? Get an instant paraphrase of this document with our AI Paraphraser
10ACCOUNTING AND FINANCE FOR MANAGERS
ratio has fallen massively in 2016 even though a slight increase is observed in 2017.
For Astrazeneca Plc, the ratio has declined over the years. Hence, it could be stated
that GlaxoSmithKline has better capability of clearing off its financing cost with the help
of adequate operating income.
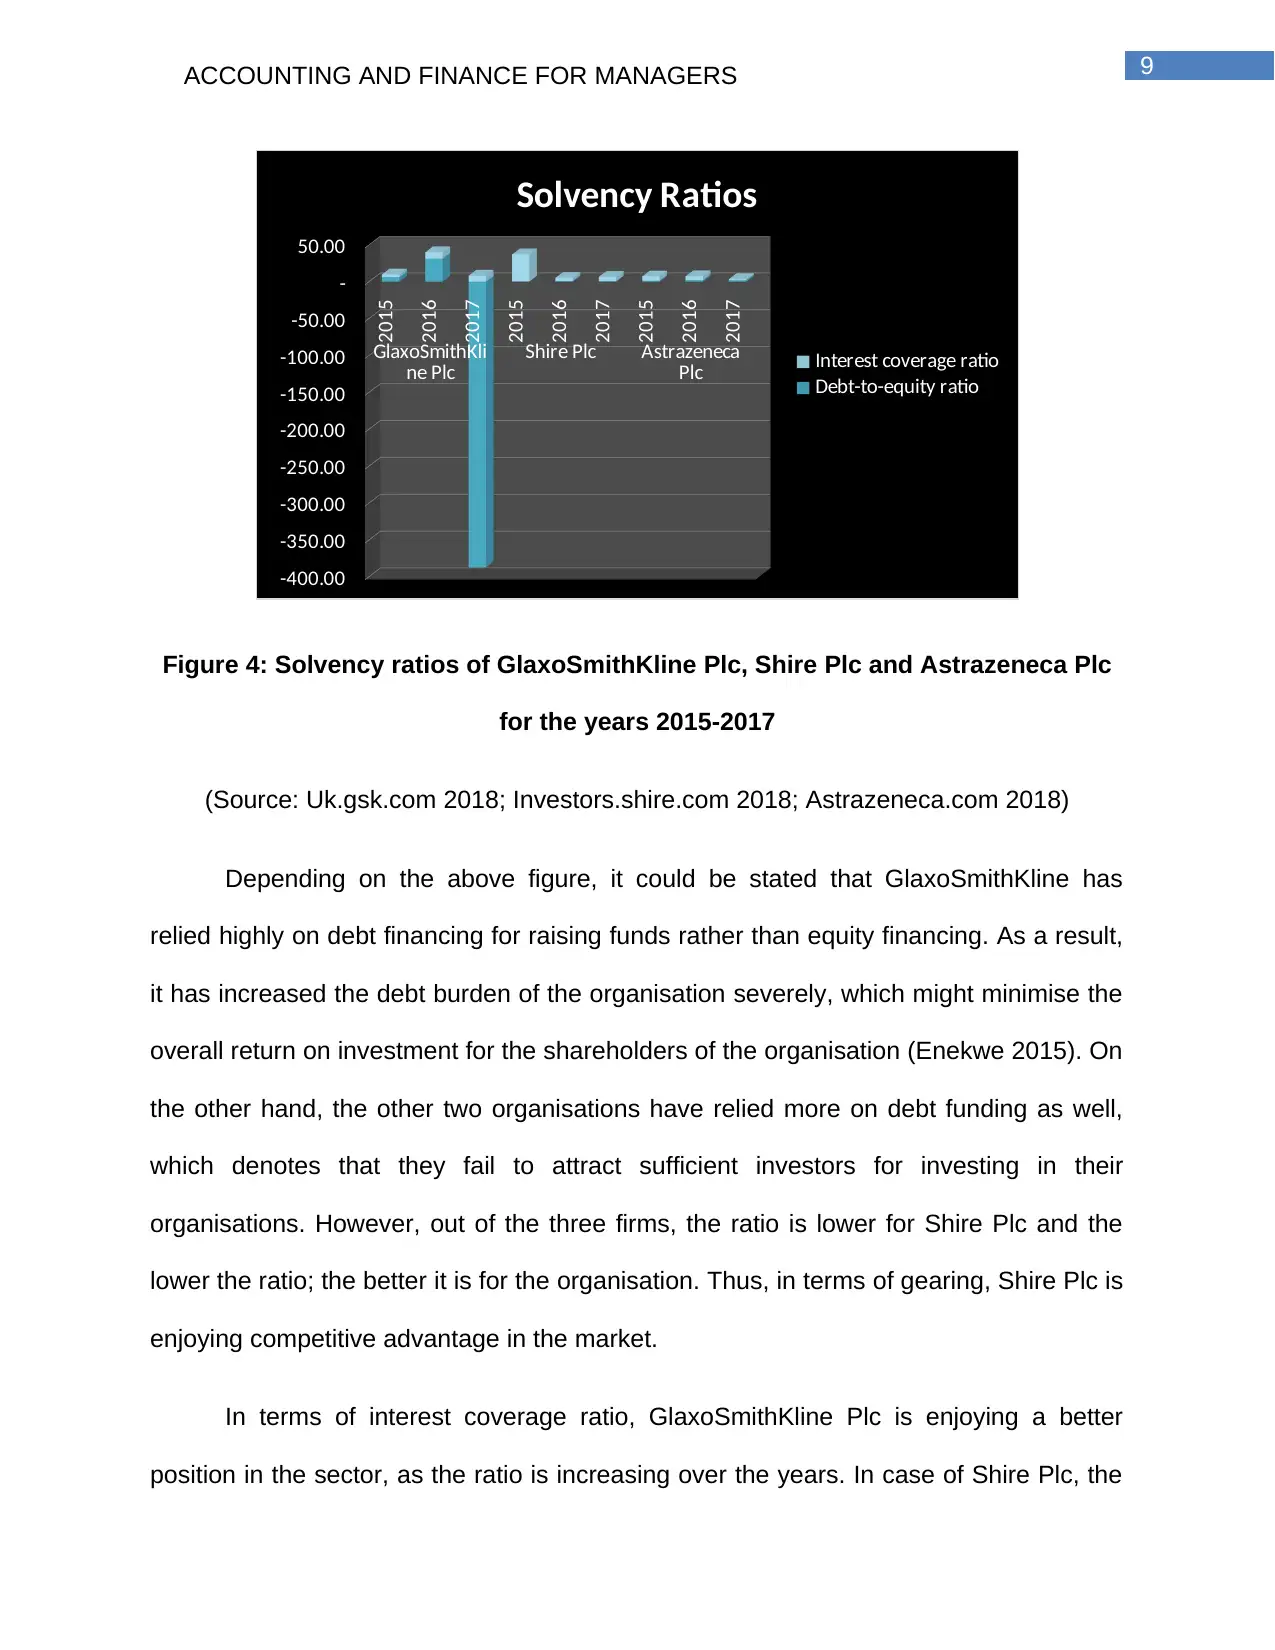
Investment ratios:
2015 2016 2017 2015 2016 2017 2015 2016 2017
Marke value per share A 0.4035£ 0.3779£ 0.3547£ 0.2050£ 0.1703£ 0.1551£ 0.3395£ 0.2732£ 0.3470£
Earnings per share B 3.49£ 0.38£ 0.63£ 6.62£ 1.29£ 14.13£ 2.23£ 2.77£ 2.37£
Annual dividend C 3,892£ 3,892£ 3,892£ 134.40£ 171.30£ 281.30£ 3,519£ 3,561£ 3,486£
Net profit D 8,422£ 912£ 1,532£ 1,303£ 327£ 4,272£ 2,825£ 3,406£ 2,868£
Price/earnings ratio A/B 0.12 0.99 0.56 0.03 0.13 0.01 0.15 0.10 0.15
Dividend payout ratio C/D 0.46 4.27 2.54 0.10 0.52 0.07 1.25 1.05 1.22
Particulars Details
GlaxoSmithKline Plc Shire Plc Astrazeneca Plc
Table 5: Investment ratios of GlaxoSmithKline Plc, Shire Plc and Astrazeneca Plc
for the years 2015-2017
(Source: Uk.gsk.com 2018; Investors.shire.com 2018; Astrazeneca.com 2018)
2015
2016
2017
2015
2016
2017
2015
2016
2017
GlaxoSmithKlin
e Plc Shire Plc Astrazeneca Plc
0.00
0.50
1.00
1.50
2.00
2.50
3.00
3.50
4.00
4.50
Investment Ratios
Price/earnings ratio
Dividend payout ratio
ratio has fallen massively in 2016 even though a slight increase is observed in 2017.
For Astrazeneca Plc, the ratio has declined over the years. Hence, it could be stated
that GlaxoSmithKline has better capability of clearing off its financing cost with the help
of adequate operating income.
Investment ratios:
2015 2016 2017 2015 2016 2017 2015 2016 2017
Marke value per share A 0.4035£ 0.3779£ 0.3547£ 0.2050£ 0.1703£ 0.1551£ 0.3395£ 0.2732£ 0.3470£
Earnings per share B 3.49£ 0.38£ 0.63£ 6.62£ 1.29£ 14.13£ 2.23£ 2.77£ 2.37£
Annual dividend C 3,892£ 3,892£ 3,892£ 134.40£ 171.30£ 281.30£ 3,519£ 3,561£ 3,486£
Net profit D 8,422£ 912£ 1,532£ 1,303£ 327£ 4,272£ 2,825£ 3,406£ 2,868£
Price/earnings ratio A/B 0.12 0.99 0.56 0.03 0.13 0.01 0.15 0.10 0.15
Dividend payout ratio C/D 0.46 4.27 2.54 0.10 0.52 0.07 1.25 1.05 1.22
Particulars Details
GlaxoSmithKline Plc Shire Plc Astrazeneca Plc
Table 5: Investment ratios of GlaxoSmithKline Plc, Shire Plc and Astrazeneca Plc
for the years 2015-2017
(Source: Uk.gsk.com 2018; Investors.shire.com 2018; Astrazeneca.com 2018)
2015
2016
2017
2015
2016
2017
2015
2016
2017
GlaxoSmithKlin
e Plc Shire Plc Astrazeneca Plc
0.00
0.50
1.00
1.50
2.00
2.50
3.00
3.50
4.00
4.50
Investment Ratios
Price/earnings ratio
Dividend payout ratio
11ACCOUNTING AND FINANCE FOR MANAGERS
Figure 5: Investment ratios of GlaxoSmithKline Plc, Shire Plc and Astrazeneca Plc
for the years 2015-2017
(Source: Uk.gsk.com 2018; Investors.shire.com 2018; Astrazeneca.com 2018)
The price earnings ratio denotes the ability of a firm in generating adequate
returns in future to the shareholders (Lin et al. 2015). The higher the ratio, the better it is
for the organisation. In this case, GlaxoSmithKline is enjoying competitive advantage
over the two other chosen organisations as well, as its ratio is higher in contrast to
them. In addition, the dividend payout ratio is higher for GlaxoSmithKline as well, which
denotes that the organisation has maintained paying its dividends at a stable rate to its
shareholders despite the lowering income and falling demand in the market. Hence,
from the investing point of view, GlaxoSmithKline is in a favourable position in the UK
pharmaceuticals industry.
Non-financial ratios:
The two non-financial ratios that have been considered for analysing the
business performance of the three selected organisations include number of employees
and product returns ratio.
2015 2016 2017 2015 2016 2017 2015 2016 2017
Number of employees 101,255 99,300 98,462 25,500 24,000 22,000 59,700 61,500 59,700
Percent increase/decrease -1.93% -0.84% -5.88% -8.33% 3.02% -2.93%
Net sales 23,923£ 27,889£ 30,186£ 6,417£ 11,397£ 15,161£ 24,708£ 23,002£ 22,465£
Sales return 2,500£ 2,900£ 3,100£ 1,200£ 1,350£ 1,000£ 2,200£ 2,350£ 2,550£
Gross sales 26,423£ 30,789£ 33,286£ 7,617£ 12,747£ 16,161£ 26,908£ 25,352£ 25,015£
Sales return to gross sales ratio 9.46% 9.42% 9.31% 15.75% 10.59% 6.19% 8.18% 9.27% 10.19%
GlaxoSmithKline Plc Shire Plc Astrazeneca Plc
Particulars
⊘ This is a preview!⊘
Do you want full access?
Subscribe today to unlock all pages.
Trusted by 1+ million students worldwide
1 out of 28
Related Documents


Your All-in-One AI-Powered Toolkit for Academic Success.
+13062052269
info@desklib.com
Available 24*7 on WhatsApp / Email
![[object Object]](/_next/static/media/star-bottom.7253800d.svg)
Unlock your academic potential
Copyright © 2020–2026 A2Z Services. All Rights Reserved. Developed and managed by ZUCOL.