BUACC1508 - Financial Ratio Analysis of Billabong International Ltd
VerifiedAdded on 2023/06/11
|12
|3300
|387
Report
AI Summary
This report provides a detailed financial ratio analysis of Billabong International Limited, utilizing data from the company's financial reports for the years ending 2016 and 2017. The analysis covers profitability ratios (net profit margin, return on assets), efficiency ratios (asset utilization rate), liquidity ratios (current ratio, quick ratio), and investment ratios (earnings per share). The report concludes that Billabong International Limited has been experiencing losses, particularly evident in the negative earnings per share, and recommends that investors exercise caution. The document includes detailed calculations and interpretations of each ratio, offering insights into the company's financial health and operational efficiency. The report also contains a recommendation against investment in the company based on the findings of the ratio analysis.
DETAIL OF FINANCIAL RATIOS
Course Name:
Course Number:
Name of the Course Coordinator:
Trimester, Year and Date of Submission:
5/29/2018
Course Name:
Course Number:
Name of the Course Coordinator:
Trimester, Year and Date of Submission:
5/29/2018
Paraphrase This Document
Need a fresh take? Get an instant paraphrase of this document with our AI Paraphraser
Contents
EXECUTIVE SUMMARY.................................................................................................................................2
BACKGROUND – COMPANY OVERVIEW......................................................................................................3
ANALYSIS OF RATIOS...................................................................................................................................4
CONCLUSION AND FINDINGS......................................................................................................................8
RECOMMENDATION....................................................................................................................................8
APPENDICES................................................................................................................................................9
REFERENCES..............................................................................................................................................11
EXECUTIVE SUMMARY
The accounting ratios are used for analyzing the present condition and the working of the each
and every company operating in World. It details as to how the company has grown over the past
years since its inception in the market. The report has been formed with the two major purposes.
First purpose has been calculating the accounting ratios for the last two years and analyzing the
same with the reasons as to why the company is having the particular ratio with the specific
figure. The second purpose has been to recommend the investor whether they should invest in
the company or not in accordance with the analysis and interpretation of the results of the
accounting ratios. It has been recommended that the investor should not invest in the particular
company. With these purposes and the considerations the report has been framed and presented
into proper headings and adequate recommendation.
BACKGROUND – COMPANY OVERVIEW
The title of the report has been the detail of financial ratios. As the title suggests the whole of the
report has revolved around the accounting ratios and its deep interpretation and analysis. The
analysis can only be made with the help of the figures and the relevant data and accordingly the
reliable source shall be there. For the furtherance of the report, the company that has been
selected is the Billabong International Limited.
The company has been formed and founded in the year of nineteen hundred and seventy three
only. It is based in the country of Australia, Queensland and has been founded by the first
promoter and the founder known by the name of Golden Merchant. In the beginning of the
operations of the company, it has started with the designing and the creation of the shorts which
they have started from the house only. After its preparation, they sell the same to the surfers.
After few months of this process, the merchant has started realizing the durability of the goods
and that too has been due to the process of having the triple stitching process. Soon the company
has realized that this product has gained reputation in the New Zealand and Australia and
according; has started entering into the business promotion activities and accordingly by the year
of the nineteen hundred and eighty, this product has been presented in the county of Australia.
With this success, the company has then started the export of their products and now the product
has been made available across the globe majorly in New Zealand, Japan and similar other
countries. The company has got itself registered under Stock exchange of Australia in the year of
two thousand and since then the company has been into the growing stage (Billabong
International Limited, 2017).
The company is basically engaged in the trading and wholesaling of apparels, wet suits, eye wear
and shorts and etc. The company also deals with the hard goods and services which includes
wear items in the board sports. The company has been operating under different brand names as
obtained for each of the product. The brand name includes the Billabong, Xcel, element, von
zipper and many more. The company has received the innovation and the invention award from
the department.
⊘ This is a preview!⊘
Do you want full access?
Subscribe today to unlock all pages.
Trusted by 1+ million students worldwide
The company has been in the continuous losses and there have been the times where the
performance of the company is not being deteriorated with the huge amount of the losses and the
same has been pending from the year of the two thousand and some losses have been found
covered in the year of two thousand and eleven but after that also the loss have been reporting as
on the day of the reporting period. Therefore, although there has been the market for the
company’s product and the customers also but the loss that has been reporting at end of the year
is high as compared to the earlier years.
The company has been into operations for the last so many year and in the next section the ratio
of the company in accounting and finance terms have been calculated and then analysed as to
what are the changing which have occurred for the last two years.
ANALYSIS OF RATIOS
Under this section, the accounting ratios have been calculated and each of the ratios has been
described as to how the same will have the effect and necessary impact on the profitability and
efficiency of the company. For the purpose of this section, the annual report of the company for
the year ending 2017 and for the year ending 2016 and accordingly the ratios has been
calculated. Following are the detailed analysis of the ratios along with the explanation as to why
it has reached such a level as defined and listed by the calculations so made and the detail of the
calculation has been marked as Appendix 1.
Profitability ratios - These are the ratios which help in assessing the profitability of the company.
Profitability is judged through the analysis of the statement of the profit and loss account which
is prepared on the annual basis. Statement of the profit and loss account is the part of the
financial statements of the company which acts as the basis for some stakeholders for taking the
decision regarding their vested interests. Apart from looking from the statement of the profit and
loss, it is necessary to have the ratios from the reported figures not only from the current year but
also for the prepare so that it can be checked as to how the company has been working and will
work (Horngren, 2012). Following two ratios have been calculated and laws have been discussed
in detail with regard to the functioning of the company:
Paraphrase This Document
Need a fresh take? Get an instant paraphrase of this document with our AI Paraphraser
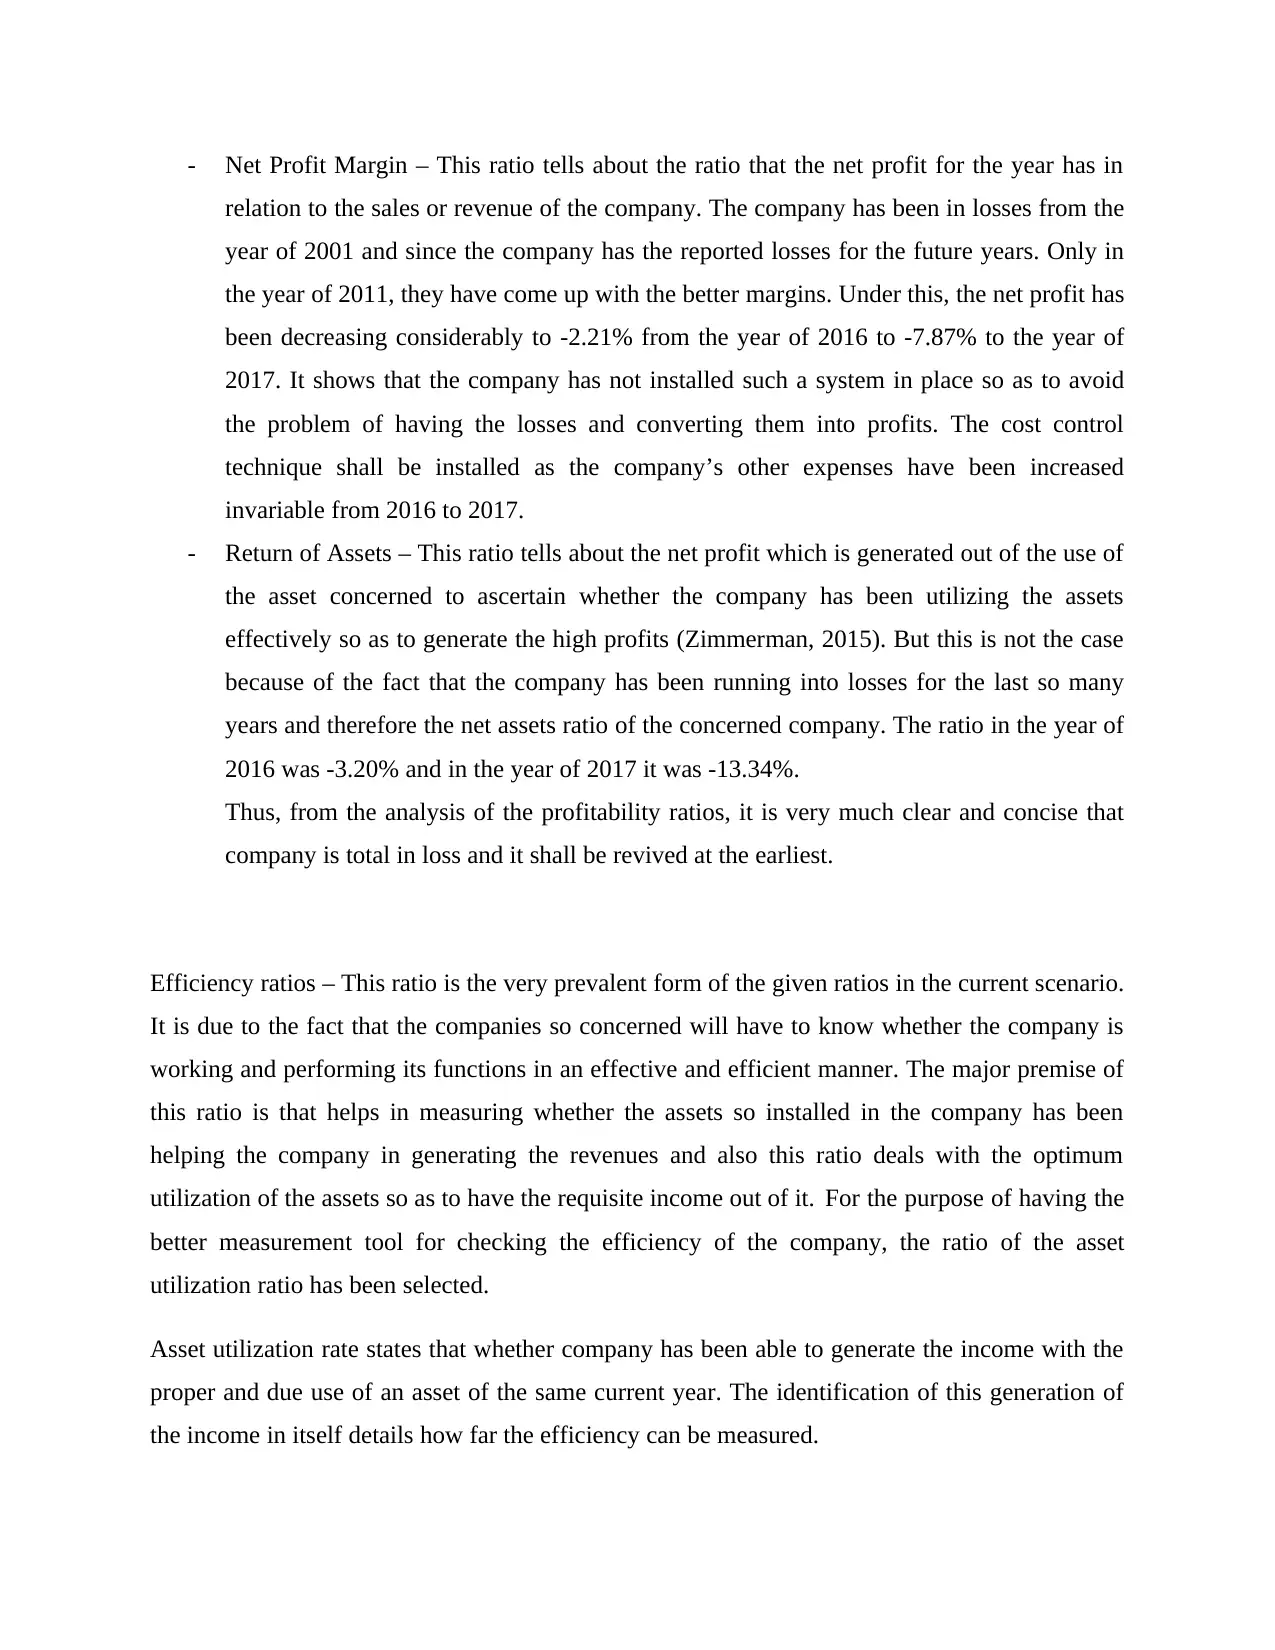
- Net Profit Margin – This ratio tells about the ratio that the net profit for the year has in
relation to the sales or revenue of the company. The company has been in losses from the
year of 2001 and since the company has the reported losses for the future years. Only in
the year of 2011, they have come up with the better margins. Under this, the net profit has
been decreasing considerably to -2.21% from the year of 2016 to -7.87% to the year of
2017. It shows that the company has not installed such a system in place so as to avoid
the problem of having the losses and converting them into profits. The cost control
technique shall be installed as the company’s other expenses have been increased
invariable from 2016 to 2017.
- Return of Assets – This ratio tells about the net profit which is generated out of the use of
the asset concerned to ascertain whether the company has been utilizing the assets
effectively so as to generate the high profits (Zimmerman, 2015). But this is not the case
because of the fact that the company has been running into losses for the last so many
years and therefore the net assets ratio of the concerned company. The ratio in the year of
2016 was -3.20% and in the year of 2017 it was -13.34%.
Thus, from the analysis of the profitability ratios, it is very much clear and concise that
company is total in loss and it shall be revived at the earliest.
Efficiency ratios – This ratio is the very prevalent form of the given ratios in the current scenario.
It is due to the fact that the companies so concerned will have to know whether the company is
working and performing its functions in an effective and efficient manner. The major premise of
this ratio is that helps in measuring whether the assets so installed in the company has been
helping the company in generating the revenues and also this ratio deals with the optimum
utilization of the assets so as to have the requisite income out of it. For the purpose of having the
better measurement tool for checking the efficiency of the company, the ratio of the asset
utilization ratio has been selected.
Asset utilization rate states that whether company has been able to generate the income with the
proper and due use of an asset of the same current year. The identification of this generation of
the income in itself details how far the efficiency can be measured.
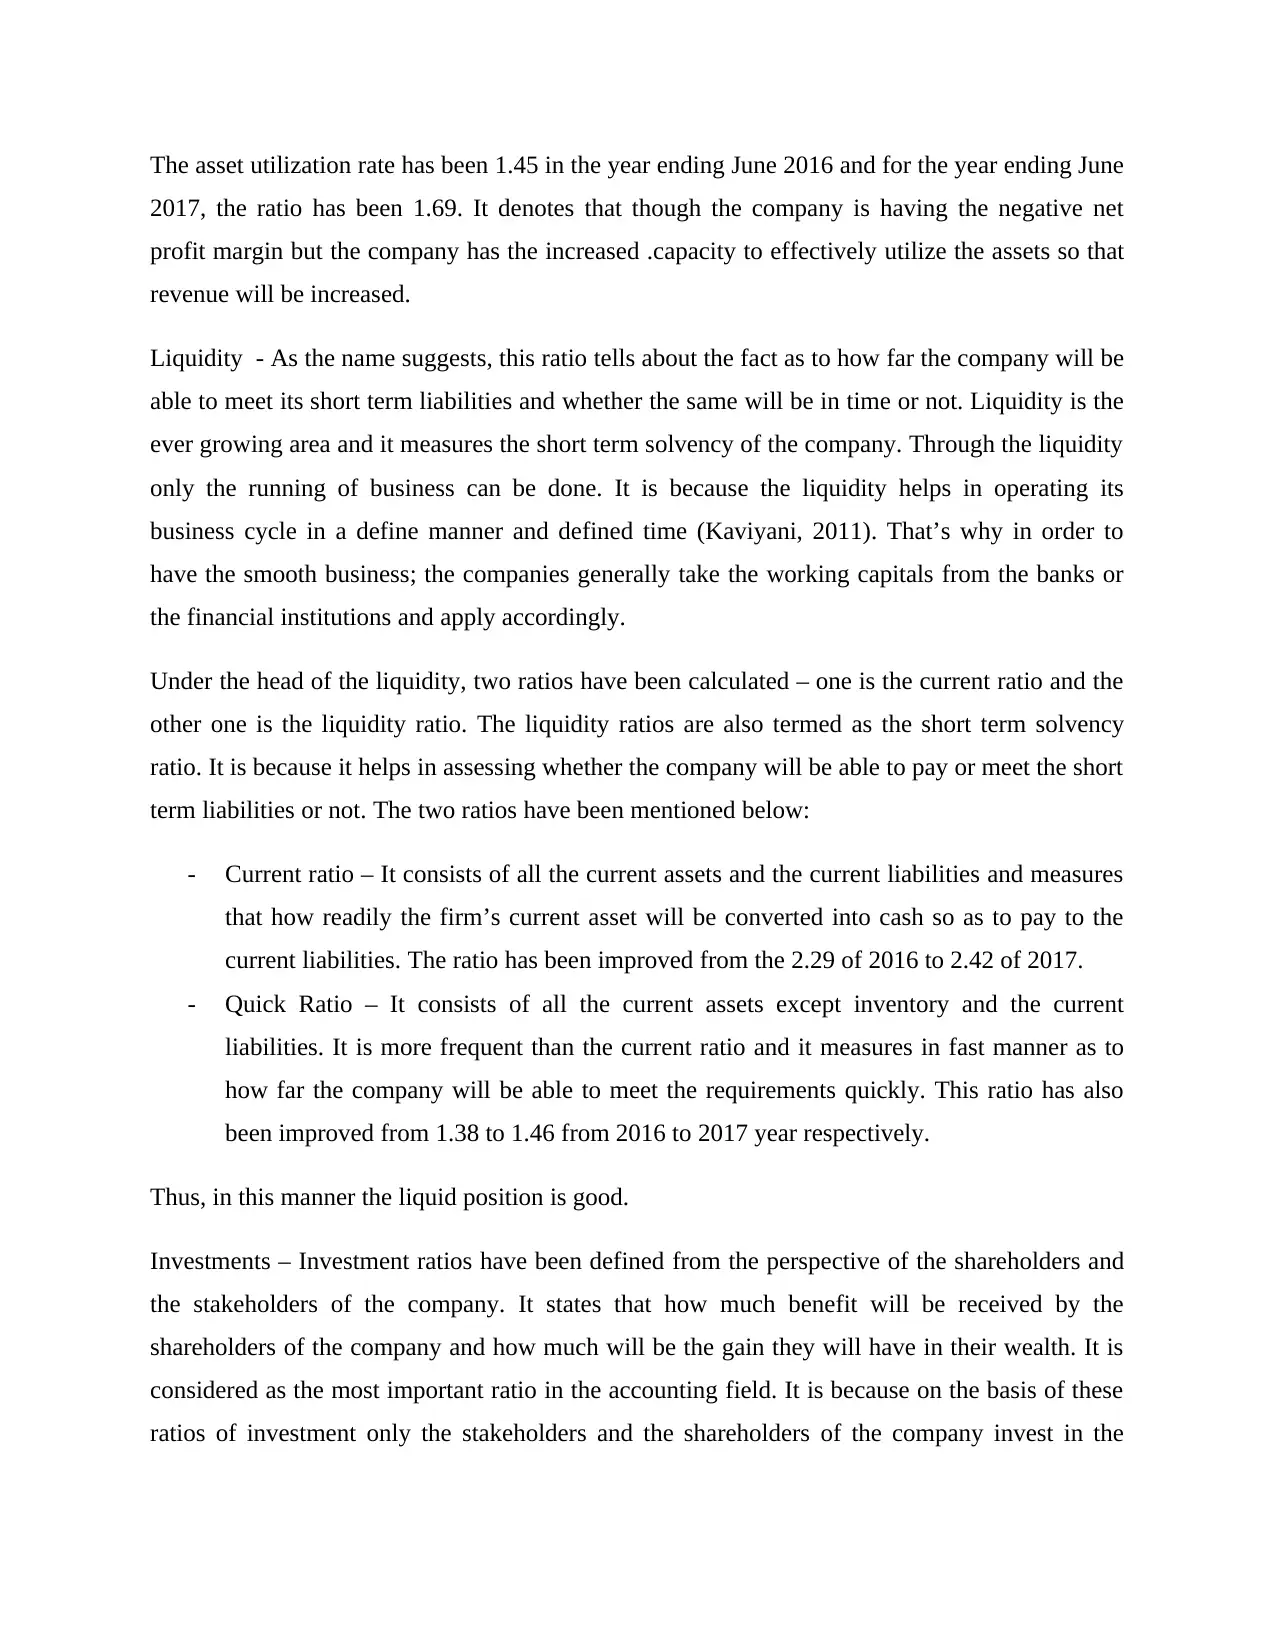
The asset utilization rate has been 1.45 in the year ending June 2016 and for the year ending June
2017, the ratio has been 1.69. It denotes that though the company is having the negative net
profit margin but the company has the increased .capacity to effectively utilize the assets so that
revenue will be increased.
Liquidity - As the name suggests, this ratio tells about the fact as to how far the company will be
able to meet its short term liabilities and whether the same will be in time or not. Liquidity is the
ever growing area and it measures the short term solvency of the company. Through the liquidity
only the running of business can be done. It is because the liquidity helps in operating its
business cycle in a define manner and defined time (Kaviyani, 2011). That’s why in order to
have the smooth business; the companies generally take the working capitals from the banks or
the financial institutions and apply accordingly.
Under the head of the liquidity, two ratios have been calculated – one is the current ratio and the
other one is the liquidity ratio. The liquidity ratios are also termed as the short term solvency
ratio. It is because it helps in assessing whether the company will be able to pay or meet the short
term liabilities or not. The two ratios have been mentioned below:
- Current ratio – It consists of all the current assets and the current liabilities and measures
that how readily the firm’s current asset will be converted into cash so as to pay to the
current liabilities. The ratio has been improved from the 2.29 of 2016 to 2.42 of 2017.
- Quick Ratio – It consists of all the current assets except inventory and the current
liabilities. It is more frequent than the current ratio and it measures in fast manner as to
how far the company will be able to meet the requirements quickly. This ratio has also
been improved from 1.38 to 1.46 from 2016 to 2017 year respectively.
Thus, in this manner the liquid position is good.
Investments – Investment ratios have been defined from the perspective of the shareholders and
the stakeholders of the company. It states that how much benefit will be received by the
shareholders of the company and how much will be the gain they will have in their wealth. It is
considered as the most important ratio in the accounting field. It is because on the basis of these
ratios of investment only the stakeholders and the shareholders of the company invest in the
⊘ This is a preview!⊘
Do you want full access?
Subscribe today to unlock all pages.
Trusted by 1+ million students worldwide
company and earns the dividend or other form of return (Premnath, 2012). Following ratios have
been calculated as shown in appendix and discussed:
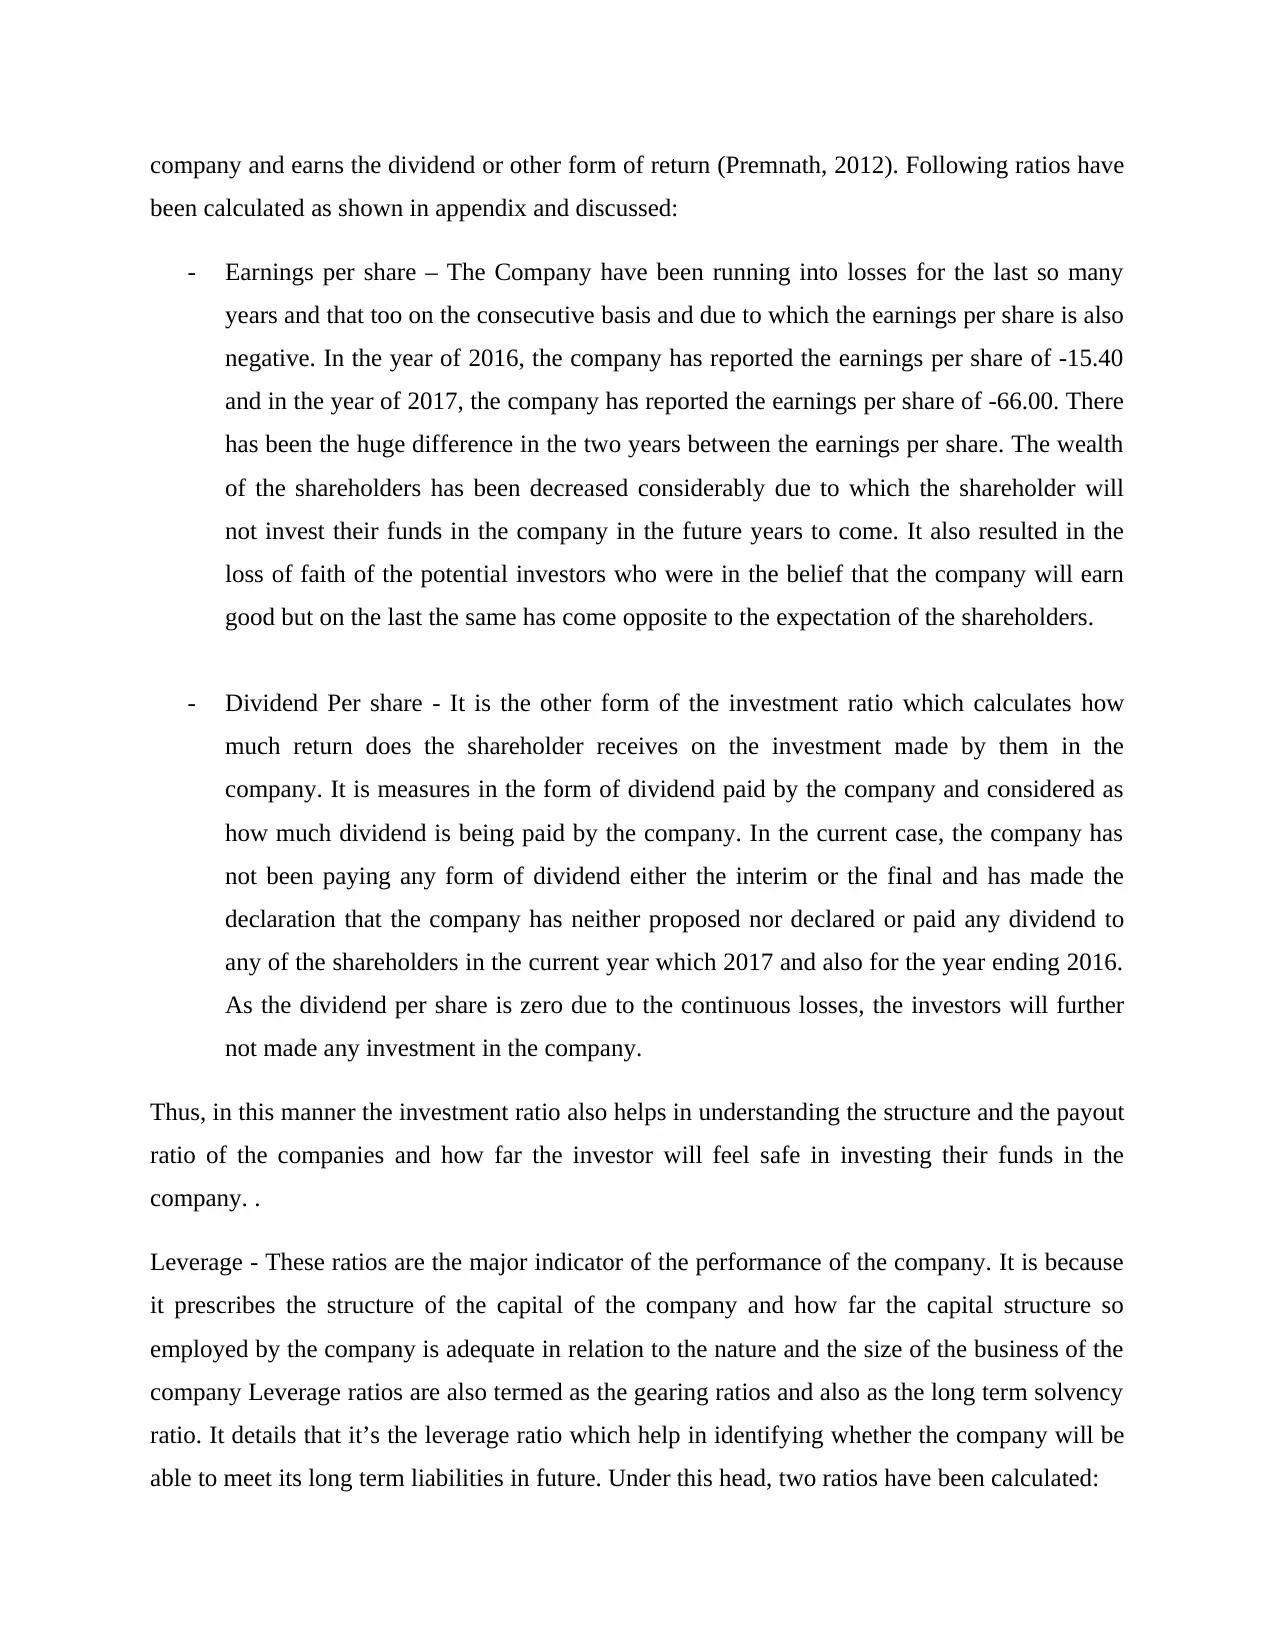
- Earnings per share – The Company have been running into losses for the last so many
years and that too on the consecutive basis and due to which the earnings per share is also
negative. In the year of 2016, the company has reported the earnings per share of -15.40
and in the year of 2017, the company has reported the earnings per share of -66.00. There
has been the huge difference in the two years between the earnings per share. The wealth
of the shareholders has been decreased considerably due to which the shareholder will
not invest their funds in the company in the future years to come. It also resulted in the
loss of faith of the potential investors who were in the belief that the company will earn
good but on the last the same has come opposite to the expectation of the shareholders.
- Dividend Per share - It is the other form of the investment ratio which calculates how
much return does the shareholder receives on the investment made by them in the
company. It is measures in the form of dividend paid by the company and considered as
how much dividend is being paid by the company. In the current case, the company has
not been paying any form of dividend either the interim or the final and has made the
declaration that the company has neither proposed nor declared or paid any dividend to
any of the shareholders in the current year which 2017 and also for the year ending 2016.
As the dividend per share is zero due to the continuous losses, the investors will further
not made any investment in the company.
Thus, in this manner the investment ratio also helps in understanding the structure and the payout
ratio of the companies and how far the investor will feel safe in investing their funds in the
company. .
Leverage - These ratios are the major indicator of the performance of the company. It is because
it prescribes the structure of the capital of the company and how far the capital structure so
employed by the company is adequate in relation to the nature and the size of the business of the
company Leverage ratios are also termed as the gearing ratios and also as the long term solvency
ratio. It details that it’s the leverage ratio which help in identifying whether the company will be
able to meet its long term liabilities in future. Under this head, two ratios have been calculated:
been calculated as shown in appendix and discussed:
- Earnings per share – The Company have been running into losses for the last so many
years and that too on the consecutive basis and due to which the earnings per share is also
negative. In the year of 2016, the company has reported the earnings per share of -15.40
and in the year of 2017, the company has reported the earnings per share of -66.00. There
has been the huge difference in the two years between the earnings per share. The wealth
of the shareholders has been decreased considerably due to which the shareholder will
not invest their funds in the company in the future years to come. It also resulted in the
loss of faith of the potential investors who were in the belief that the company will earn
good but on the last the same has come opposite to the expectation of the shareholders.
- Dividend Per share - It is the other form of the investment ratio which calculates how
much return does the shareholder receives on the investment made by them in the
company. It is measures in the form of dividend paid by the company and considered as
how much dividend is being paid by the company. In the current case, the company has
not been paying any form of dividend either the interim or the final and has made the
declaration that the company has neither proposed nor declared or paid any dividend to
any of the shareholders in the current year which 2017 and also for the year ending 2016.
As the dividend per share is zero due to the continuous losses, the investors will further
not made any investment in the company.
Thus, in this manner the investment ratio also helps in understanding the structure and the payout
ratio of the companies and how far the investor will feel safe in investing their funds in the
company. .
Leverage - These ratios are the major indicator of the performance of the company. It is because
it prescribes the structure of the capital of the company and how far the capital structure so
employed by the company is adequate in relation to the nature and the size of the business of the
company Leverage ratios are also termed as the gearing ratios and also as the long term solvency
ratio. It details that it’s the leverage ratio which help in identifying whether the company will be
able to meet its long term liabilities in future. Under this head, two ratios have been calculated:
Paraphrase This Document
Need a fresh take? Get an instant paraphrase of this document with our AI Paraphraser
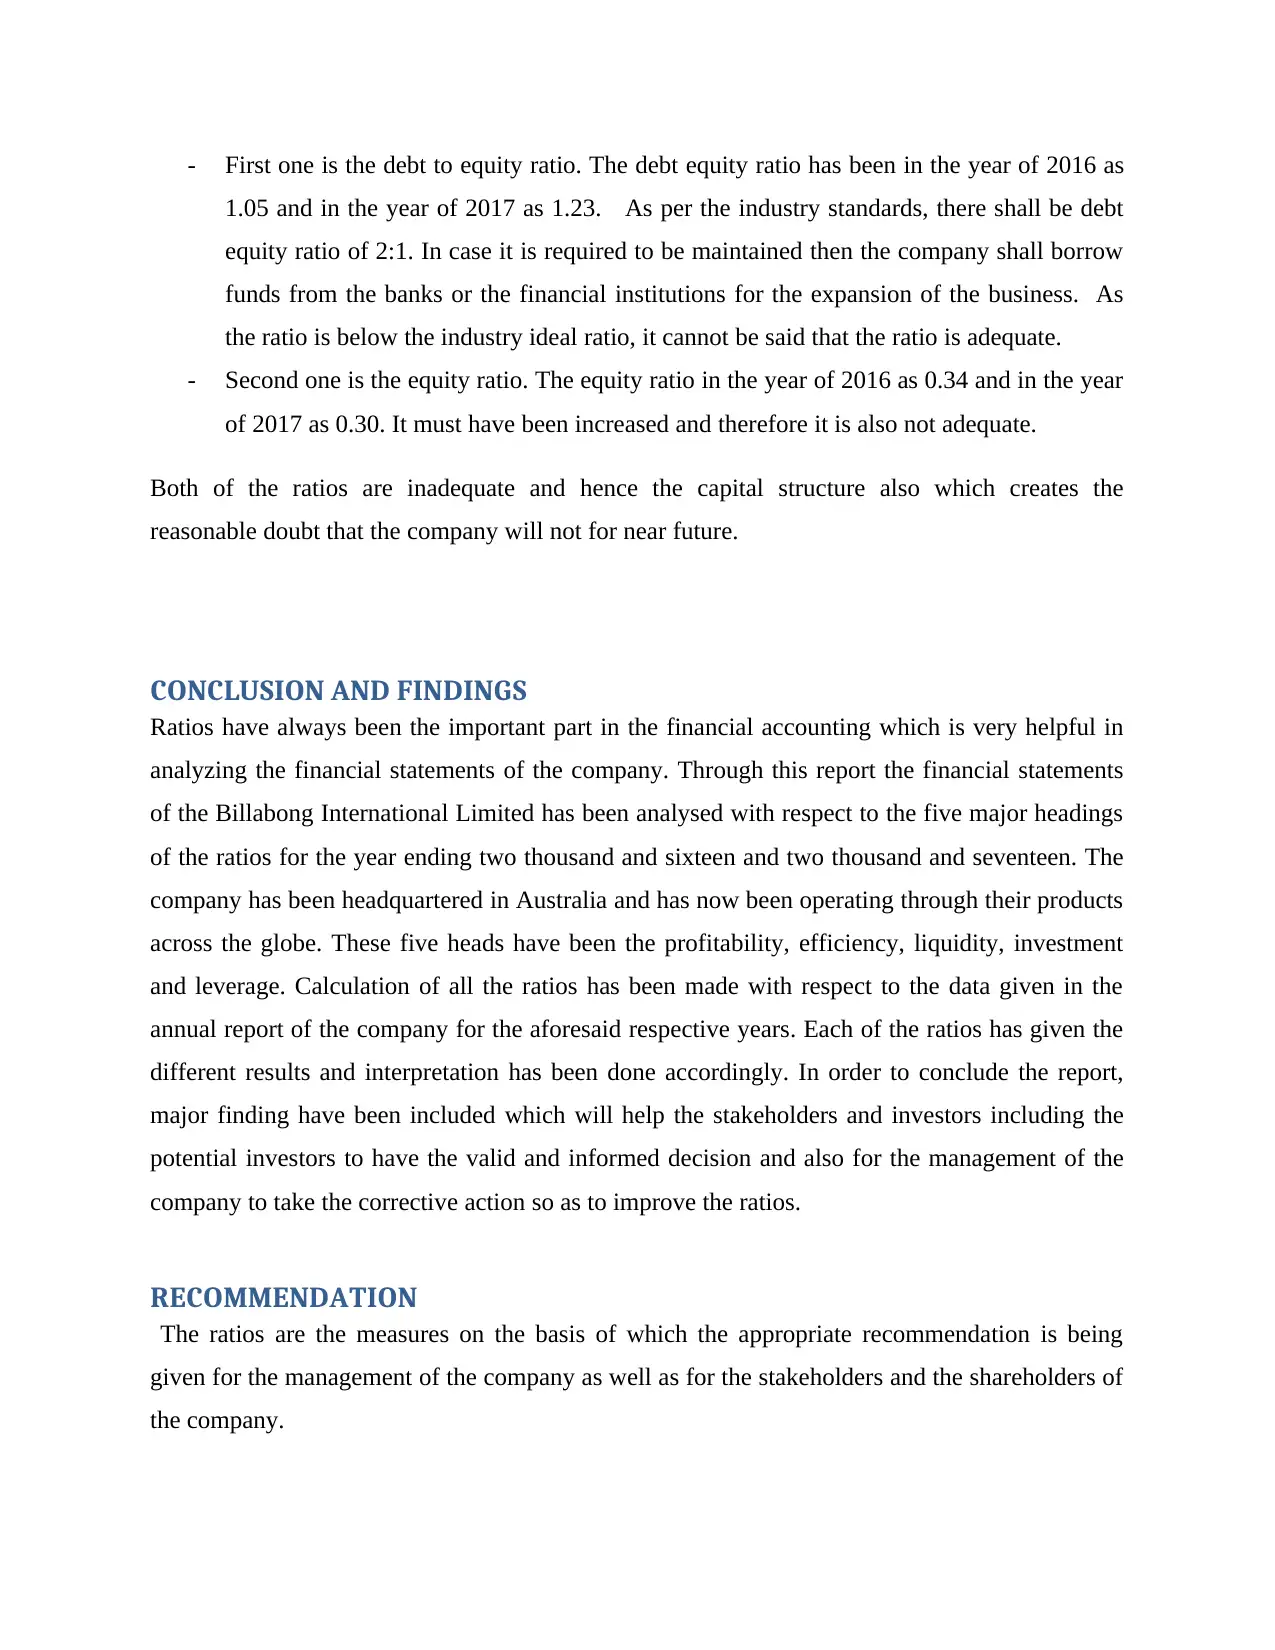
- First one is the debt to equity ratio. The debt equity ratio has been in the year of 2016 as
1.05 and in the year of 2017 as 1.23. As per the industry standards, there shall be debt
equity ratio of 2:1. In case it is required to be maintained then the company shall borrow
funds from the banks or the financial institutions for the expansion of the business. As
the ratio is below the industry ideal ratio, it cannot be said that the ratio is adequate.
- Second one is the equity ratio. The equity ratio in the year of 2016 as 0.34 and in the year
of 2017 as 0.30. It must have been increased and therefore it is also not adequate.
Both of the ratios are inadequate and hence the capital structure also which creates the
reasonable doubt that the company will not for near future.
CONCLUSION AND FINDINGS
Ratios have always been the important part in the financial accounting which is very helpful in
analyzing the financial statements of the company. Through this report the financial statements
of the Billabong International Limited has been analysed with respect to the five major headings
of the ratios for the year ending two thousand and sixteen and two thousand and seventeen. The
company has been headquartered in Australia and has now been operating through their products
across the globe. These five heads have been the profitability, efficiency, liquidity, investment
and leverage. Calculation of all the ratios has been made with respect to the data given in the
annual report of the company for the aforesaid respective years. Each of the ratios has given the
different results and interpretation has been done accordingly. In order to conclude the report,
major finding have been included which will help the stakeholders and investors including the
potential investors to have the valid and informed decision and also for the management of the
company to take the corrective action so as to improve the ratios.
RECOMMENDATION
The ratios are the measures on the basis of which the appropriate recommendation is being
given for the management of the company as well as for the stakeholders and the shareholders of
the company.
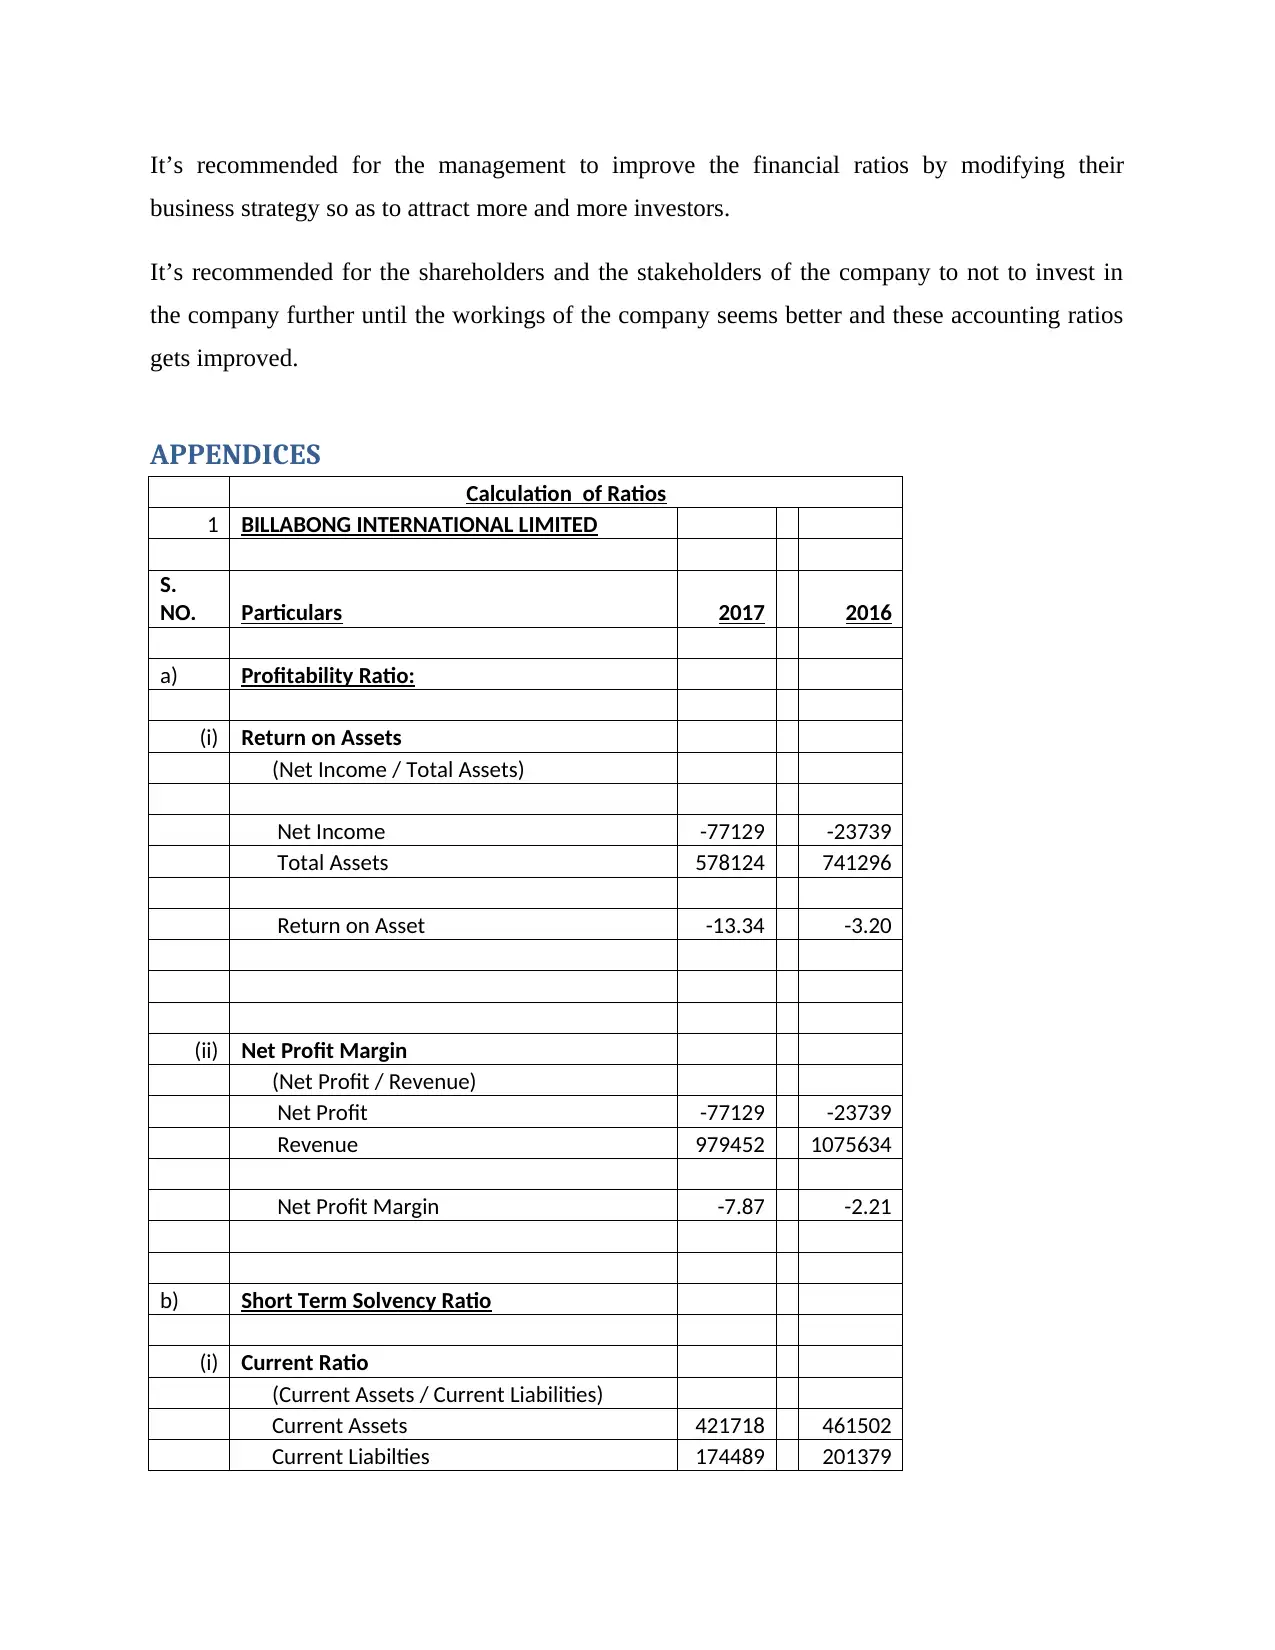
It’s recommended for the management to improve the financial ratios by modifying their
business strategy so as to attract more and more investors.
It’s recommended for the shareholders and the stakeholders of the company to not to invest in
the company further until the workings of the company seems better and these accounting ratios
gets improved.
APPENDICES
Calculation of Ratios
1 BILLABONG INTERNATIONAL LIMITED
S.
NO. Particulars 2017 2016
a) Profitability Ratio:
(i) Return on Assets
(Net Income / Total Assets)
Net Income -77129 -23739
Total Assets 578124 741296
Return on Asset -13.34 -3.20
(ii) Net Profit Margin
(Net Profit / Revenue)
Net Profit -77129 -23739
Revenue 979452 1075634
Net Profit Margin -7.87 -2.21
b) Short Term Solvency Ratio
(i) Current Ratio
(Current Assets / Current Liabilities)
Current Assets 421718 461502
Current Liabilties 174489 201379
⊘ This is a preview!⊘
Do you want full access?
Subscribe today to unlock all pages.
Trusted by 1+ million students worldwide
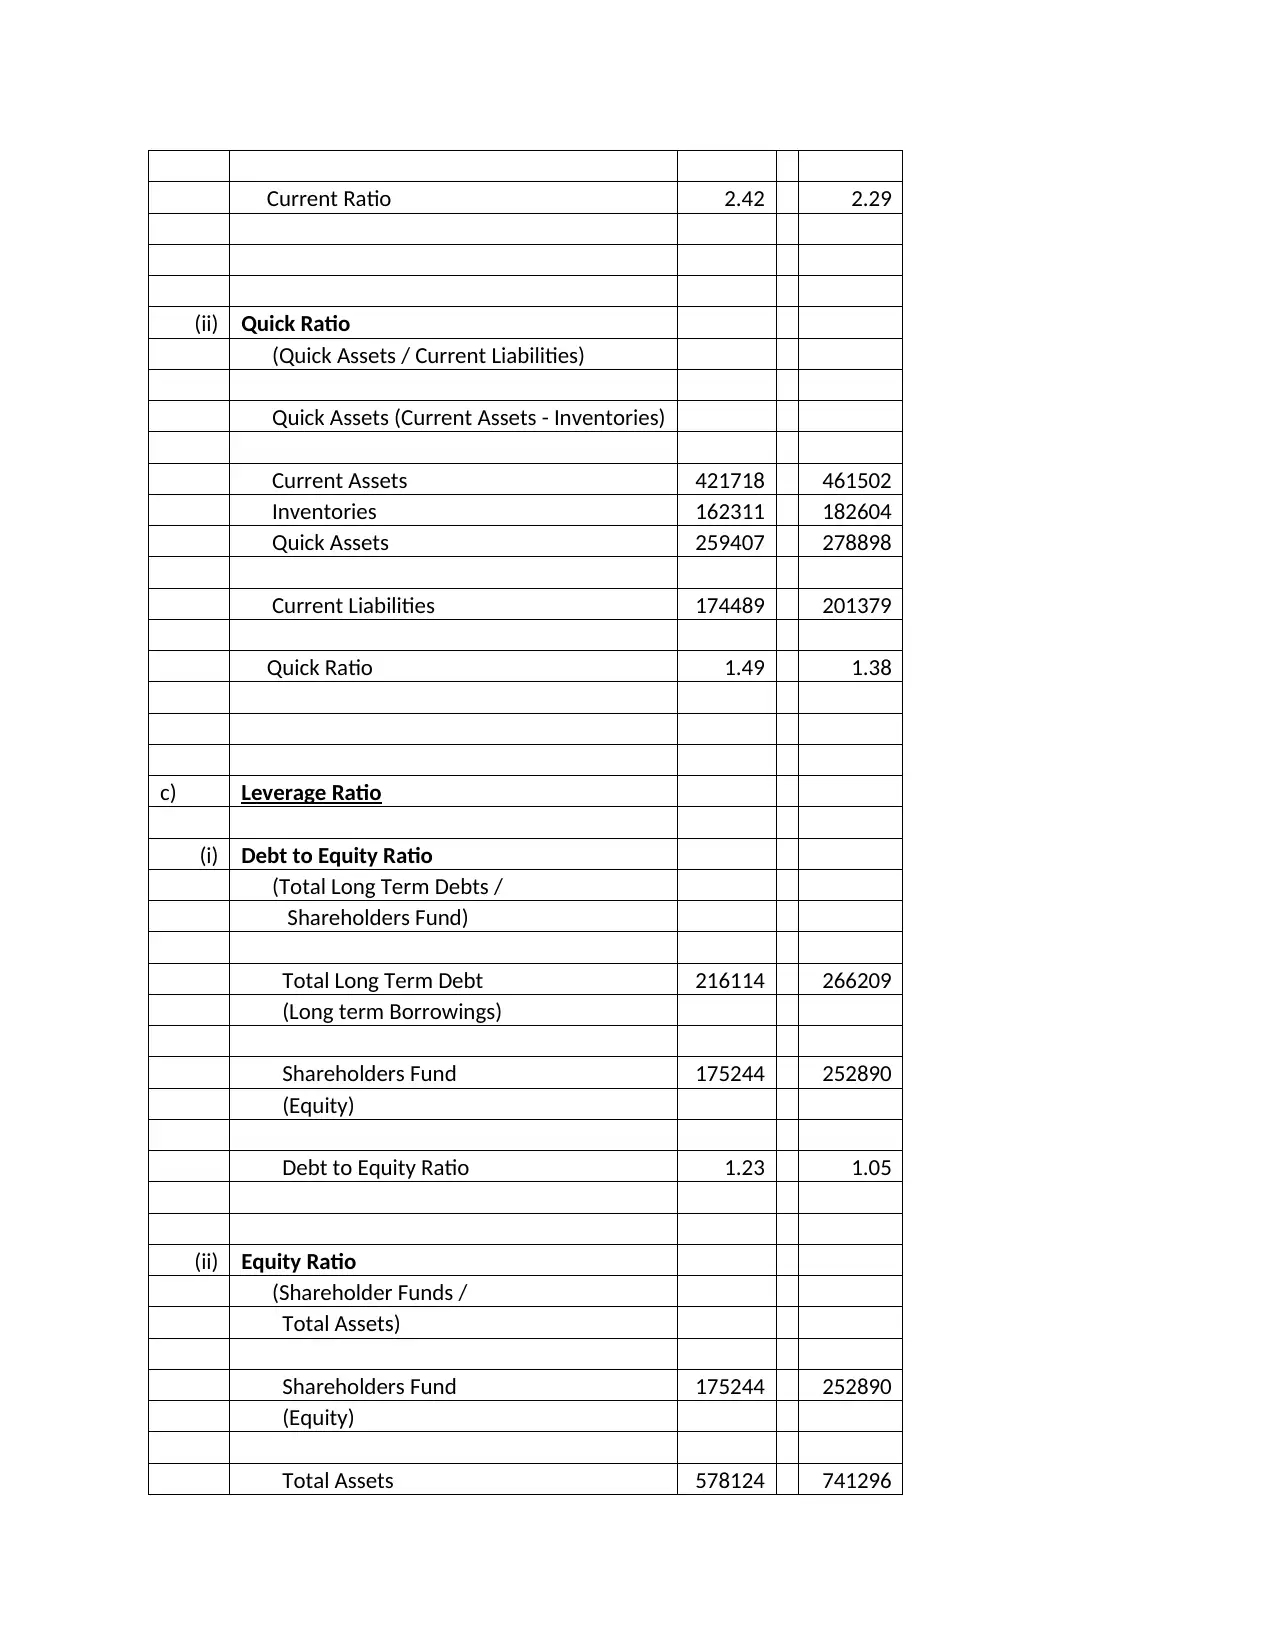
Current Ratio 2.42 2.29
(ii) Quick Ratio
(Quick Assets / Current Liabilities)
Quick Assets (Current Assets - Inventories)
Current Assets 421718 461502
Inventories 162311 182604
Quick Assets 259407 278898
Current Liabilities 174489 201379
Quick Ratio 1.49 1.38
c) Leverage Ratio
(i) Debt to Equity Ratio
(Total Long Term Debts /
Shareholders Fund)
Total Long Term Debt 216114 266209
(Long term Borrowings)
Shareholders Fund 175244 252890
(Equity)
Debt to Equity Ratio 1.23 1.05
(ii) Equity Ratio
(Shareholder Funds /
Total Assets)
Shareholders Fund 175244 252890
(Equity)
Total Assets 578124 741296
Paraphrase This Document
Need a fresh take? Get an instant paraphrase of this document with our AI Paraphraser
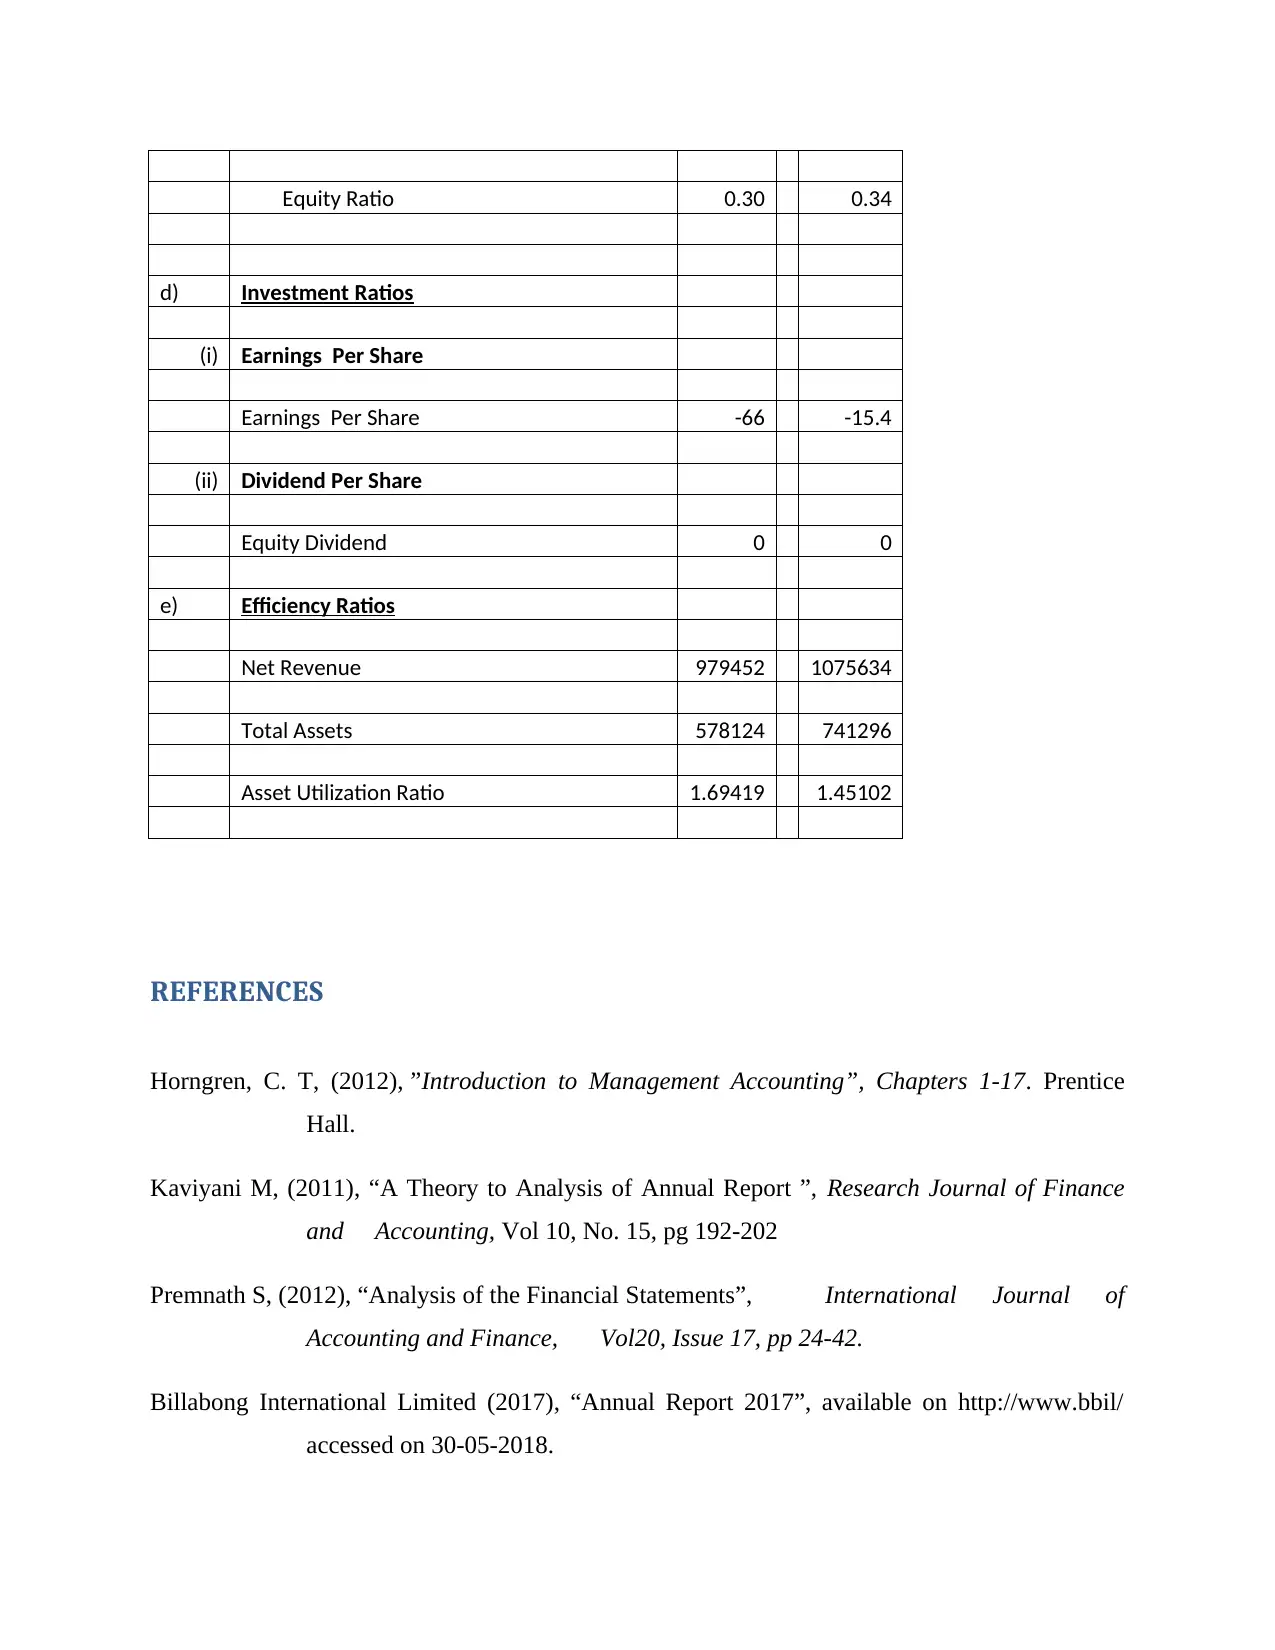
Equity Ratio 0.30 0.34
d) Investment Ratios
(i) Earnings Per Share
Earnings Per Share -66 -15.4
(ii) Dividend Per Share
Equity Dividend 0 0
e) Efficiency Ratios
Net Revenue 979452 1075634
Total Assets 578124 741296
Asset Utilization Ratio 1.69419 1.45102
REFERENCES
Horngren, C. T, (2012), ”Introduction to Management Accounting”, Chapters 1-17. Prentice
Hall.
Kaviyani M, (2011), “A Theory to Analysis of Annual Report ”, Research Journal of Finance
and Accounting, Vol 10, No. 15, pg 192-202
Premnath S, (2012), “Analysis of the Financial Statements”, International Journal of
Accounting and Finance, Vol20, Issue 17, pp 24-42.
Billabong International Limited (2017), “Annual Report 2017”, available on http://www.bbil/
accessed on 30-05-2018.
Zimmerman, (2015), “Accounting for Managers” Issues in Accounting Education, 35, 77-99.
⊘ This is a preview!⊘
Do you want full access?
Subscribe today to unlock all pages.
Trusted by 1+ million students worldwide
1 out of 12
Related Documents


Your All-in-One AI-Powered Toolkit for Academic Success.
+13062052269
info@desklib.com
Available 24*7 on WhatsApp / Email
![[object Object]](/_next/static/media/star-bottom.7253800d.svg)
Unlock your academic potential
Copyright © 2020–2026 A2Z Services. All Rights Reserved. Developed and managed by ZUCOL.