Financial Analysis Report: Greencross Holdings Limited (5 Years)
VerifiedAdded on 2023/01/23
|10
|1106
|95
Report
AI Summary
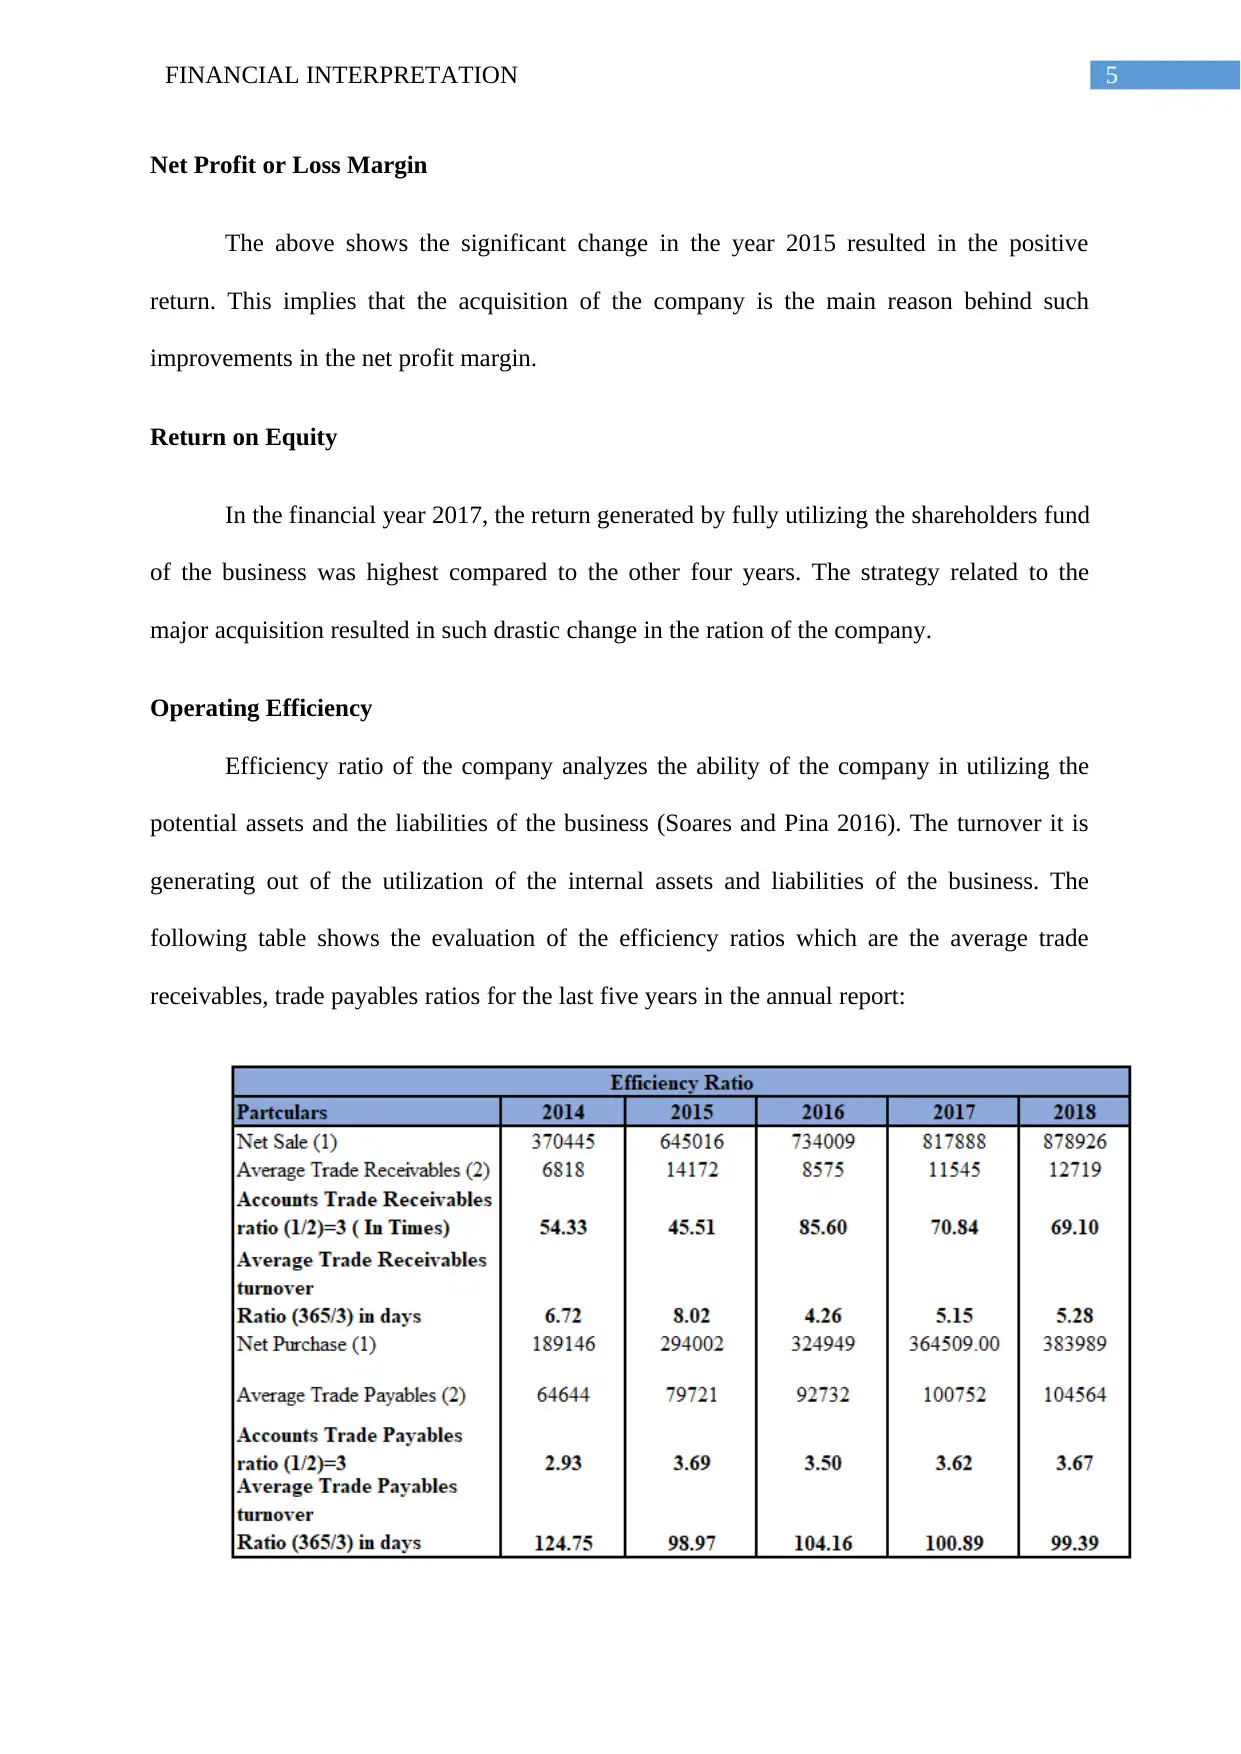
This report presents a financial analysis of Greencross Holdings Limited, evaluating its performance over five years using key financial ratios. The analysis covers profitability ratios (Return on Asset, Return on Equity, Net Profit Margin), operating efficiency ratios (Average Turnover Receivables, Average Turnover Payables), liquidity and solvency ratios (Current Ratio, Quick Ratio), and market performance ratios (Price Earnings Ratio). The report highlights the impact of the 2014 acquisition of Mammoth Pet on the company's financial position, showing improvements in profitability after the acquisition. The analysis also discusses the company's strengths and weaknesses, concluding with recommendations for enhancing financial performance and strategic decision-making.

Running head: FINANCIAL INTERPRETATION
Financial Interpretation
Name of the student:
Name of the university:
Author Note:
Financial Interpretation
Name of the student:
Name of the university:
Author Note:
Paraphrase This Document
Need a fresh take? Get an instant paraphrase of this document with our AI Paraphraser

1FINANCIAL INTERPRETATION
Executive Summary
The assignment focuses on the evaluation of the major or the key ratios of Greencross
Holdings Limited. Further detailed interpretation and impact on the acquisition of the
company has been depicted in the conducted analysis.
Executive Summary
The assignment focuses on the evaluation of the major or the key ratios of Greencross
Holdings Limited. Further detailed interpretation and impact on the acquisition of the
company has been depicted in the conducted analysis.

2FINANCIAL INTERPRETATION
Table of Contents
Introduction:...............................................................................................................................3
Discussion:.................................................................................................................................4
Profitability Ratio...................................................................................................................4
Operating Efficiency..............................................................................................................5
Liquidity and Solvency..........................................................................................................6
Market Performance Ratio.....................................................................................................7
Conclusion..................................................................................................................................8
⊘ This is a preview!⊘
Do you want full access?
Subscribe today to unlock all pages.

Trusted by 1+ million students worldwide

3FINANCIAL INTERPRETATION
Introduction:
The aim of the assignment deals with the financial analysis of Greencross Holdings
Limited for the last five financial year where information’s have derived from the annual
report of the company. The main focus of the report is based on the detailed evaluation and
the interpretation of the ratios.
Paraphrase This Document
Need a fresh take? Get an instant paraphrase of this document with our AI Paraphraser

4FINANCIAL INTERPRETATION
Discussion:
The financial analysis of Greencross limited for the last year where the data have been
collected from the annual report. Greencross limited is one of the largest pet company in
Australia which is further traded on the Australian Securities Exchange. In the financial year
2014, one of the largest acquisition took place by acquiring the assets of Mammoth Pet.
Profitability Ratio
The profitability ratio use to determine the ability of the business to generate revenue
by considering the operating costs associated with the business (Barr and McClellan 2018).
The following table shows the evaluation of the profitability ratios which are the return on
asset, return on equity and net profit or loss margin for the last five years in the annual report:
Return on Asset Ratio
From the above computed ratio it can be evaluated that in the year 2014 there was a
negative return generated from the assets utilized by the company as there was a net loss in
the financial statement. But after 2014, the company has drastically recovered its financial
position and achieved the highest ratio in the year 2017.

5FINANCIAL INTERPRETATION
Net Profit or Loss Margin
The above shows the significant change in the year 2015 resulted in the positive
return. This implies that the acquisition of the company is the main reason behind such
improvements in the net profit margin.
Return on Equity
In the financial year 2017, the return generated by fully utilizing the shareholders fund
of the business was highest compared to the other four years. The strategy related to the
major acquisition resulted in such drastic change in the ration of the company.
Operating Efficiency
Efficiency ratio of the company analyzes the ability of the company in utilizing the
potential assets and the liabilities of the business (Soares and Pina 2016). The turnover it is
generating out of the utilization of the internal assets and liabilities of the business. The
following table shows the evaluation of the efficiency ratios which are the average trade
receivables, trade payables ratios for the last five years in the annual report:
⊘ This is a preview!⊘
Do you want full access?
Subscribe today to unlock all pages.

Trusted by 1+ million students worldwide

6FINANCIAL INTERPRETATION
Average Turnover Receivables
The ratio measures the number of times the company can turn the receivables into
cash during a particular period of time. In the average turnover receivables, the company
needs to improve the receivables as per the current position (Finkler, Smith and Calabrese
2018).
Average Turnover Payables
The ratio evaluates the payment period of the company is longer which means that the
company takes longer period to pay off its liabilities. As the cash generated from the business
is low which results in such case the company taking longer period to pay off the liabilities.
Liquidity and Solvency
The ratio measures the ability of the company to meet the short and the long term
obligations of the business (Hoyle, Schaefer and Doupnik 2015). The following table shows
the evaluation of current and quick ratios for the last five years in the annual report:
Current Ratio
The current ratio of the company is good as it exceeds the standard which is 2:1 and
especially in the year 2014 (Smith 2017).
Paraphrase This Document
Need a fresh take? Get an instant paraphrase of this document with our AI Paraphraser

7FINANCIAL INTERPRETATION
Quick Ratio
The quick ratio of the company in the year 2014 was satisfactory and after that it is
declining gradually and in that case the company needs to take certain measures in that case.
Market Performance Ratio
The market performance ratio analyses the performance of the shares in the market
and the valuation of the shares at the current market price is evaluated. The following ratio is
calculated accordingly:
Price Earnings Ratio
From the above evaluation of the price earnings ratio of the company it can be
evaluated that as the earning per share is negative that’s why in the year 2014 the ratio was
negative. But after the acquisition in the year 2015 the share price was higher (Regehr and
Sengupta 2016).

8FINANCIAL INTERPRETATION
Conclusion
From the above discussion it can be concluded that from the financial analysis of
Greencross limited for the five financial year it can be interpreted that after the strategic
decision of acquiring Mammoth Pet in the year 2014 the financial performance of the
company has drastically improved. The overall financial position of the company is
satisfactory and the management of the company needs to adopt policy in order to enhance
the financial performance of the business.
⊘ This is a preview!⊘
Do you want full access?
Subscribe today to unlock all pages.

Trusted by 1+ million students worldwide

9FINANCIAL INTERPRETATION
References
Barr, M.J. and McClellan, G.S., 2018. Budgets and financial management in higher
education. John Wiley & Sons.
Finkler, S.A., Smith, D.L. and Calabrese, T.D., 2018. Financial management for public,
health, and not-for-profit organizations. CQ Press.
Hoyle, J.B., Schaefer, T. and Doupnik, T., 2015. Advanced accounting. McGraw Hill.
Regehr, K. and Sengupta, R., 2016. Has the relationship between bank size and profitability
changed?. Economic Review (01612387), 101(2).
Smith, M., 2017. Research methods in accounting. Sage.
Soares, J.O. and Pina, J.P., 2016. Macro-Regions, Country Effect and Financial Ratios: A
Comparative Study in the Euro Area. In Proceedings, 1st AMSR Congress and 23rd APDR
Congress, Sustainability of Territories in the Context of Global Change.
1 out of 10
Related Documents
Your All-in-One AI-Powered Toolkit for Academic Success.
+13062052269
info@desklib.com
Available 24*7 on WhatsApp / Email
Unlock your academic potential
Copyright © 2020–2025 A2Z Services. All Rights Reserved. Developed and managed by ZUCOL.


