Portfolio: Financial Ratio Analysis and Capital Investment Appraisal
VerifiedAdded on 2020/07/22
|26
|3977
|77
Portfolio
AI Summary
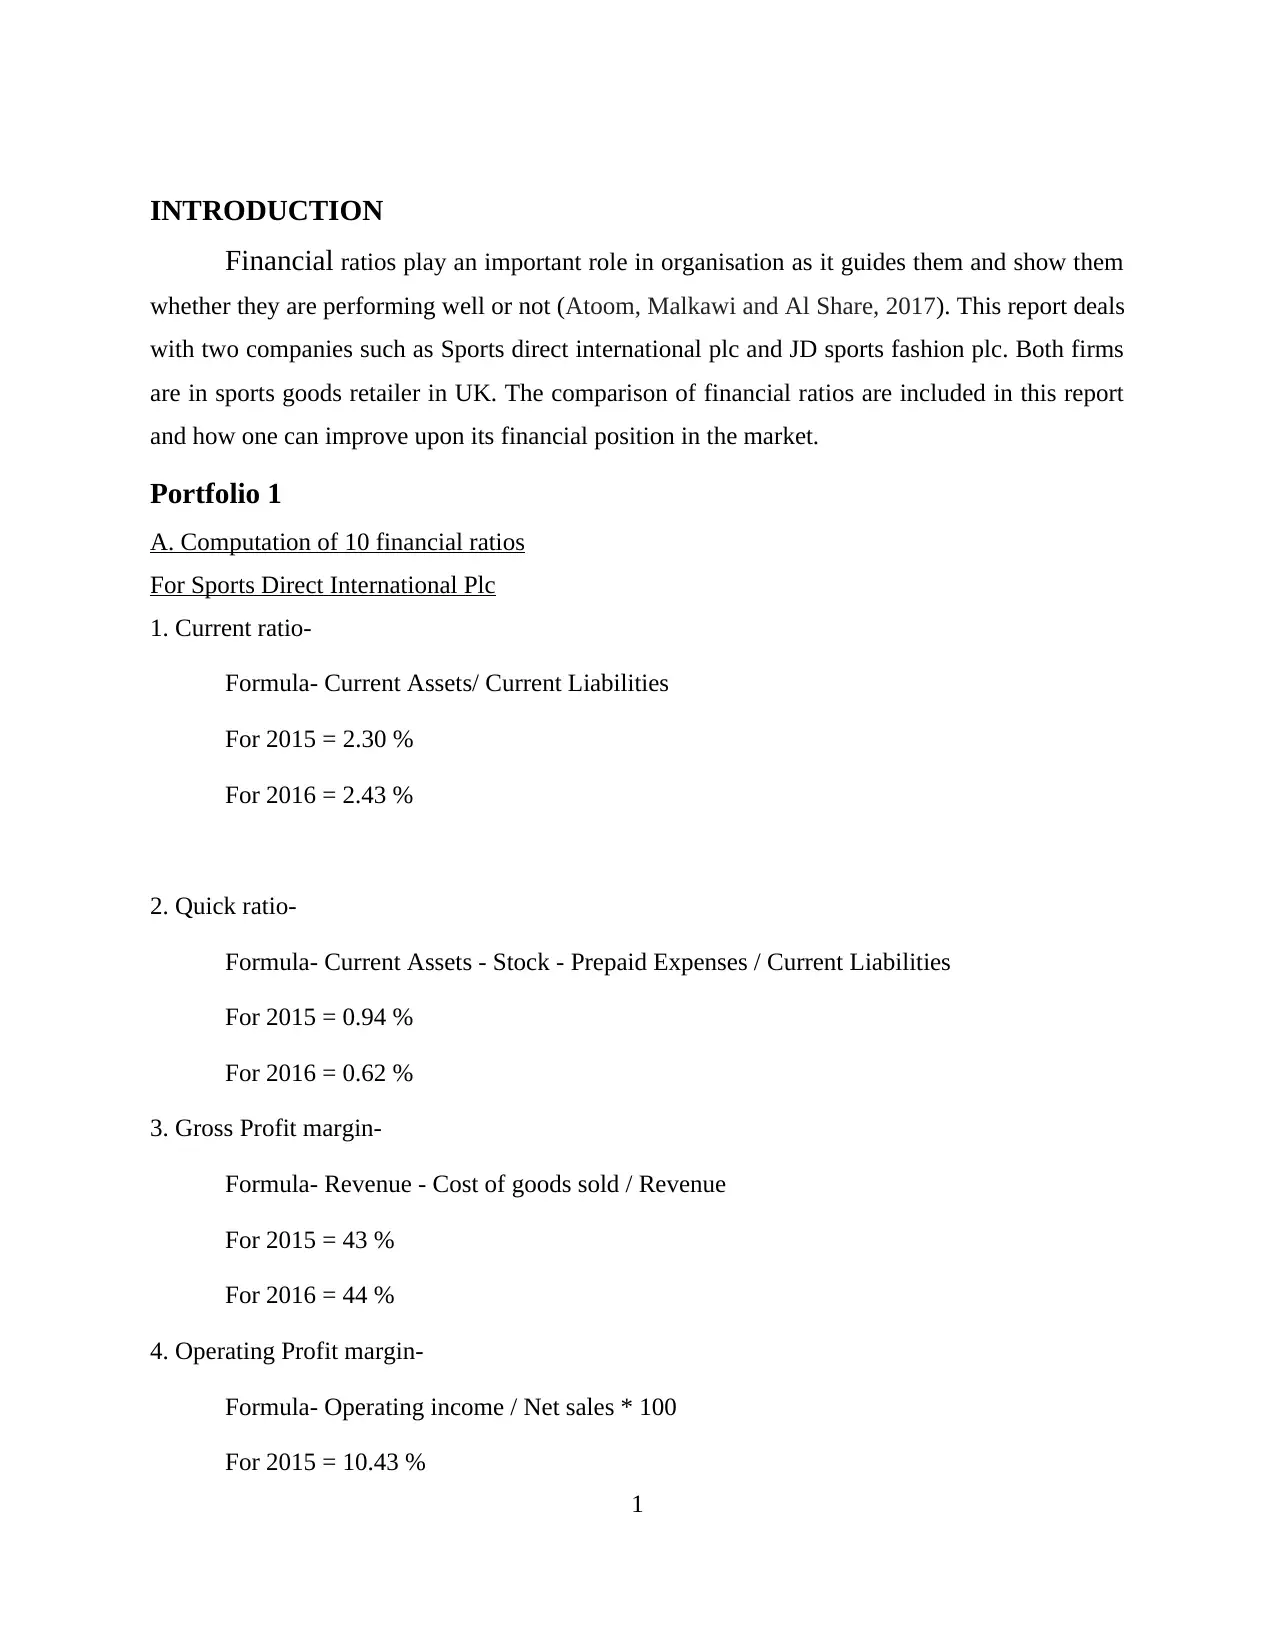
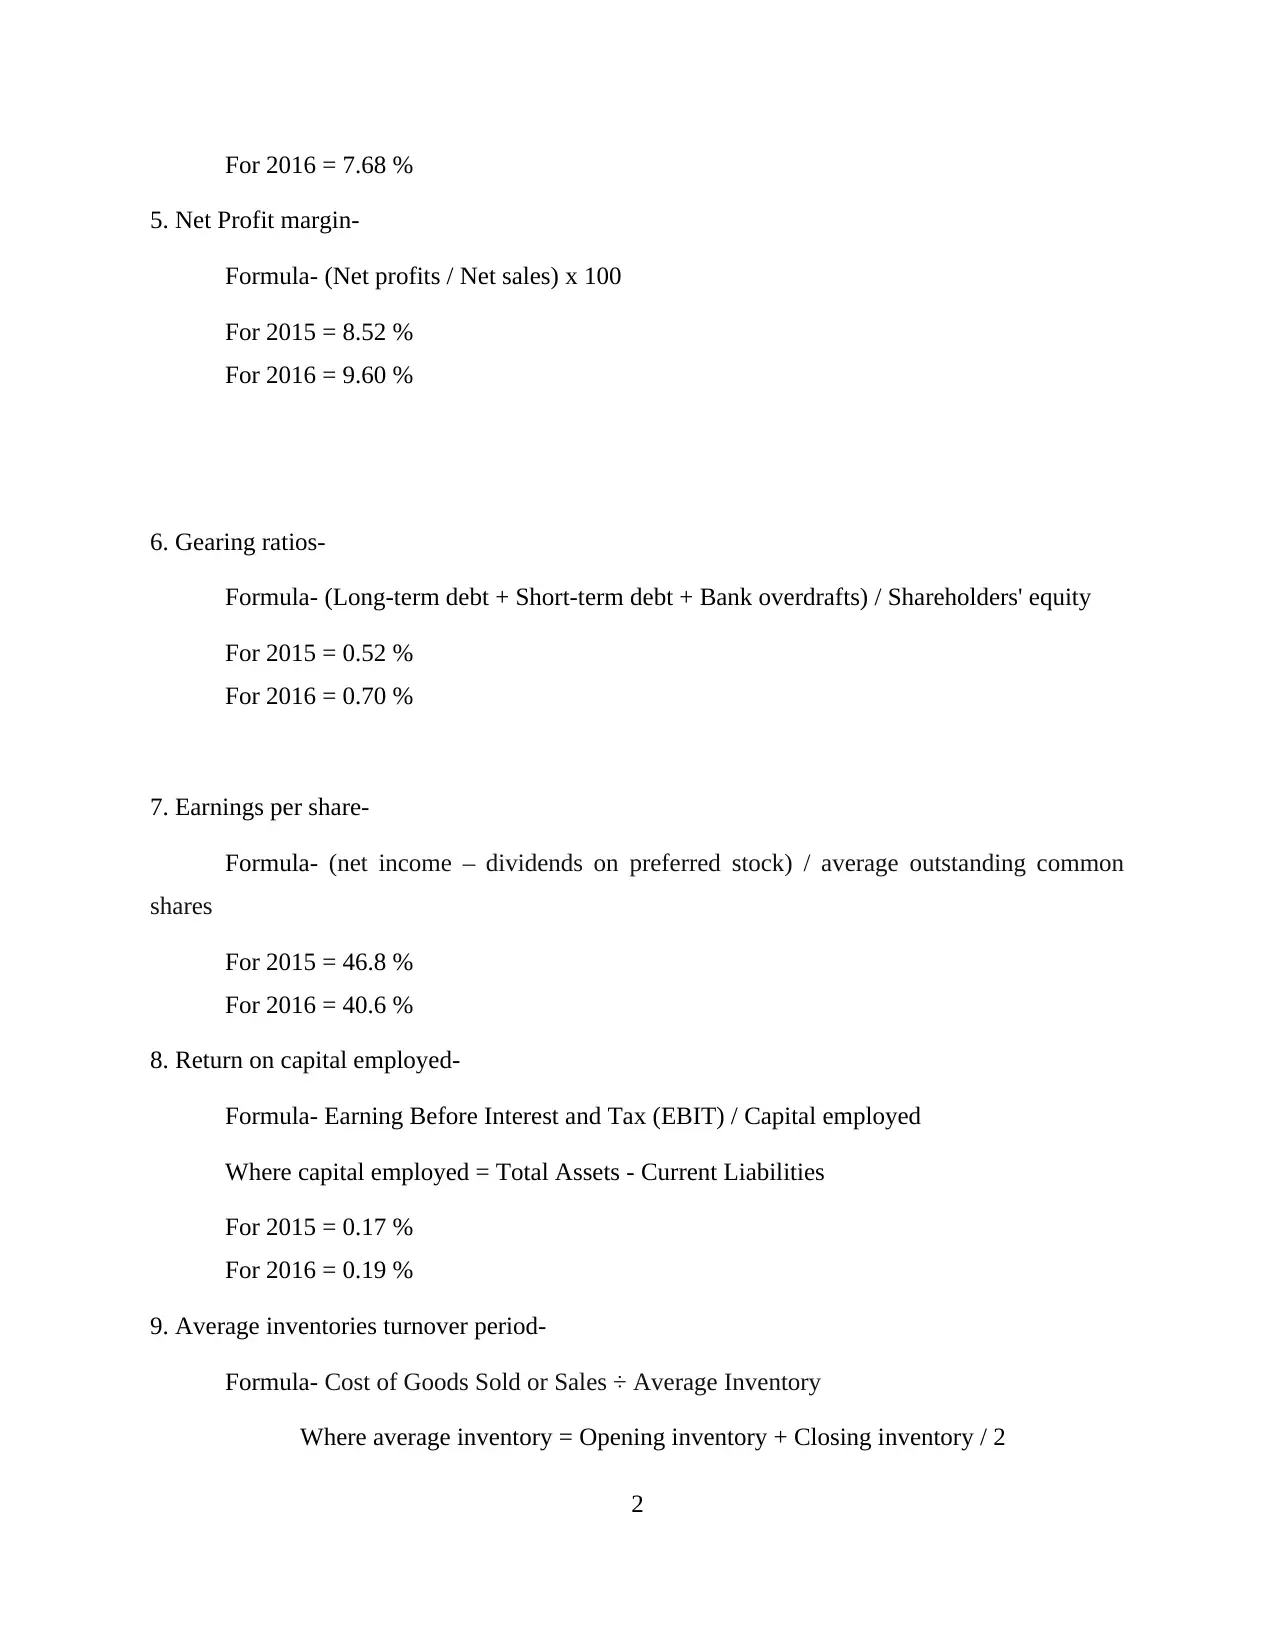
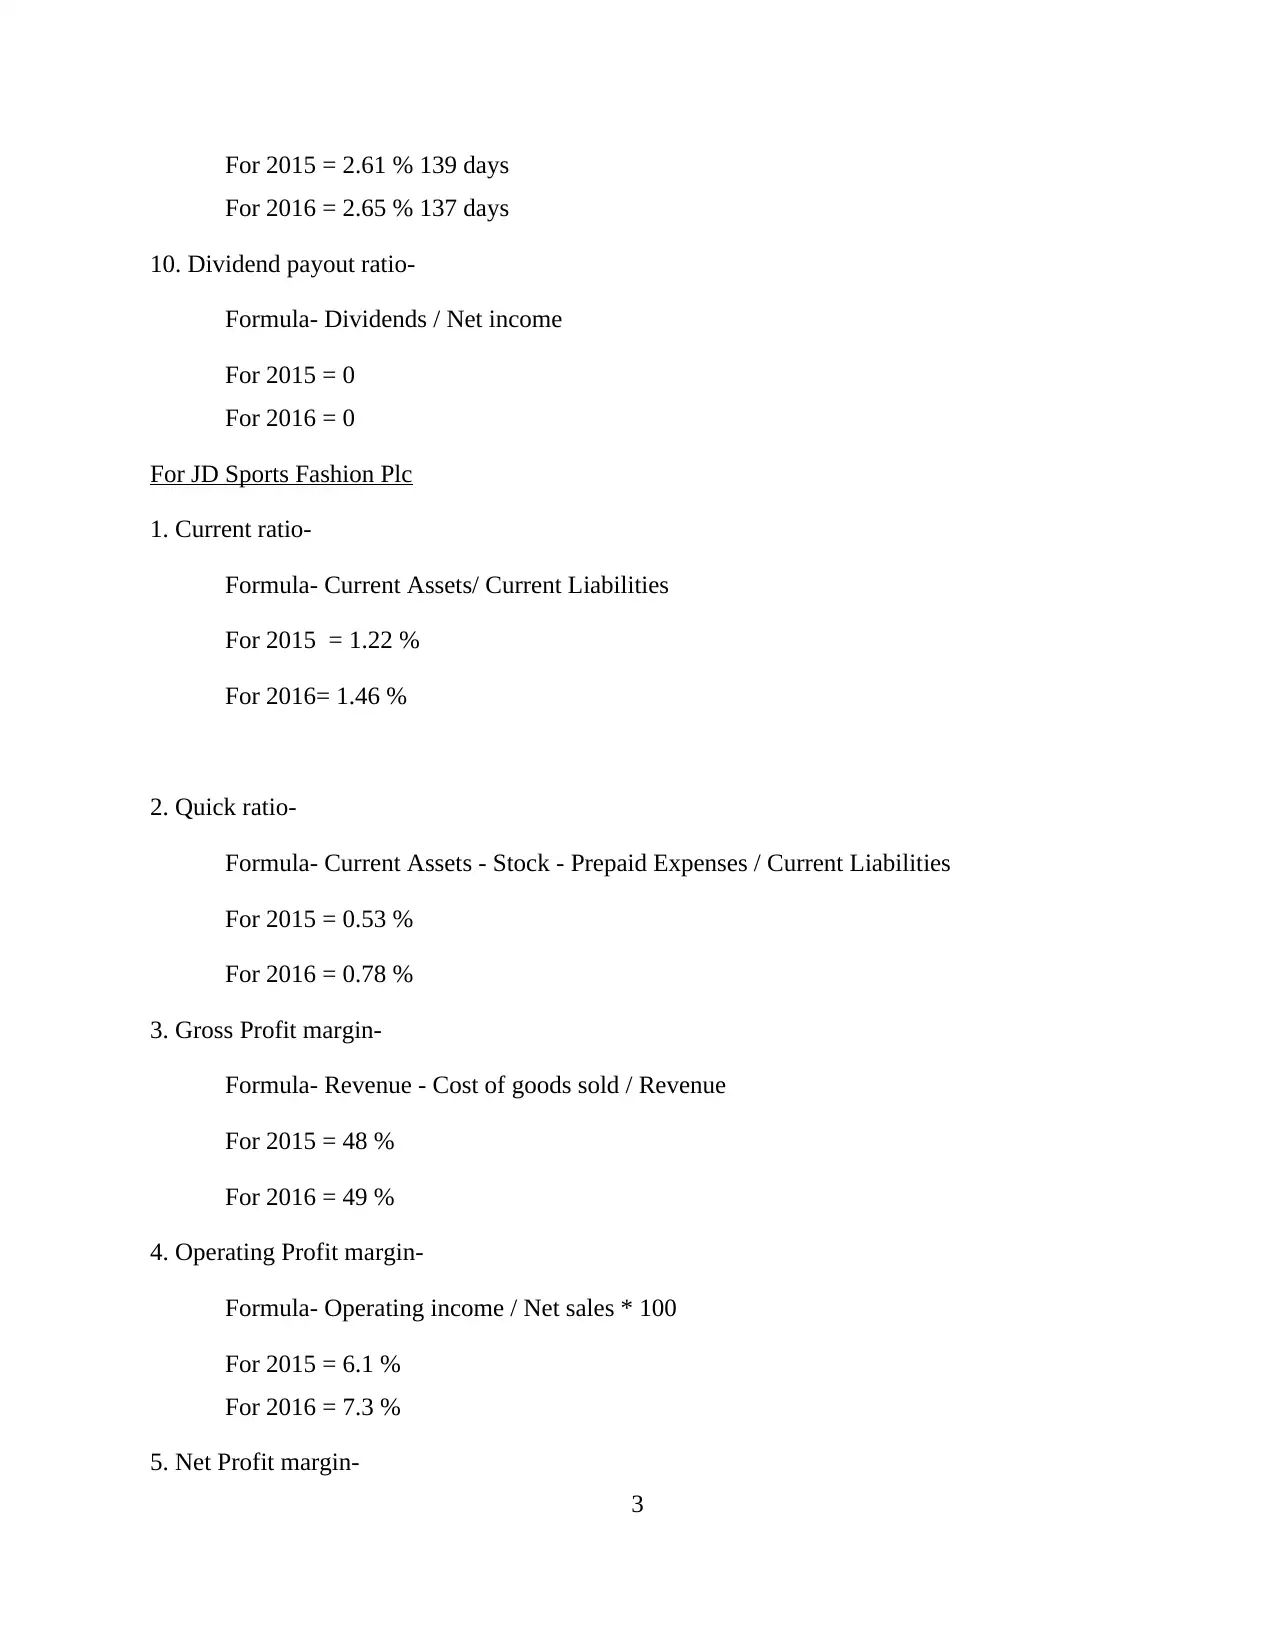
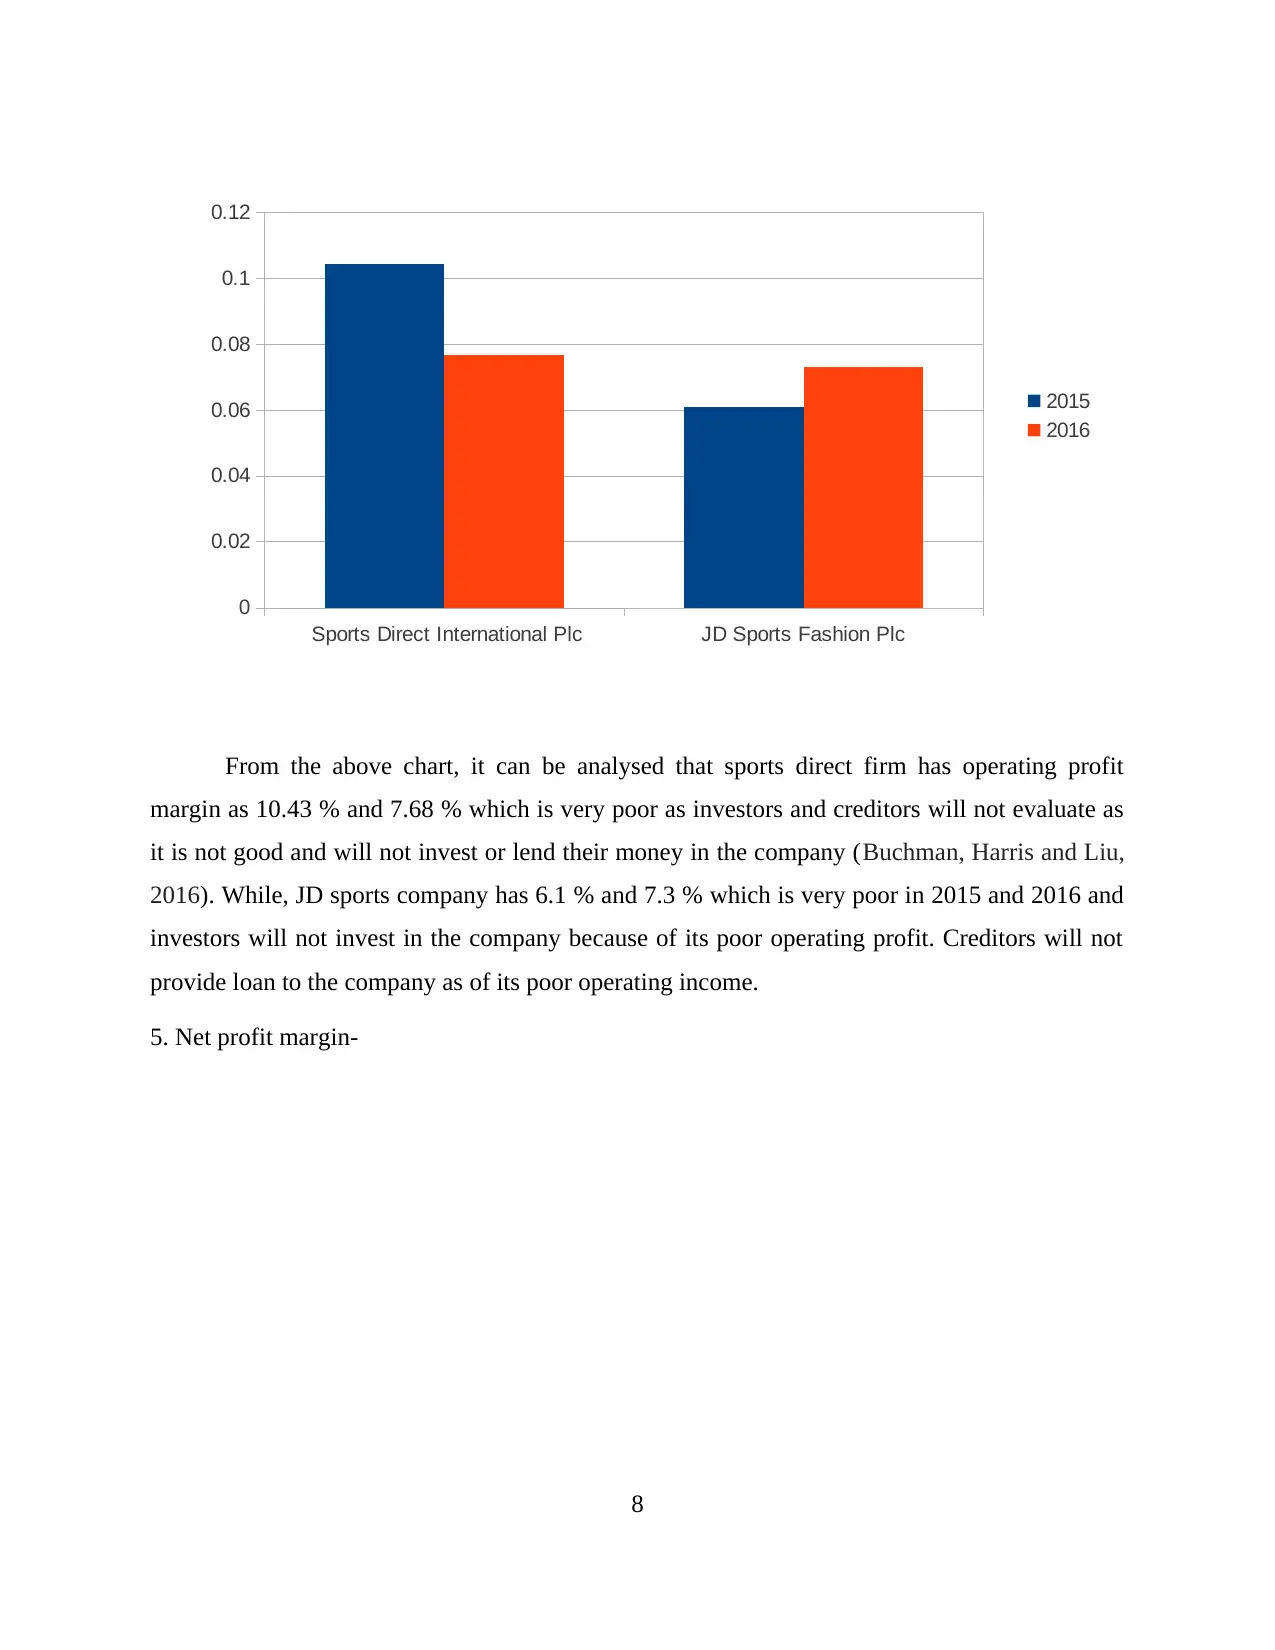
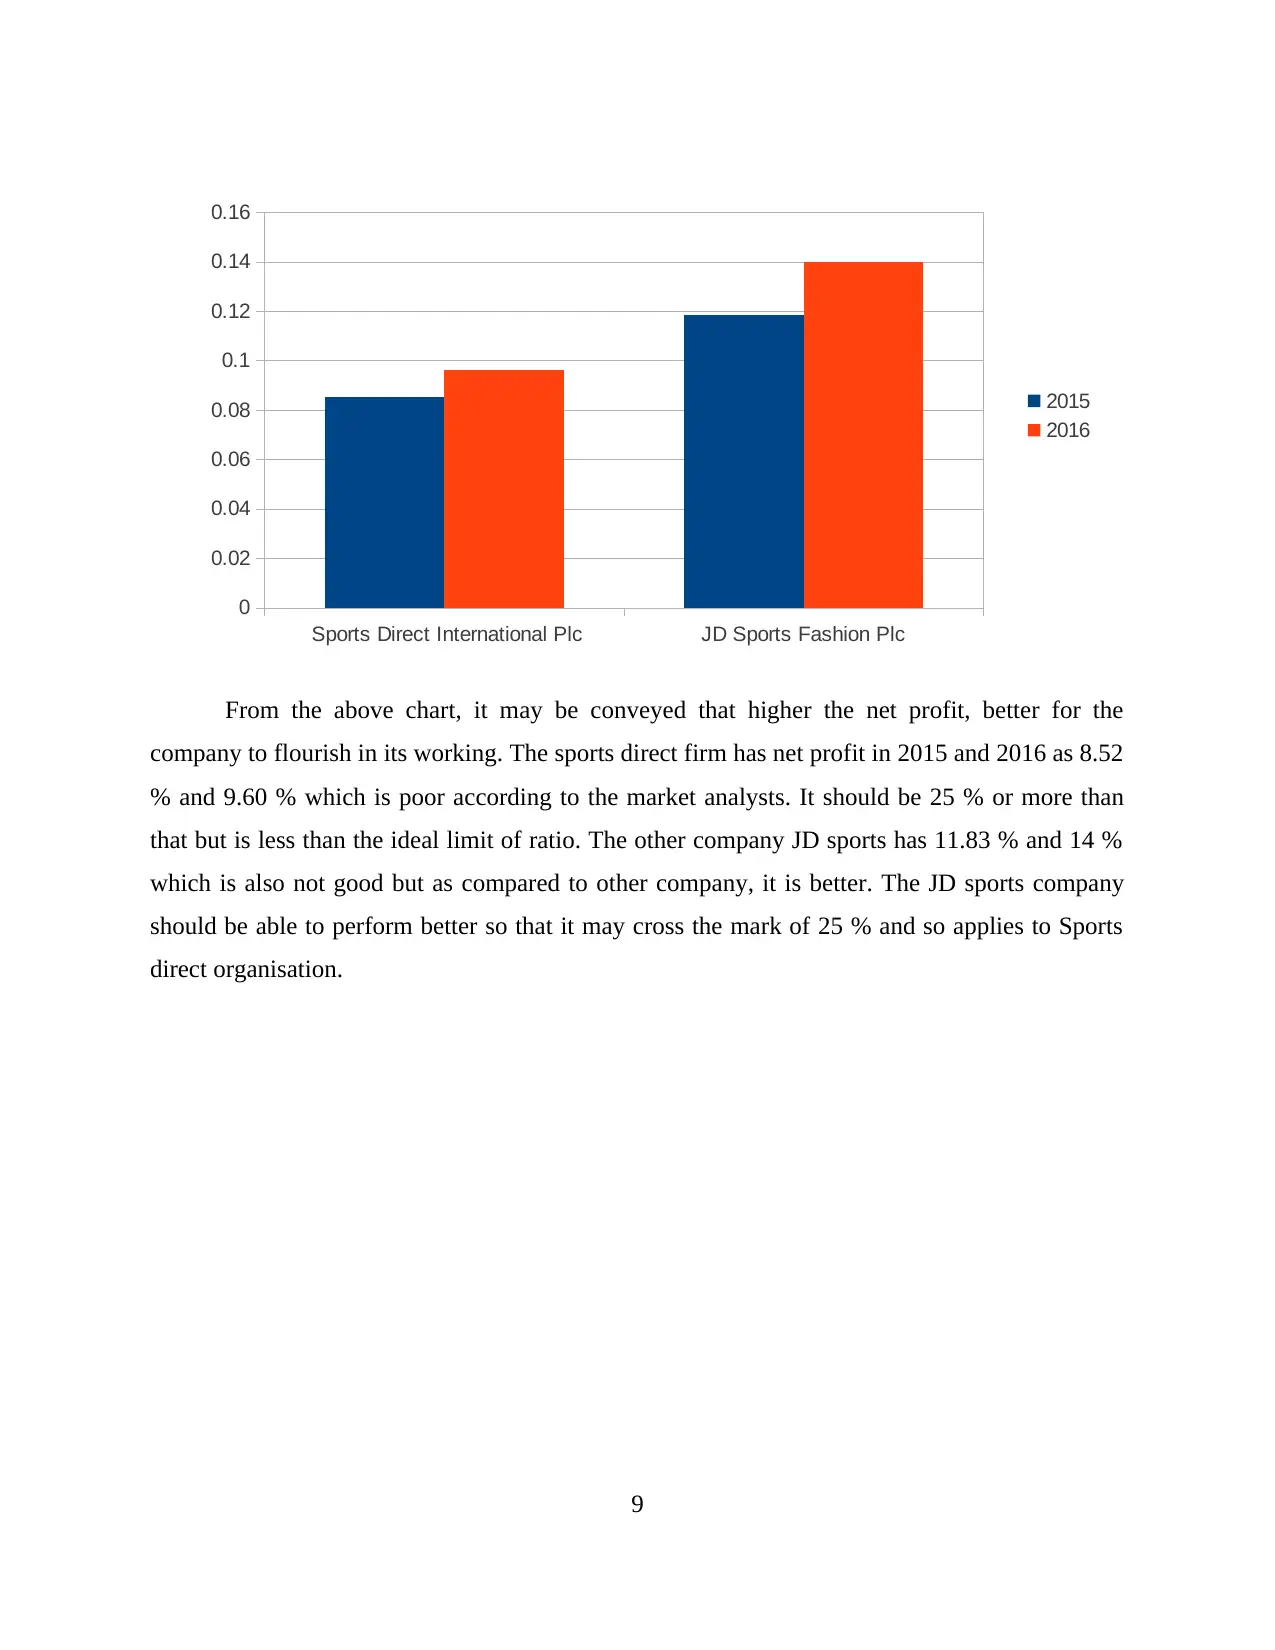
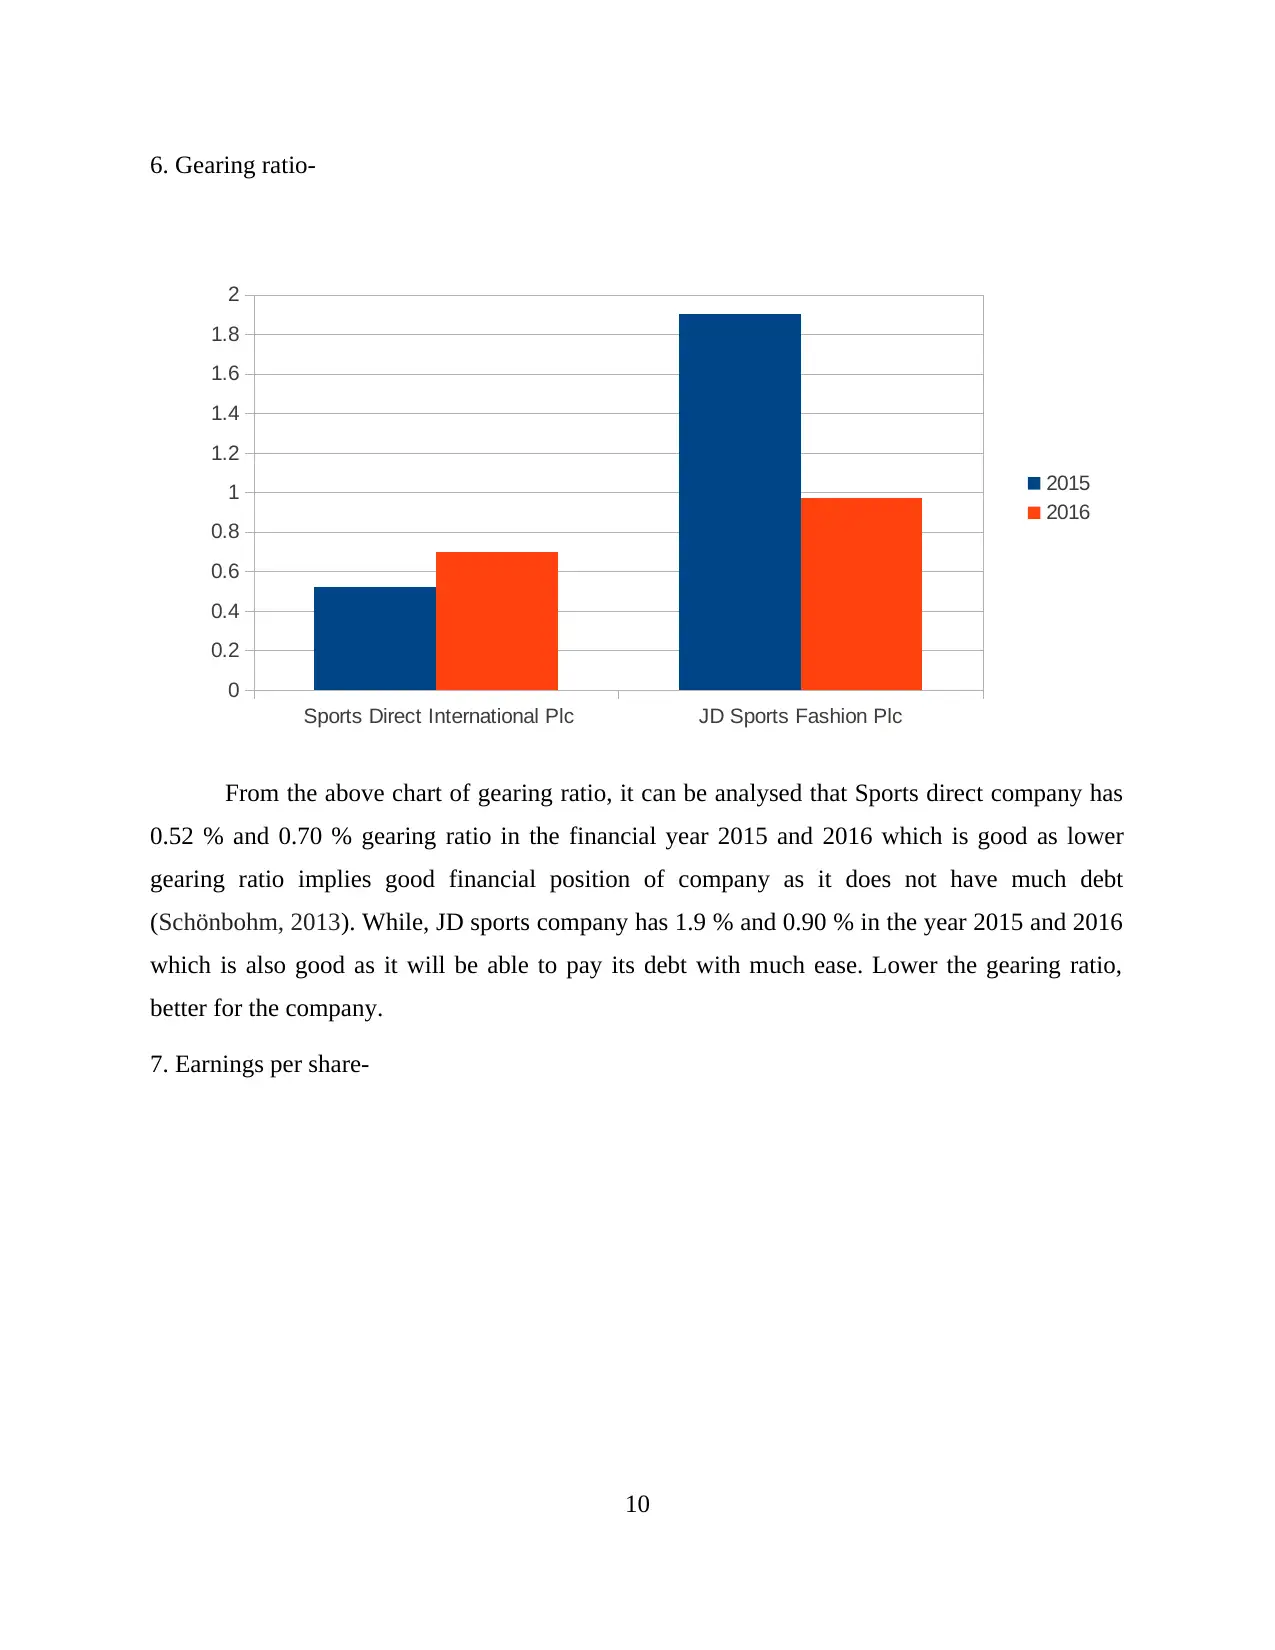
This portfolio provides a comprehensive financial analysis of Sports Direct International plc and JD Sports Fashion plc, two prominent UK sports goods retailers. The analysis begins with the computation of ten key financial ratios for both companies over two years, including current ratio, quick ratio, gross profit margin, operating profit margin, net profit margin, gearing ratio, earnings per share, return on capital employed, average inventory turnover period, and dividend payout ratio. The portfolio then offers a detailed interpretation of these ratios, highlighting the strengths and weaknesses of each company's financial performance. Recommendations are provided to improve the financial performance of both companies, focusing on areas such as current ratio, quick ratio, gross profit margin, operating profit margin, net profit margin, gearing ratios, earnings per share, return on capital employed, stock turnover ratio and dividend payout ratio. The portfolio also acknowledges the limitations of using financial ratios. Additionally, the portfolio includes a section on capital investment appraisal, covering NPV, ARR, and payback period computations, as well as the limitations of investment appraisal techniques.

Portfolio
Paraphrase This Document
Need a fresh take? Get an instant paraphrase of this document with our AI Paraphraser

TABLE OF CONTENTS
INTRODUCTION...........................................................................................................................1
Portfolio 1........................................................................................................................................1
A. Computation of 10 financial ratios....................................................................................1
B. Interpretation of ratios of both the companies...................................................................5
C. Recommendations to increase financial performance of companies...............................14
D. Limitations of financial ratios..........................................................................................15
Portfolio 2: Capital Investment Appraisal ....................................................................................16
A. NPV, ARR, Payback period computations......................................................................16
B. Limitations of the investment appraisal:..........................................................................20
CONCLUSION..............................................................................................................................21
REFERENCES..............................................................................................................................22
CONCLUSION..............................................................................................................................24

INTRODUCTION
Financial ratios play an important role in organisation as it guides them and show them
whether they are performing well or not (Atoom, Malkawi and Al Share, 2017). This report deals
with two companies such as Sports direct international plc and JD sports fashion plc. Both firms
are in sports goods retailer in UK. The comparison of financial ratios are included in this report
and how one can improve upon its financial position in the market.
Portfolio 1
A. Computation of 10 financial ratios
For Sports Direct International Plc
1. Current ratio-
Formula- Current Assets/ Current Liabilities
For 2015 = 2.30 %
For 2016 = 2.43 %
2. Quick ratio-
Formula- Current Assets - Stock - Prepaid Expenses / Current Liabilities
For 2015 = 0.94 %
For 2016 = 0.62 %
3. Gross Profit margin-
Formula- Revenue - Cost of goods sold / Revenue
For 2015 = 43 %
For 2016 = 44 %
4. Operating Profit margin-
Formula- Operating income / Net sales * 100
For 2015 = 10.43 %
1
⊘ This is a preview!⊘
Do you want full access?
Subscribe today to unlock all pages.

Trusted by 1+ million students worldwide

For 2016 = 7.68 %
5. Net Profit margin-
Formula- (Net profits / Net sales) x 100
For 2015 = 8.52 %
For 2016 = 9.60 %
6. Gearing ratios-
Formula- (Long-term debt + Short-term debt + Bank overdrafts) / Shareholders' equity
For 2015 = 0.52 %
For 2016 = 0.70 %
7. Earnings per share-
Formula- (net income – dividends on preferred stock) / average outstanding common
shares
For 2015 = 46.8 %
For 2016 = 40.6 %
8. Return on capital employed-
Formula- Earning Before Interest and Tax (EBIT) / Capital employed
Where capital employed = Total Assets - Current Liabilities
For 2015 = 0.17 %
For 2016 = 0.19 %
9. Average inventories turnover period-
Formula- Cost of Goods Sold or Sales ÷ Average Inventory
Where average inventory = Opening inventory + Closing inventory / 2
2
Paraphrase This Document
Need a fresh take? Get an instant paraphrase of this document with our AI Paraphraser

For 2015 = 2.61 % 139 days
For 2016 = 2.65 % 137 days
10. Dividend payout ratio-
Formula- Dividends / Net income
For 2015 = 0
For 2016 = 0
For JD Sports Fashion Plc
1. Current ratio-
Formula- Current Assets/ Current Liabilities
For 2015 = 1.22 %
For 2016= 1.46 %
2. Quick ratio-
Formula- Current Assets - Stock - Prepaid Expenses / Current Liabilities
For 2015 = 0.53 %
For 2016 = 0.78 %
3. Gross Profit margin-
Formula- Revenue - Cost of goods sold / Revenue
For 2015 = 48 %
For 2016 = 49 %
4. Operating Profit margin-
Formula- Operating income / Net sales * 100
For 2015 = 6.1 %
For 2016 = 7.3 %
5. Net Profit margin-
3

Formula- (Net profits / Net sales) x 100
For 2015 = 11.83 %
For 2016 = 14 %
6. Gearing ratios-
Formula- (Long-term debt + Short-term debt + Bank overdrafts) / Shareholders' equity
For 2015 = 1.9 %
For 2016 = 0.97 %
7. Earnings per share-
Formula- (net income – dividends on preferred stock) / average outstanding common
shares
For 2015 = 35.17 %
For 2016 = 50.61 %
8. Return on capital employed-
Formula- Earning Before Interest and Tax (EBIT) / Capital employed
Where capital employed = Total Assets - Current Liabilities
For 2015 = 0.25 %
For 2016 = 0.29 %
9. Average inventories turnover period-
Formula- Cost of Goods Sold or Sales ÷ Average Inventory
Where average inventory = Opening inventory + Closing inventory / 2
For 2015 = 2.38 % 153 days
4
⊘ This is a preview!⊘
Do you want full access?
Subscribe today to unlock all pages.

Trusted by 1+ million students worldwide

For 2016 = 2.47 % 147 days
10. Dividend payout ratio-
Formula- Dividends / Net income
For 2015 = 27.6 %
For 2016 = 16.2 %
B. Interpretation of ratios of both the companies
1. Current ratio-
From the above current ratio, it can be interpreted that sports direct international plc has
2.30 and 2.43 ratio in 2015 and 2016 financial years which means that it will be able to pay off
its obligations on time. On the other hand, JD sports fashion plc has current ratio in 2015 and
2016 as 1.22 and 1.46 which shows it inability to pay its liabilities as such it should increase its
current ratio.
5
Sports Direct International Plc JD Sports Fashion Plc
0
0.005
0.01
0.015
0.02
0.025
0.03
2015
2016
Paraphrase This Document
Need a fresh take? Get an instant paraphrase of this document with our AI Paraphraser

2. Quick ratio-
From the above chart, it can be analysed that quick ratio of sports direct international plc
is 0.94 and 0.62 in the year 2015 and 2016 which means that it will be unable to pay meet its
current liabilities with much ease (Delen, Kuzey and Uyar, 2013). However, other company
which is JD sports fashion plc has 0.53 and 0.78 in the financial year 2015 and 2017 which is
also not good as it will not be able to meet its extreme short term obligations.
6
Sports Direct International Plc JD Sports Fashion Plc
0
0.001
0.002
0.003
0.004
0.005
0.006
0.007
0.008
0.009
0.01
2015
2016

3. Gross profit margin-
Hereby it may be interpreted that gross profit margin of sports direct organisation is
43.81 % and 44.23 % in the year 2015 and 2016 which has increase in 2016 year as it will be
able to generate more revenue. However, JD sports organisation has 48 % and 49 % in the year
2015 and 2016 which is remarkable as it will generate more revenue in the future.
4. Operating profit margin-
7
Sports Direct International Plc JD Sports Fashion Plc
0.41
0.42
0.43
0.44
0.45
0.46
0.47
0.48
0.49
0.5
2015
2016
⊘ This is a preview!⊘
Do you want full access?
Subscribe today to unlock all pages.

Trusted by 1+ million students worldwide

From the above chart, it can be analysed that sports direct firm has operating profit
margin as 10.43 % and 7.68 % which is very poor as investors and creditors will not evaluate as
it is not good and will not invest or lend their money in the company (Buchman, Harris and Liu,
2016). While, JD sports company has 6.1 % and 7.3 % which is very poor in 2015 and 2016 and
investors will not invest in the company because of its poor operating profit. Creditors will not
provide loan to the company as of its poor operating income.
5. Net profit margin-
8
Sports Direct International Plc JD Sports Fashion Plc
0
0.02
0.04
0.06
0.08
0.1
0.12
2015
2016
Paraphrase This Document
Need a fresh take? Get an instant paraphrase of this document with our AI Paraphraser

From the above chart, it may be conveyed that higher the net profit, better for the
company to flourish in its working. The sports direct firm has net profit in 2015 and 2016 as 8.52
% and 9.60 % which is poor according to the market analysts. It should be 25 % or more than
that but is less than the ideal limit of ratio. The other company JD sports has 11.83 % and 14 %
which is also not good but as compared to other company, it is better. The JD sports company
should be able to perform better so that it may cross the mark of 25 % and so applies to Sports
direct organisation.
9
Sports Direct International Plc JD Sports Fashion Plc
0
0.02
0.04
0.06
0.08
0.1
0.12
0.14
0.16
2015
2016

6. Gearing ratio-
From the above chart of gearing ratio, it can be analysed that Sports direct company has
0.52 % and 0.70 % gearing ratio in the financial year 2015 and 2016 which is good as lower
gearing ratio implies good financial position of company as it does not have much debt
(Schönbohm, 2013). While, JD sports company has 1.9 % and 0.90 % in the year 2015 and 2016
which is also good as it will be able to pay its debt with much ease. Lower the gearing ratio,
better for the company.
7. Earnings per share-
10
Sports Direct International Plc JD Sports Fashion Plc
0
0.2
0.4
0.6
0.8
1
1.2
1.4
1.6
1.8
2
2015
2016
⊘ This is a preview!⊘
Do you want full access?
Subscribe today to unlock all pages.

Trusted by 1+ million students worldwide
1 out of 26
Related Documents

Your All-in-One AI-Powered Toolkit for Academic Success.
+13062052269
info@desklib.com
Available 24*7 on WhatsApp / Email
Unlock your academic potential
Copyright © 2020–2025 A2Z Services. All Rights Reserved. Developed and managed by ZUCOL.