Financial Analysis Assessment: Elite plc Ratio Analysis Report

Verified

Added on  2022/12/14

|9
|1721
|319
Report
AI Summary
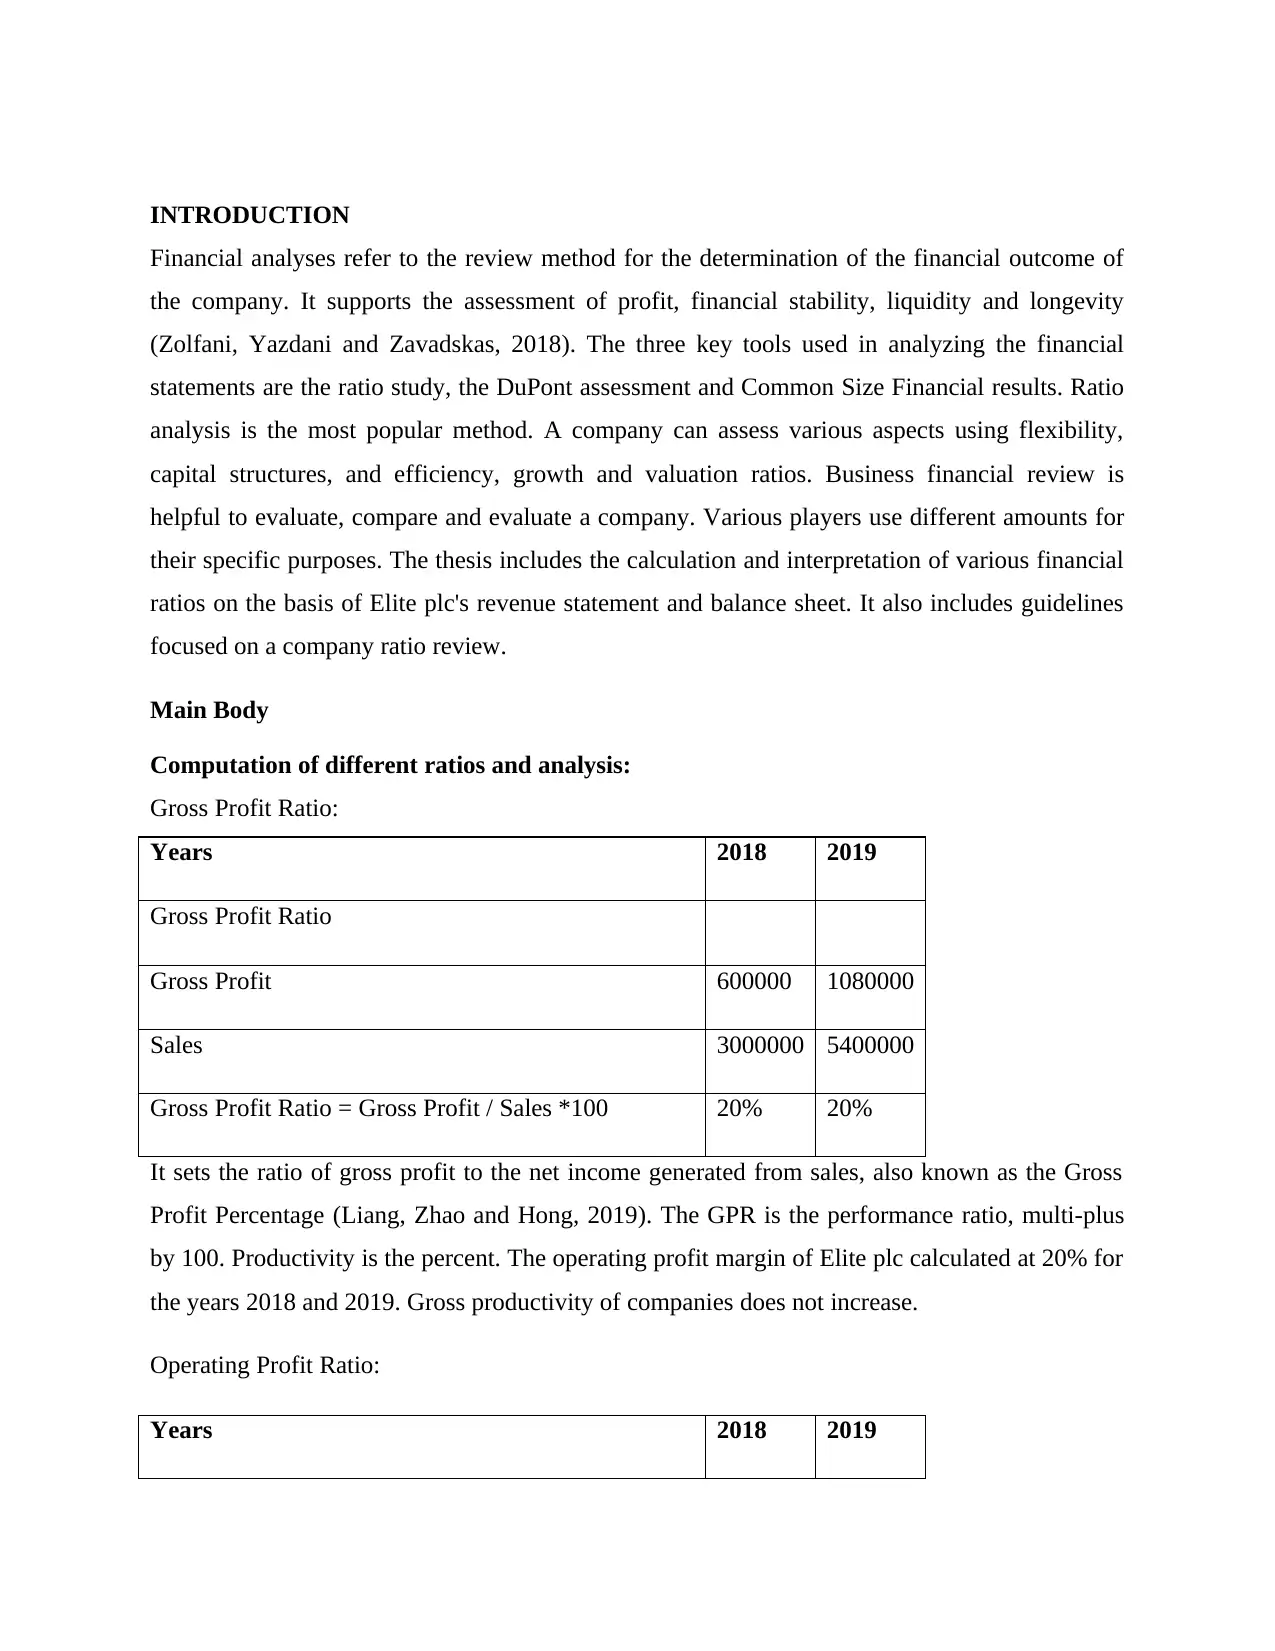
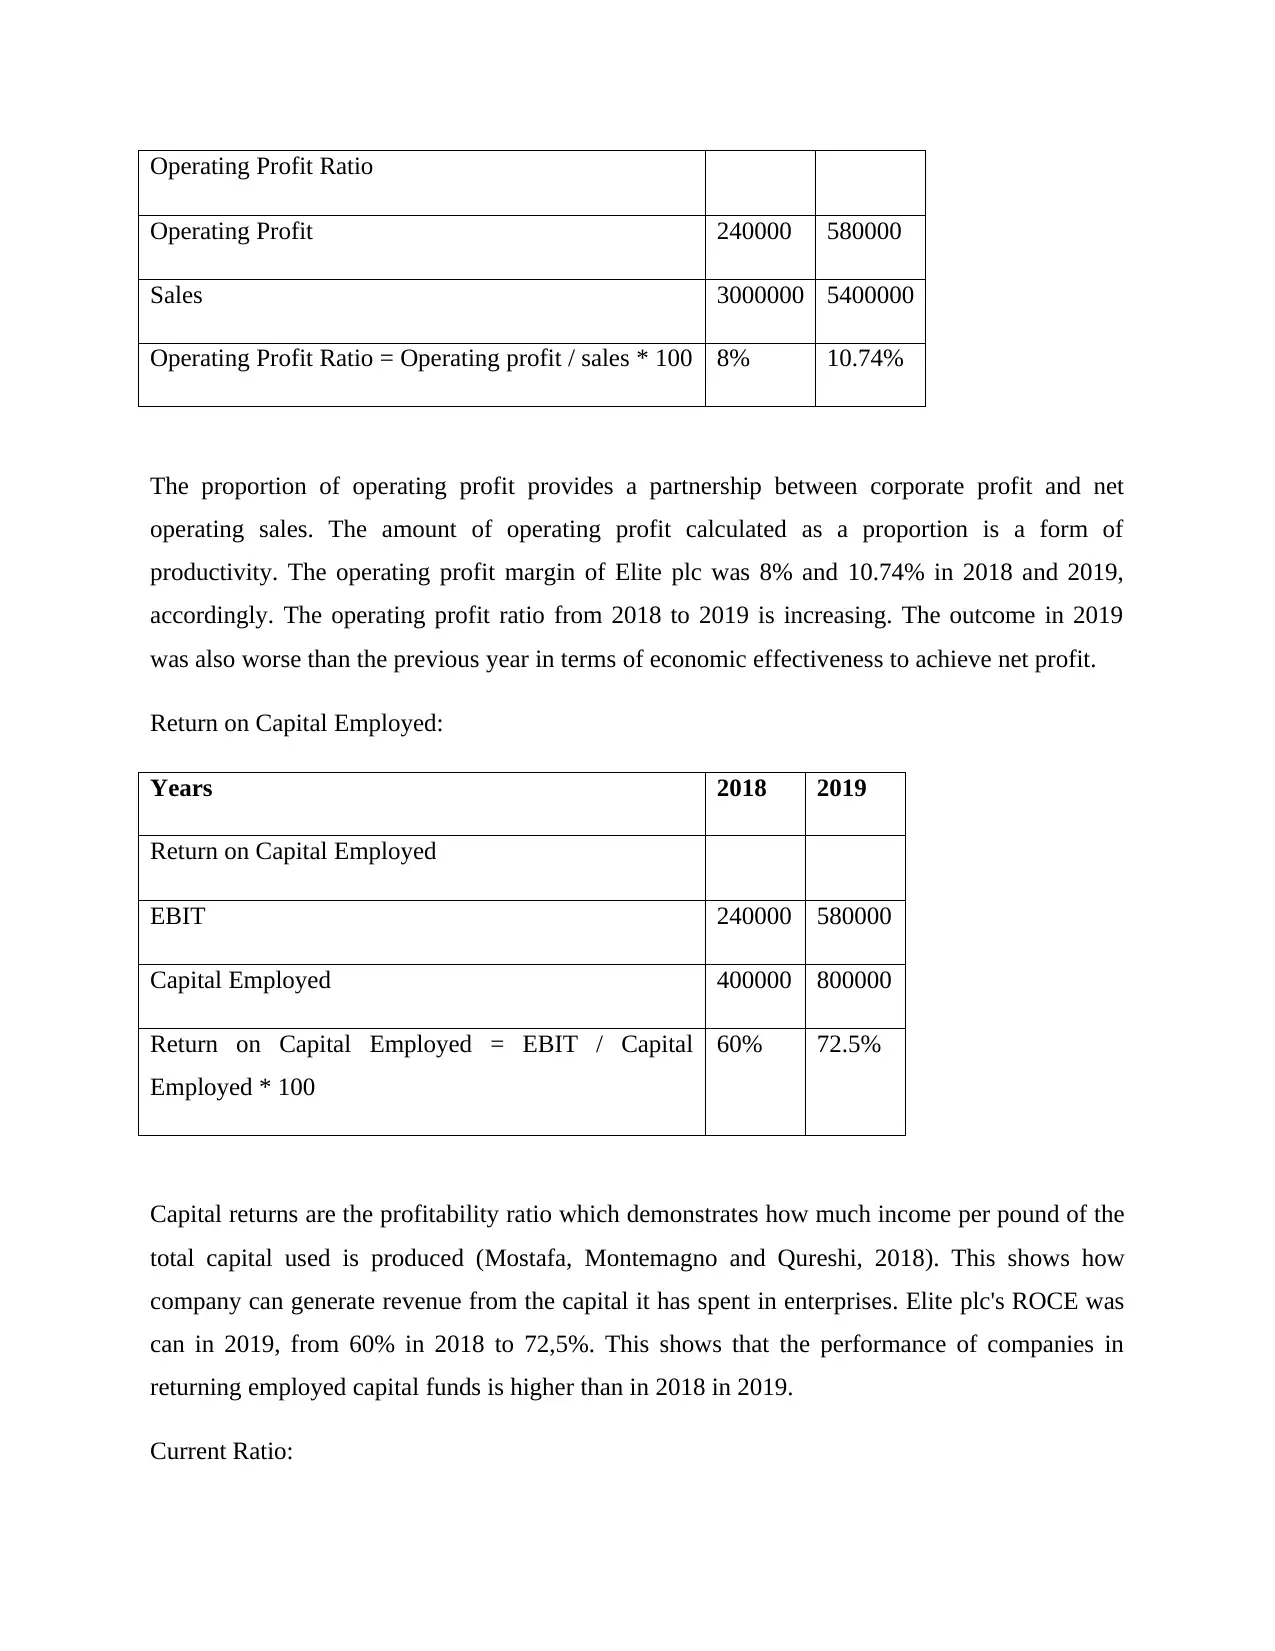
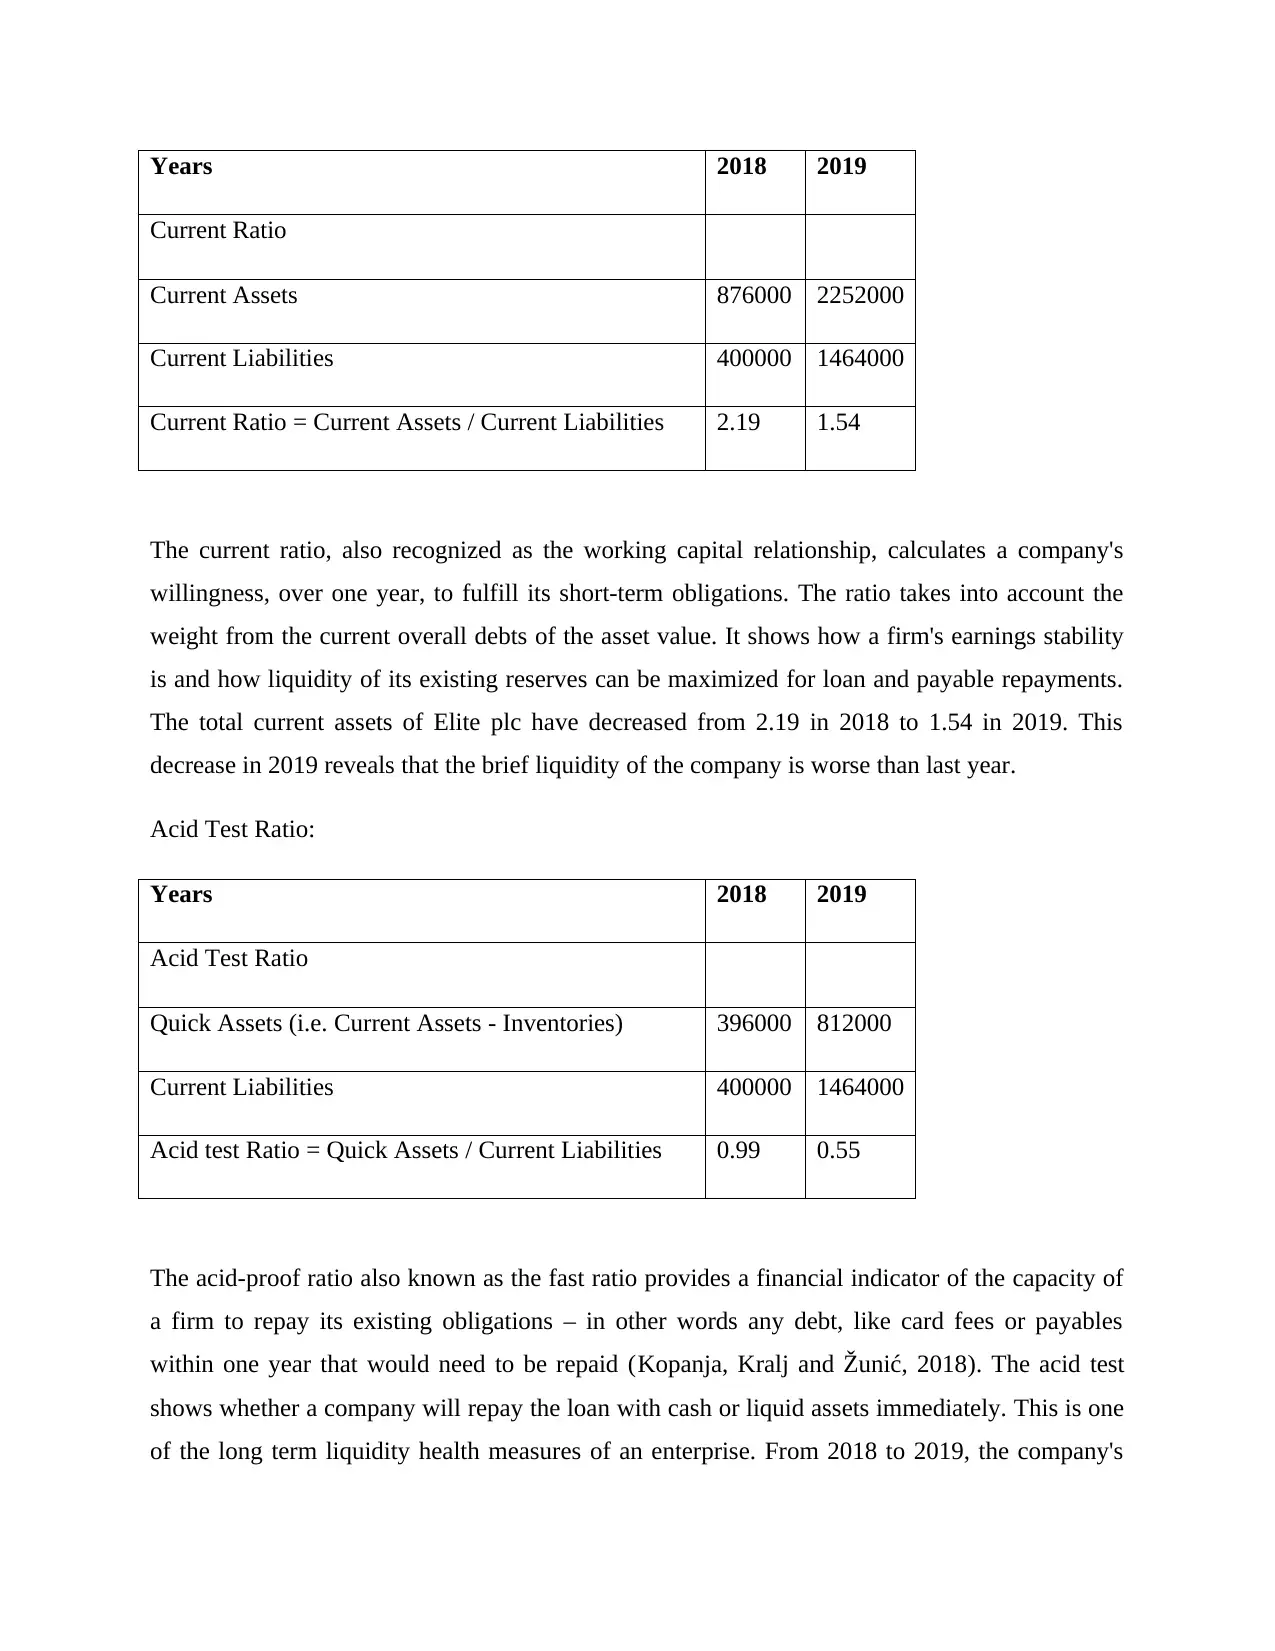
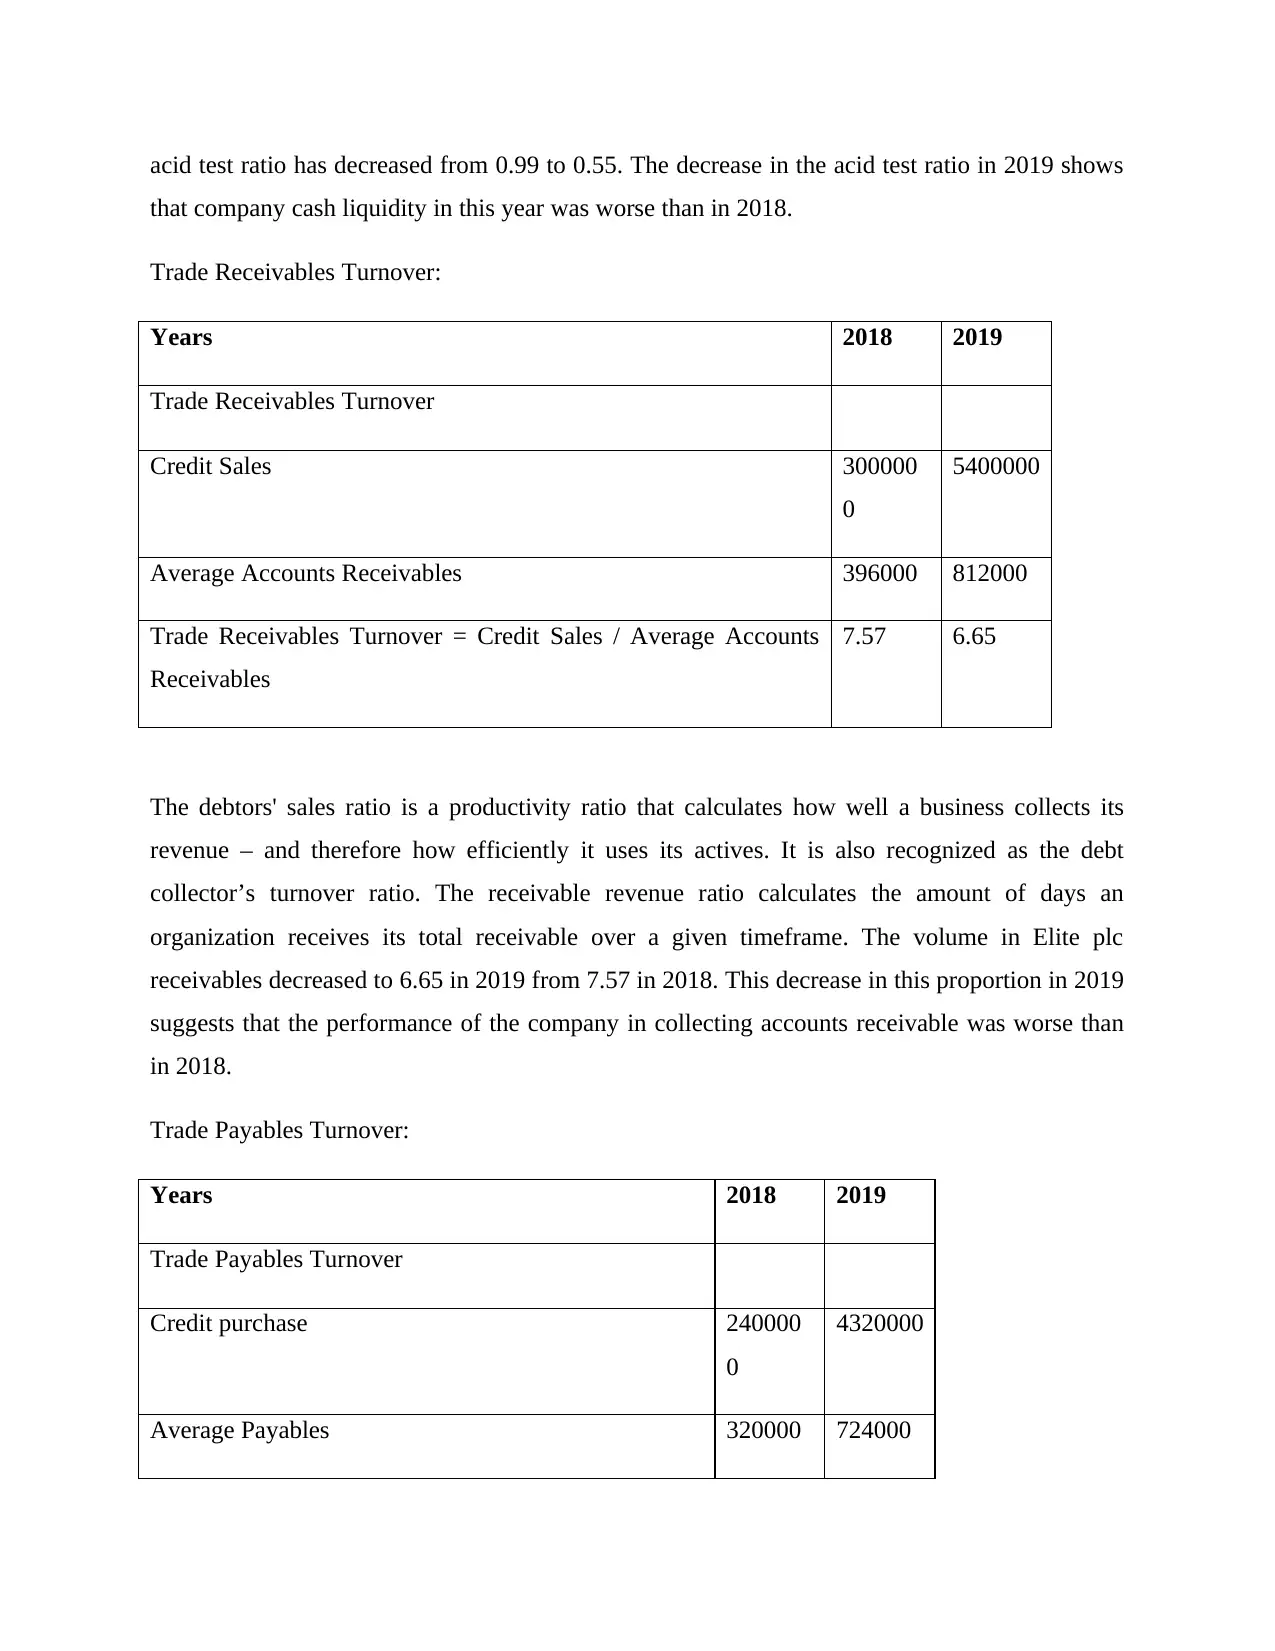
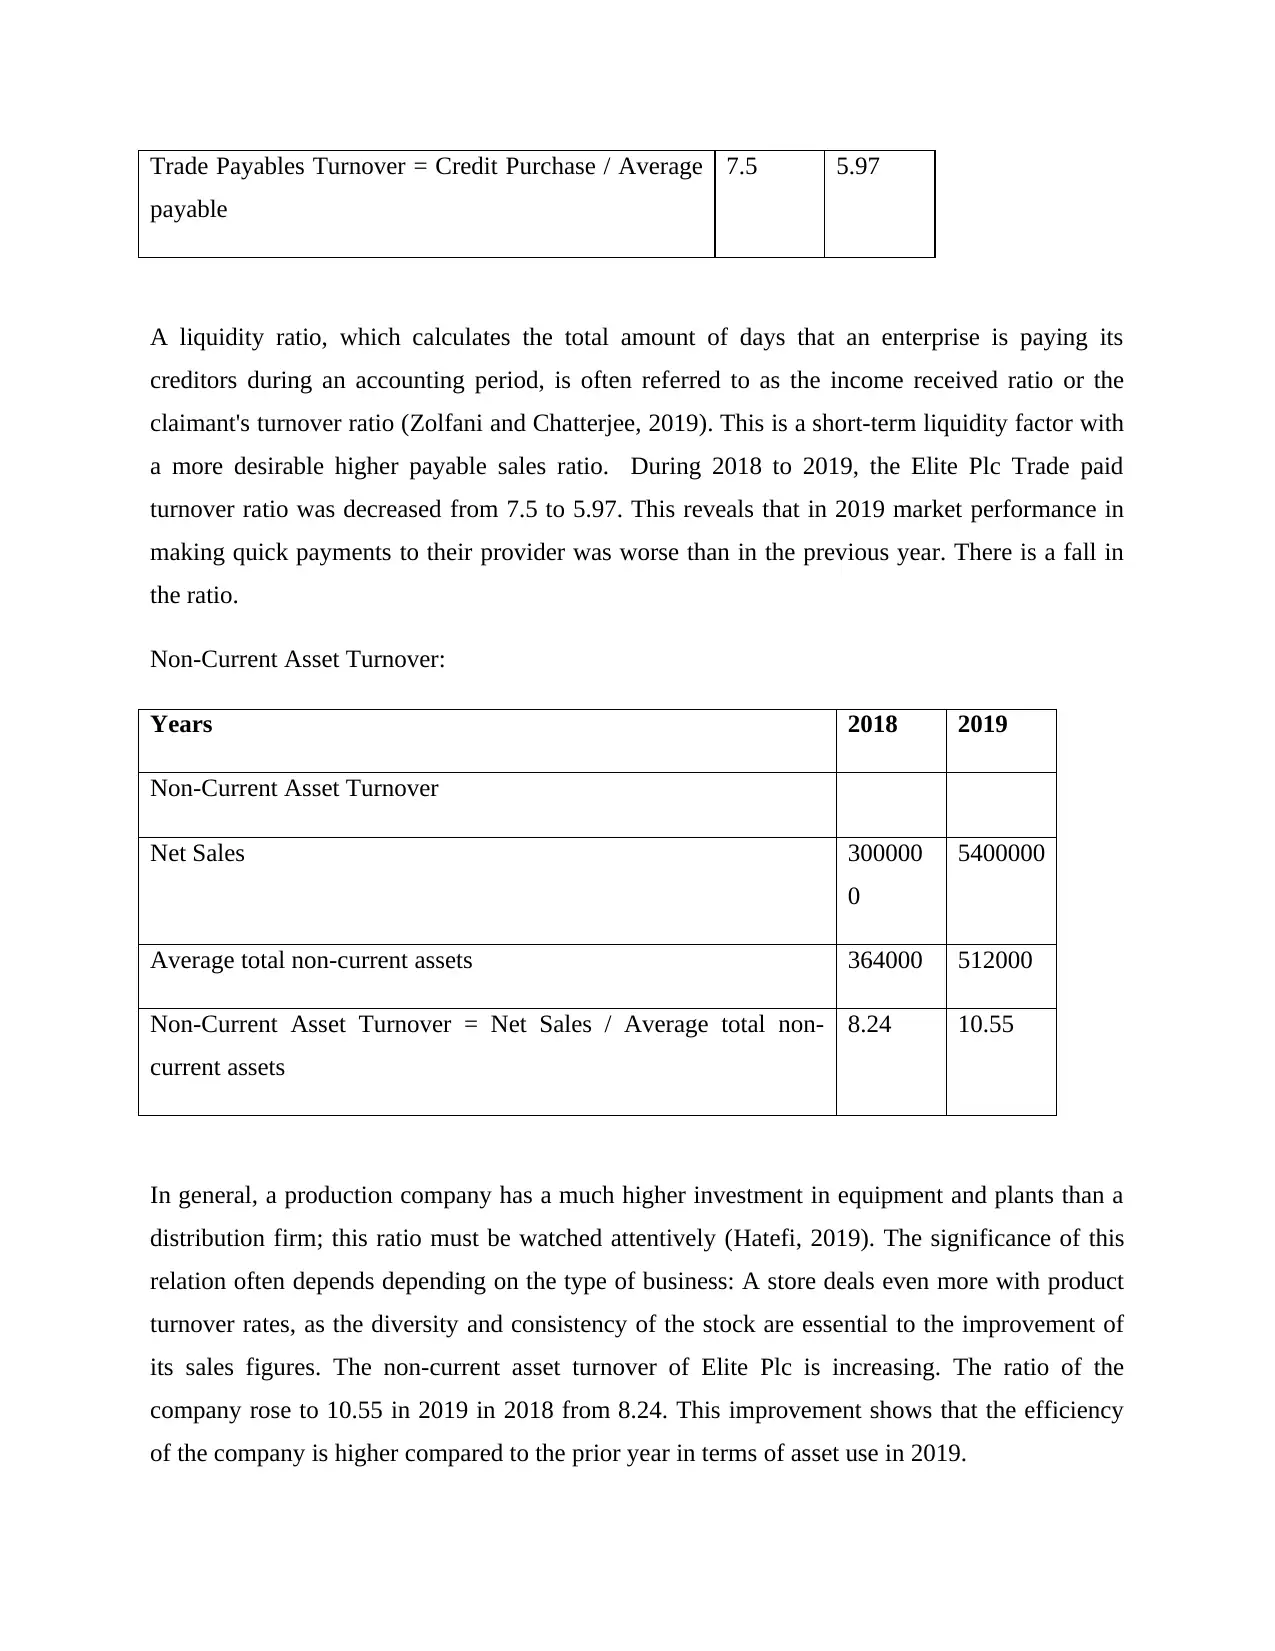
This report presents a financial analysis of Elite plc, focusing on the calculation and interpretation of various financial ratios for the years 2018 and 2019. The analysis includes the computation of gross profit ratio, operating profit ratio, return on capital employed, current ratio, acid test ratio, trade receivables turnover, trade payables turnover, and non-current asset turnover. Each ratio is calculated, and its implications on the company's performance and financial health are discussed. The report highlights trends in profitability, liquidity, and efficiency, providing insights into Elite plc's ability to manage its assets, liabilities, and overall financial standing. Based on the ratio analysis, recommendations are made to senior management, primarily focusing on improving the company's short-term liquidity, enhancing working capital management, and optimizing the collection of receivables and payment of payables. The report concludes with key suggestions for management to improve the overall economic situation of the company, including strategies for better financial control and operational efficiency.
Document Page
Financial Analysis Assessment
tabler-icon-diamond-filled.svg

Paraphrase This Document

Need a fresh take? Get an instant paraphrase of this document with our AI Paraphraser
Document Page
Contents
INTRODUCTION.......................................................................................................................................3
Main Body...................................................................................................................................................3
Computation of different ratios and analysis:..........................................................................................3
Recommendation:....................................................................................................................................8
REFERENCES............................................................................................................................................9
Document Page
INTRODUCTION
Financial analyses refer to the review method for the determination of the financial outcome of
the company. It supports the assessment of profit, financial stability, liquidity and longevity
(Zolfani, Yazdani and Zavadskas, 2018). The three key tools used in analyzing the financial
statements are the ratio study, the DuPont assessment and Common Size Financial results. Ratio
analysis is the most popular method. A company can assess various aspects using flexibility,
capital structures, and efficiency, growth and valuation ratios. Business financial review is
helpful to evaluate, compare and evaluate a company. Various players use different amounts for
their specific purposes. The thesis includes the calculation and interpretation of various financial
ratios on the basis of Elite plc's revenue statement and balance sheet. It also includes guidelines
focused on a company ratio review.
Main Body
Computation of different ratios and analysis:
Gross Profit Ratio:
Years 2018 2019
Gross Profit Ratio
Gross Profit 600000 1080000
Sales 3000000 5400000
Gross Profit Ratio = Gross Profit / Sales *100 20% 20%
It sets the ratio of gross profit to the net income generated from sales, also known as the Gross
Profit Percentage (Liang, Zhao and Hong, 2019). The GPR is the performance ratio, multi-plus
by 100. Productivity is the percent. The operating profit margin of Elite plc calculated at 20% for
the years 2018 and 2019. Gross productivity of companies does not increase.
Operating Profit Ratio:
Years 2018 2019
Document Page
Operating Profit Ratio
Operating Profit 240000 580000
Sales 3000000 5400000
Operating Profit Ratio = Operating profit / sales * 100 8% 10.74%
The proportion of operating profit provides a partnership between corporate profit and net
operating sales. The amount of operating profit calculated as a proportion is a form of
productivity. The operating profit margin of Elite plc was 8% and 10.74% in 2018 and 2019,
accordingly. The operating profit ratio from 2018 to 2019 is increasing. The outcome in 2019
was also worse than the previous year in terms of economic effectiveness to achieve net profit.
Return on Capital Employed:
Years 2018 2019
Return on Capital Employed
EBIT 240000 580000
Capital Employed 400000 800000
Return on Capital Employed = EBIT / Capital
Employed * 100
60% 72.5%
Capital returns are the profitability ratio which demonstrates how much income per pound of the
total capital used is produced (Mostafa, Montemagno and Qureshi, 2018). This shows how
company can generate revenue from the capital it has spent in enterprises. Elite plc's ROCE was
can in 2019, from 60% in 2018 to 72,5%. This shows that the performance of companies in
returning employed capital funds is higher than in 2018 in 2019.
Current Ratio:
tabler-icon-diamond-filled.svg

Paraphrase This Document

Need a fresh take? Get an instant paraphrase of this document with our AI Paraphraser
Document Page
Years 2018 2019
Current Ratio
Current Assets 876000 2252000
Current Liabilities 400000 1464000
Current Ratio = Current Assets / Current Liabilities 2.19 1.54
The current ratio, also recognized as the working capital relationship, calculates a company's
willingness, over one year, to fulfill its short-term obligations. The ratio takes into account the
weight from the current overall debts of the asset value. It shows how a firm's earnings stability
is and how liquidity of its existing reserves can be maximized for loan and payable repayments.
The total current assets of Elite plc have decreased from 2.19 in 2018 to 1.54 in 2019. This
decrease in 2019 reveals that the brief liquidity of the company is worse than last year.
Acid Test Ratio:
Years 2018 2019
Acid Test Ratio
Quick Assets (i.e. Current Assets - Inventories) 396000 812000
Current Liabilities 400000 1464000
Acid test Ratio = Quick Assets / Current Liabilities 0.99 0.55
The acid-proof ratio also known as the fast ratio provides a financial indicator of the capacity of
a firm to repay its existing obligations – in other words any debt, like card fees or payables
within one year that would need to be repaid (Kopanja, Kralj and Žunić, 2018). The acid test
shows whether a company will repay the loan with cash or liquid assets immediately. This is one
of the long term liquidity health measures of an enterprise. From 2018 to 2019, the company's
Document Page
acid test ratio has decreased from 0.99 to 0.55. The decrease in the acid test ratio in 2019 shows
that company cash liquidity in this year was worse than in 2018.
Trade Receivables Turnover:
Years 2018 2019
Trade Receivables Turnover
Credit Sales 300000
0
5400000
Average Accounts Receivables 396000 812000
Trade Receivables Turnover = Credit Sales / Average Accounts
Receivables
7.57 6.65
The debtors' sales ratio is a productivity ratio that calculates how well a business collects its
revenue – and therefore how efficiently it uses its actives. It is also recognized as the debt
collector’s turnover ratio. The receivable revenue ratio calculates the amount of days an
organization receives its total receivable over a given timeframe. The volume in Elite plc
receivables decreased to 6.65 in 2019 from 7.57 in 2018. This decrease in this proportion in 2019
suggests that the performance of the company in collecting accounts receivable was worse than
in 2018.
Trade Payables Turnover:
Years 2018 2019
Trade Payables Turnover
Credit purchase 240000
0
4320000
Average Payables 320000 724000
Document Page
Trade Payables Turnover = Credit Purchase / Average
payable
7.5 5.97
A liquidity ratio, which calculates the total amount of days that an enterprise is paying its
creditors during an accounting period, is often referred to as the income received ratio or the
claimant's turnover ratio (Zolfani and Chatterjee, 2019). This is a short-term liquidity factor with
a more desirable higher payable sales ratio. During 2018 to 2019, the Elite Plc Trade paid
turnover ratio was decreased from 7.5 to 5.97. This reveals that in 2019 market performance in
making quick payments to their provider was worse than in the previous year. There is a fall in
the ratio.
Non-Current Asset Turnover:
Years 2018 2019
Non-Current Asset Turnover
Net Sales 300000
0
5400000
Average total non-current assets 364000 512000
Non-Current Asset Turnover = Net Sales / Average total non-
current assets
8.24 10.55
In general, a production company has a much higher investment in equipment and plants than a
distribution firm; this ratio must be watched attentively (Hatefi, 2019). The significance of this
relation often depends depending on the type of business: A store deals even more with product
turnover rates, as the diversity and consistency of the stock are essential to the improvement of
its sales figures. The non-current asset turnover of Elite Plc is increasing. The ratio of the
company rose to 10.55 in 2019 in 2018 from 8.24. This improvement shows that the efficiency
of the company is higher compared to the prior year in terms of asset use in 2019.
tabler-icon-diamond-filled.svg

Paraphrase This Document

Need a fresh take? Get an instant paraphrase of this document with our AI Paraphraser
Document Page
Recommendation:
On the basis of an overview of Elite plc's two-year ratio, senior management is primarily advised
that they concentrate on the company's short-term liquidity situation. In order to improve the
liquidity of the firm, the company can repay commercial obligations, use long-term finance or
optimally handle all of its commercial receivables and accounts payable, and reduce some
associated costs. Further decrease in sales receivables and exchange payables turnover suggests
that companies should aim to establish a system for improved use of working capital. It is
suggested to shorten market operational cycling, receive all unpaid invoices on schedule and
thoroughly check custody credits in order to enhance business control of working capital. If no
reimbursement can be made for previous payments, organization can instead hold as much cash
as possible to pay debts. The assistance to extend the settlement terms was also improved by
debtors' agreements. However, if vendors cannot satisfy extended terms of payment, business
costs will increase considerably. That is because manufacturers should be funded with high
interest rates and the costs should be transferred to the firm. Therefore, these are several key
recommendations for management to improve the overall economic situation of the company.
Document Page
REFERENCES
Zolfani, S.H., Yazdani, M. and Zavadskas, E.K., 2018. An extended stepwise weight assessment
ratio analysis (SWARA) method for improving criteria prioritization process. Soft
Computing, 22(22), pp.7399-7405.
Liang, W., Zhao, G. and Hong, C., 2019. Selecting the optimal mining method with extended
multi-objective optimization by ratio analysis plus the full multiplicative form
(MULTIMOORA) approach. Neural Computing and Applications, 31(10), pp.5871-5886.
Mostafa, K.G., Montemagno, C. and Qureshi, A.J., 2018. Strength to cost ratio analysis of FDM
Nylon 12 3D Printed Parts. Procedia Manufacturing, 26, pp.753-762.
Kopanja, L., Tadić, M., Kralj, S. and Žunić, J., 2018. Shape and aspect ratio analysis of
anisotropic magnetic nanochains based on TEM micrographs. Ceramics International, 44(11),
pp.12340-12351.
Zolfani, S.H. and Chatterjee, P., 2019. Comparative evaluation of sustainable design based on
Step-Wise Weight Assessment Ratio Analysis (SWARA) and Best Worst Method (BWM)
methods: a perspective on household furnishing materials. Symmetry, 11(1), p.74.
Hatefi, M.A., 2019. Indifference threshold-based attribute ratio analysis: A method for assigning
the weights to the attributes in multiple attribute decision making. Applied Soft Computing, 74,
pp.643-651.
chevron_up_icon
1 out of 9
circle_padding
hide_on_mobile
zoom_out_icon
[object Object]