Financial Management and Analysis: Tesco and Morison Comparison
VerifiedAdded on 2020/02/05
|15
|4108
|36
Report
AI Summary
This report presents a comparative financial analysis of Tesco and Morison, two major retail companies in the UK, utilizing ratio analysis to evaluate their performance from 2012 to 2016. The analysis encompasses various financial ratios, including gross profit ratio, net profit ratio, current ratio, quick ratio, working capital turnover ratio, debt-equity ratio, earnings per share (EPS), and price-earnings (P/E) ratio. The report interprets these ratios to assess the companies' profitability, liquidity, working capital management, capital structure, and stock market performance. The findings reveal declining profitability for both companies, with Tesco showing a sharper decline. Liquidity positions are also assessed, with Tesco generally faring better than Morison. The study identifies key challenges such as discount retailing and the rise of competitors like Lidl and Aldi and concludes with recommendations for improvement.
FINANCIAL MANAGEMENT
AND ANALYSIS
AND ANALYSIS
Paraphrase This Document
Need a fresh take? Get an instant paraphrase of this document with our AI Paraphraser
TABLE OF CONTENTS
INTRODUCTION...........................................................................................................................3
Choice of company and justification for its inclusion................................................................3
Ratio analysis of Tesco and Morison..........................................................................................3
Weakness of ratio analysis........................................................................................................12
Recommendation...........................................................................................................................13
CONCLUSION..............................................................................................................................14
REFERENCES .............................................................................................................................15
INDEX OF TABLES
Table 1: Ratio analysis of Tesco and Morison ................................................................................3
ILLUSTRATION INDEX
Illustration 1: Gross profit ratio of the Tesco and Morison.............................................................5
Illustration 2: Net profit ratio of the Tesco and Morison.................................................................6
Illustration 3: Current ratio of the Tesco and Morison...................................................................7
Illustration 4: Quick ratio of the Tesco and Morison......................................................................8
Illustration 5: Working capital turnover ratio..................................................................................9
Illustration 6: Debt equity ratio of Tesco and Morison..................................................................10
Illustration 7: Earning per share of Tesco and Morison................................................................11
Illustration 8: Price earning ratio of Tesco and Morison...............................................................12
INTRODUCTION
Ratio analysis is one of the most important techniques which is used to measure the firm
performance. By using this method, company’s performance is evaluated on the basis of various
parameters. The technique is commonly used to compare two or more companies on the basis of
various criteria that are operating in the same industry. Financial analysts and equity research
analysts commonly use this method to do fundamental analysis. Hence, it can be assumed that
this method has great importance for the firms. In this report, two retail firms will be taken into
consideration and ratio analysis will be done by taking facts as well as figures of these firms. By
comparing firms on the basis of some of financial ratios, it will be identified that in which firm,
investors must make an investment. In the report, various categories of ratios will be computed
like profitability, liquidity, working capital management, capital structure and stock market
performance. On the basis of ratio analysis, weak points of the firm will be identified and on that
basis, recommendations will be made that can be used by the business firms to convert their
weakness into strength. It can be said that in this report, companies will be systematically
compared with each other.
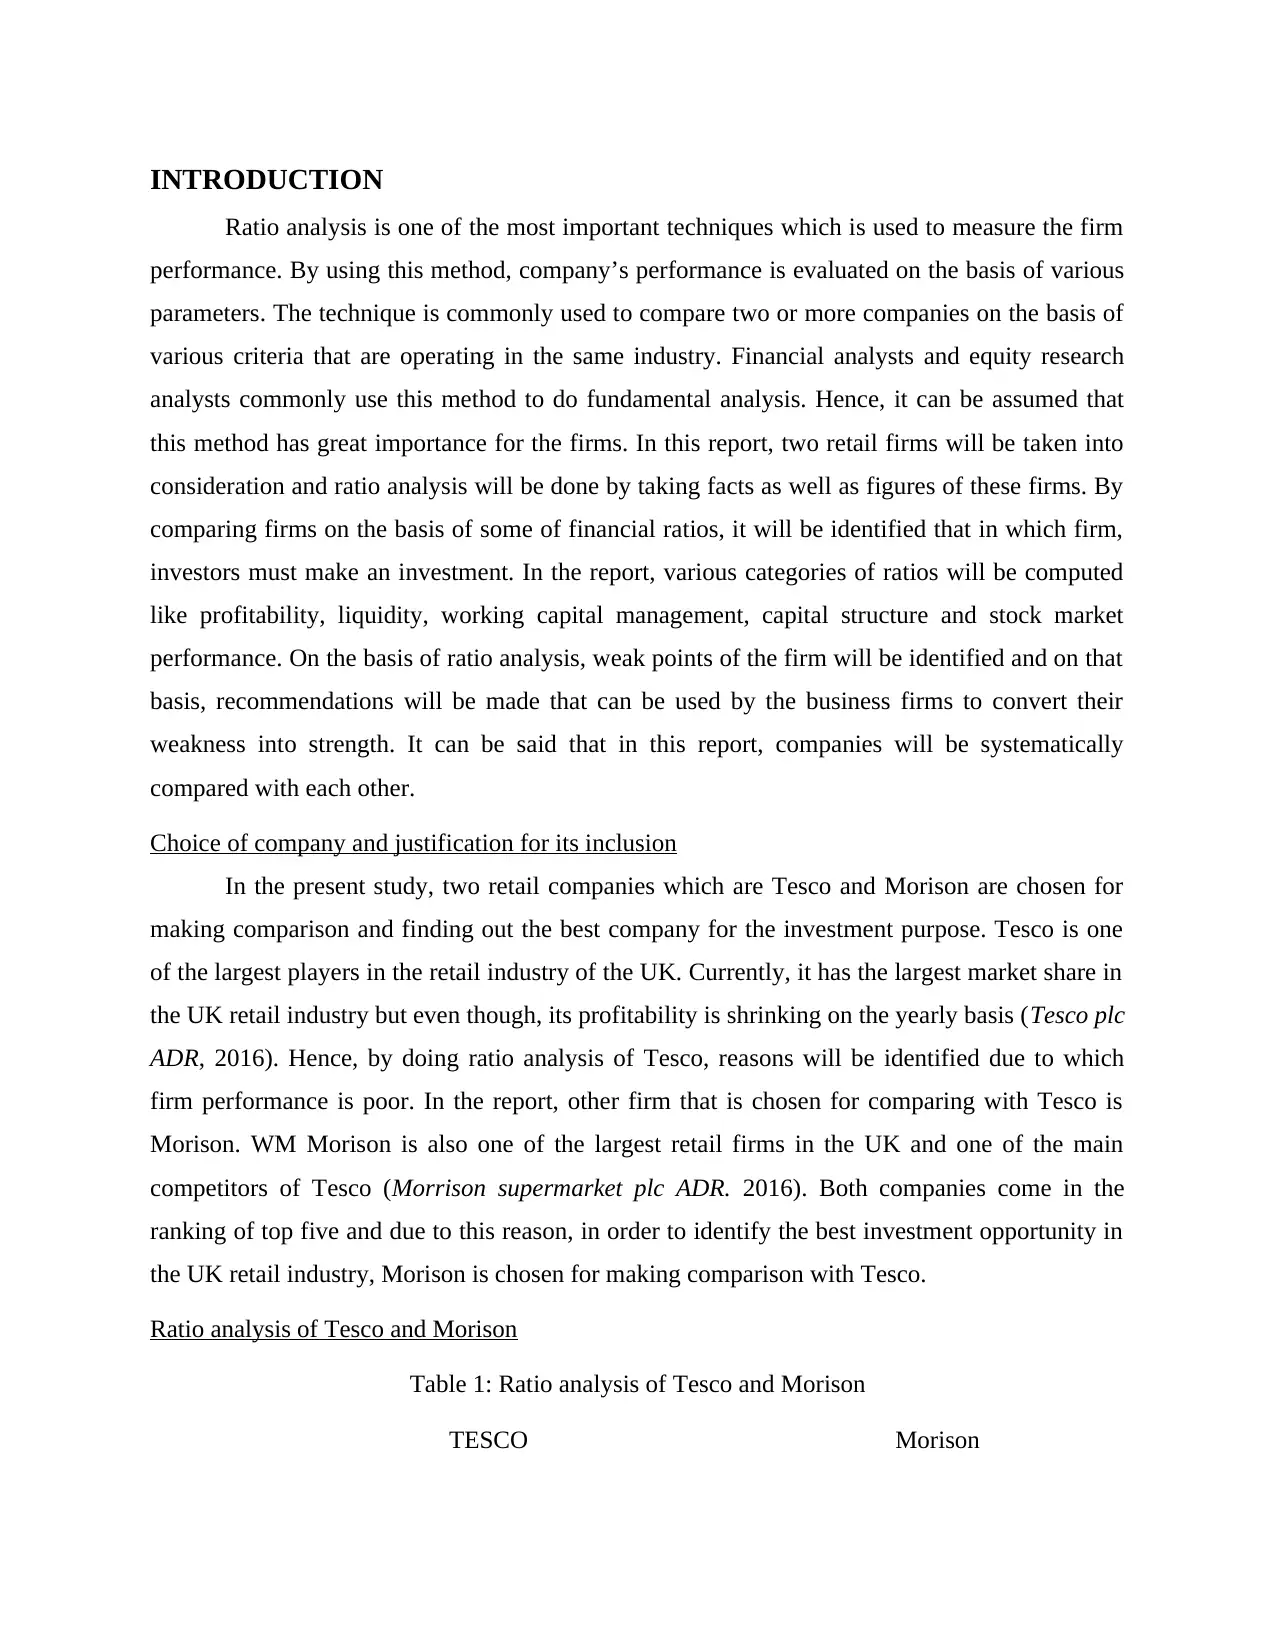
Choice of company and justification for its inclusion
In the present study, two retail companies which are Tesco and Morison are chosen for
making comparison and finding out the best company for the investment purpose. Tesco is one
of the largest players in the retail industry of the UK. Currently, it has the largest market share in
the UK retail industry but even though, its profitability is shrinking on the yearly basis (Tesco plc
ADR, 2016). Hence, by doing ratio analysis of Tesco, reasons will be identified due to which
firm performance is poor. In the report, other firm that is chosen for comparing with Tesco is
Morison. WM Morison is also one of the largest retail firms in the UK and one of the main
competitors of Tesco (Morrison supermarket plc ADR. 2016). Both companies come in the
ranking of top five and due to this reason, in order to identify the best investment opportunity in
the UK retail industry, Morison is chosen for making comparison with Tesco.
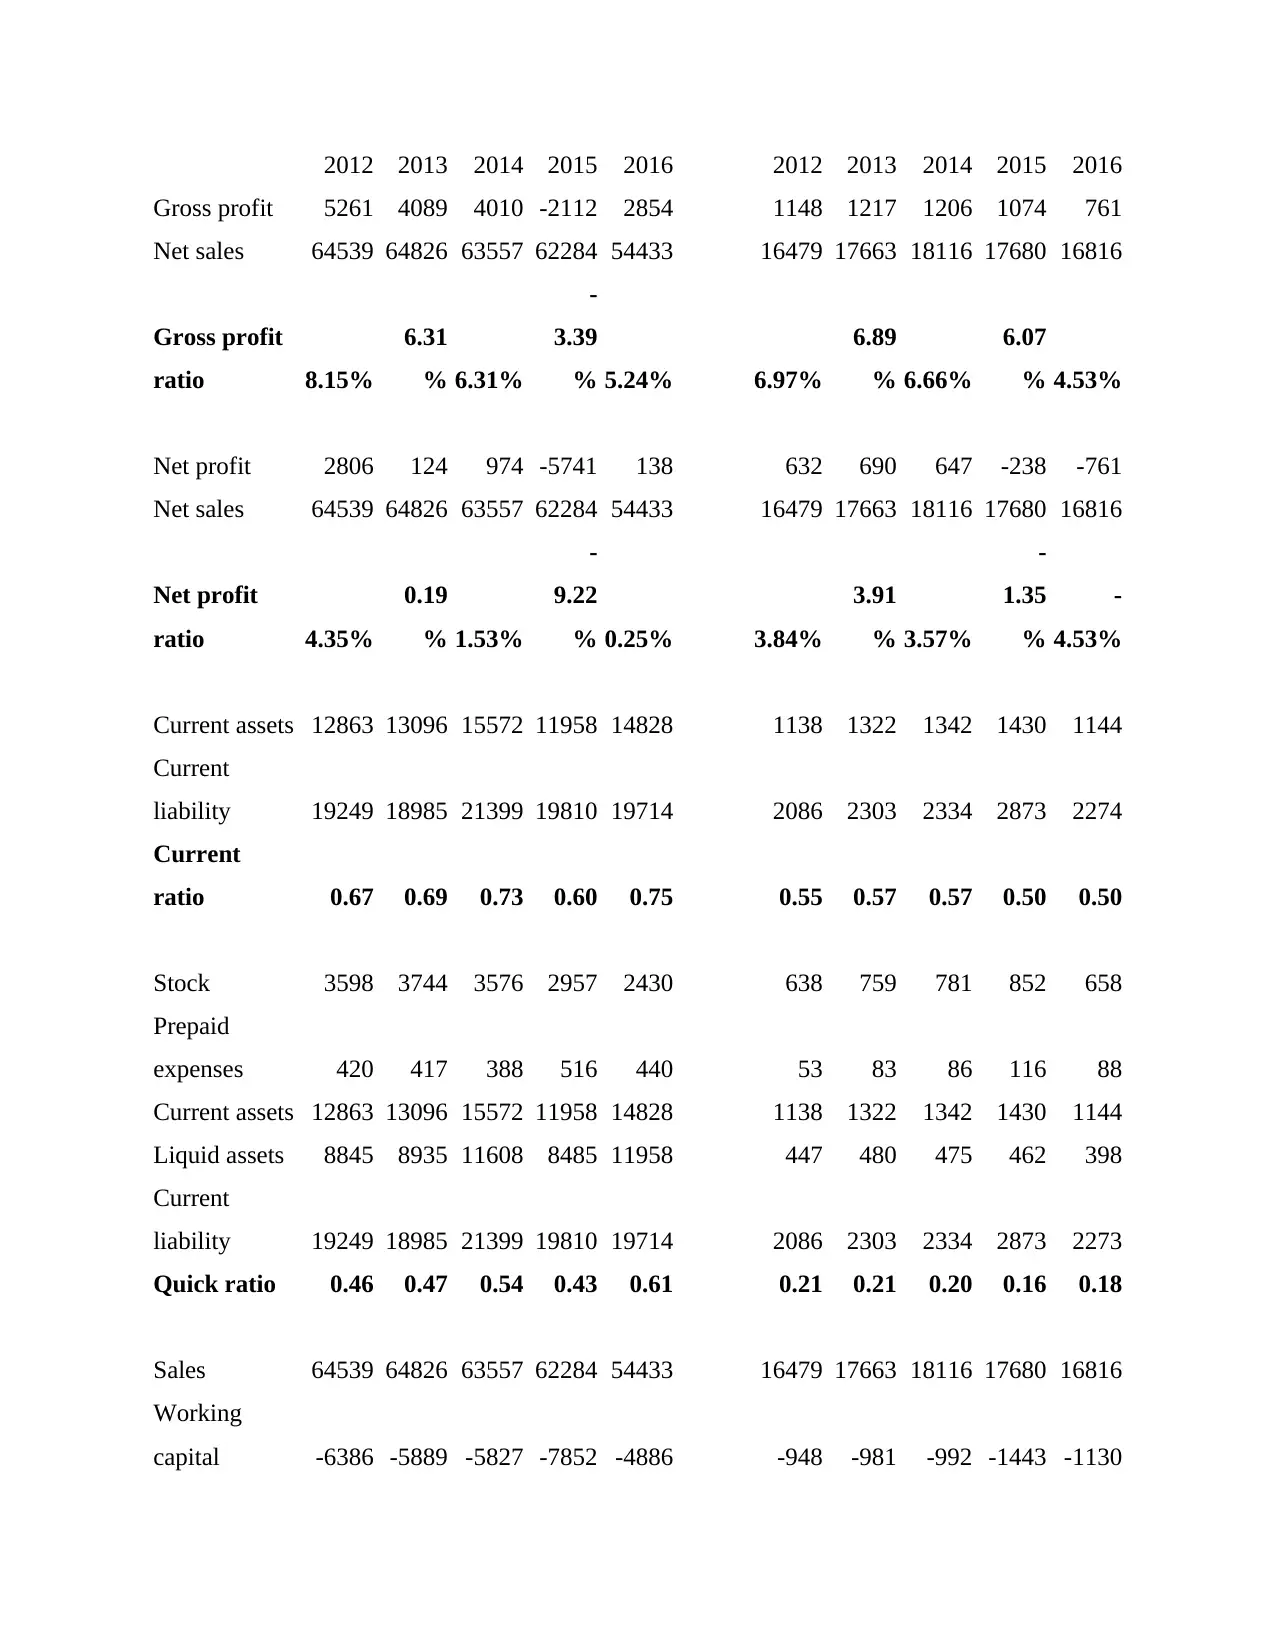
Ratio analysis of Tesco and Morison
Table 1: Ratio analysis of Tesco and Morison
TESCO Morison
Ratio analysis is one of the most important techniques which is used to measure the firm
performance. By using this method, company’s performance is evaluated on the basis of various
parameters. The technique is commonly used to compare two or more companies on the basis of
various criteria that are operating in the same industry. Financial analysts and equity research
analysts commonly use this method to do fundamental analysis. Hence, it can be assumed that
this method has great importance for the firms. In this report, two retail firms will be taken into
consideration and ratio analysis will be done by taking facts as well as figures of these firms. By
comparing firms on the basis of some of financial ratios, it will be identified that in which firm,
investors must make an investment. In the report, various categories of ratios will be computed
like profitability, liquidity, working capital management, capital structure and stock market
performance. On the basis of ratio analysis, weak points of the firm will be identified and on that
basis, recommendations will be made that can be used by the business firms to convert their
weakness into strength. It can be said that in this report, companies will be systematically
compared with each other.
Choice of company and justification for its inclusion
In the present study, two retail companies which are Tesco and Morison are chosen for
making comparison and finding out the best company for the investment purpose. Tesco is one
of the largest players in the retail industry of the UK. Currently, it has the largest market share in
the UK retail industry but even though, its profitability is shrinking on the yearly basis (Tesco plc
ADR, 2016). Hence, by doing ratio analysis of Tesco, reasons will be identified due to which
firm performance is poor. In the report, other firm that is chosen for comparing with Tesco is
Morison. WM Morison is also one of the largest retail firms in the UK and one of the main
competitors of Tesco (Morrison supermarket plc ADR. 2016). Both companies come in the
ranking of top five and due to this reason, in order to identify the best investment opportunity in
the UK retail industry, Morison is chosen for making comparison with Tesco.
Ratio analysis of Tesco and Morison
Table 1: Ratio analysis of Tesco and Morison
TESCO Morison
⊘ This is a preview!⊘
Do you want full access?
Subscribe today to unlock all pages.
Trusted by 1+ million students worldwide
2012 2013 2014 2015 2016 2012 2013 2014 2015 2016
Gross profit 5261 4089 4010 -2112 2854 1148 1217 1206 1074 761
Net sales 64539 64826 63557 62284 54433 16479 17663 18116 17680 16816
Gross profit
ratio 8.15%
6.31
% 6.31%
-
3.39
% 5.24% 6.97%
6.89
% 6.66%
6.07
% 4.53%
Net profit 2806 124 974 -5741 138 632 690 647 -238 -761
Net sales 64539 64826 63557 62284 54433 16479 17663 18116 17680 16816
Net profit
ratio 4.35%
0.19
% 1.53%
-
9.22
% 0.25% 3.84%
3.91
% 3.57%
-
1.35
%
-
4.53%
Current assets 12863 13096 15572 11958 14828 1138 1322 1342 1430 1144
Current
liability 19249 18985 21399 19810 19714 2086 2303 2334 2873 2274
Current
ratio 0.67 0.69 0.73 0.60 0.75 0.55 0.57 0.57 0.50 0.50
Stock 3598 3744 3576 2957 2430 638 759 781 852 658
Prepaid
expenses 420 417 388 516 440 53 83 86 116 88
Current assets 12863 13096 15572 11958 14828 1138 1322 1342 1430 1144
Liquid assets 8845 8935 11608 8485 11958 447 480 475 462 398
Current
liability 19249 18985 21399 19810 19714 2086 2303 2334 2873 2273
Quick ratio 0.46 0.47 0.54 0.43 0.61 0.21 0.21 0.20 0.16 0.18
Sales 64539 64826 63557 62284 54433 16479 17663 18116 17680 16816
Working
capital -6386 -5889 -5827 -7852 -4886 -948 -981 -992 -1443 -1130
Paraphrase This Document
Need a fresh take? Get an instant paraphrase of this document with our AI Paraphraser
Working
capital
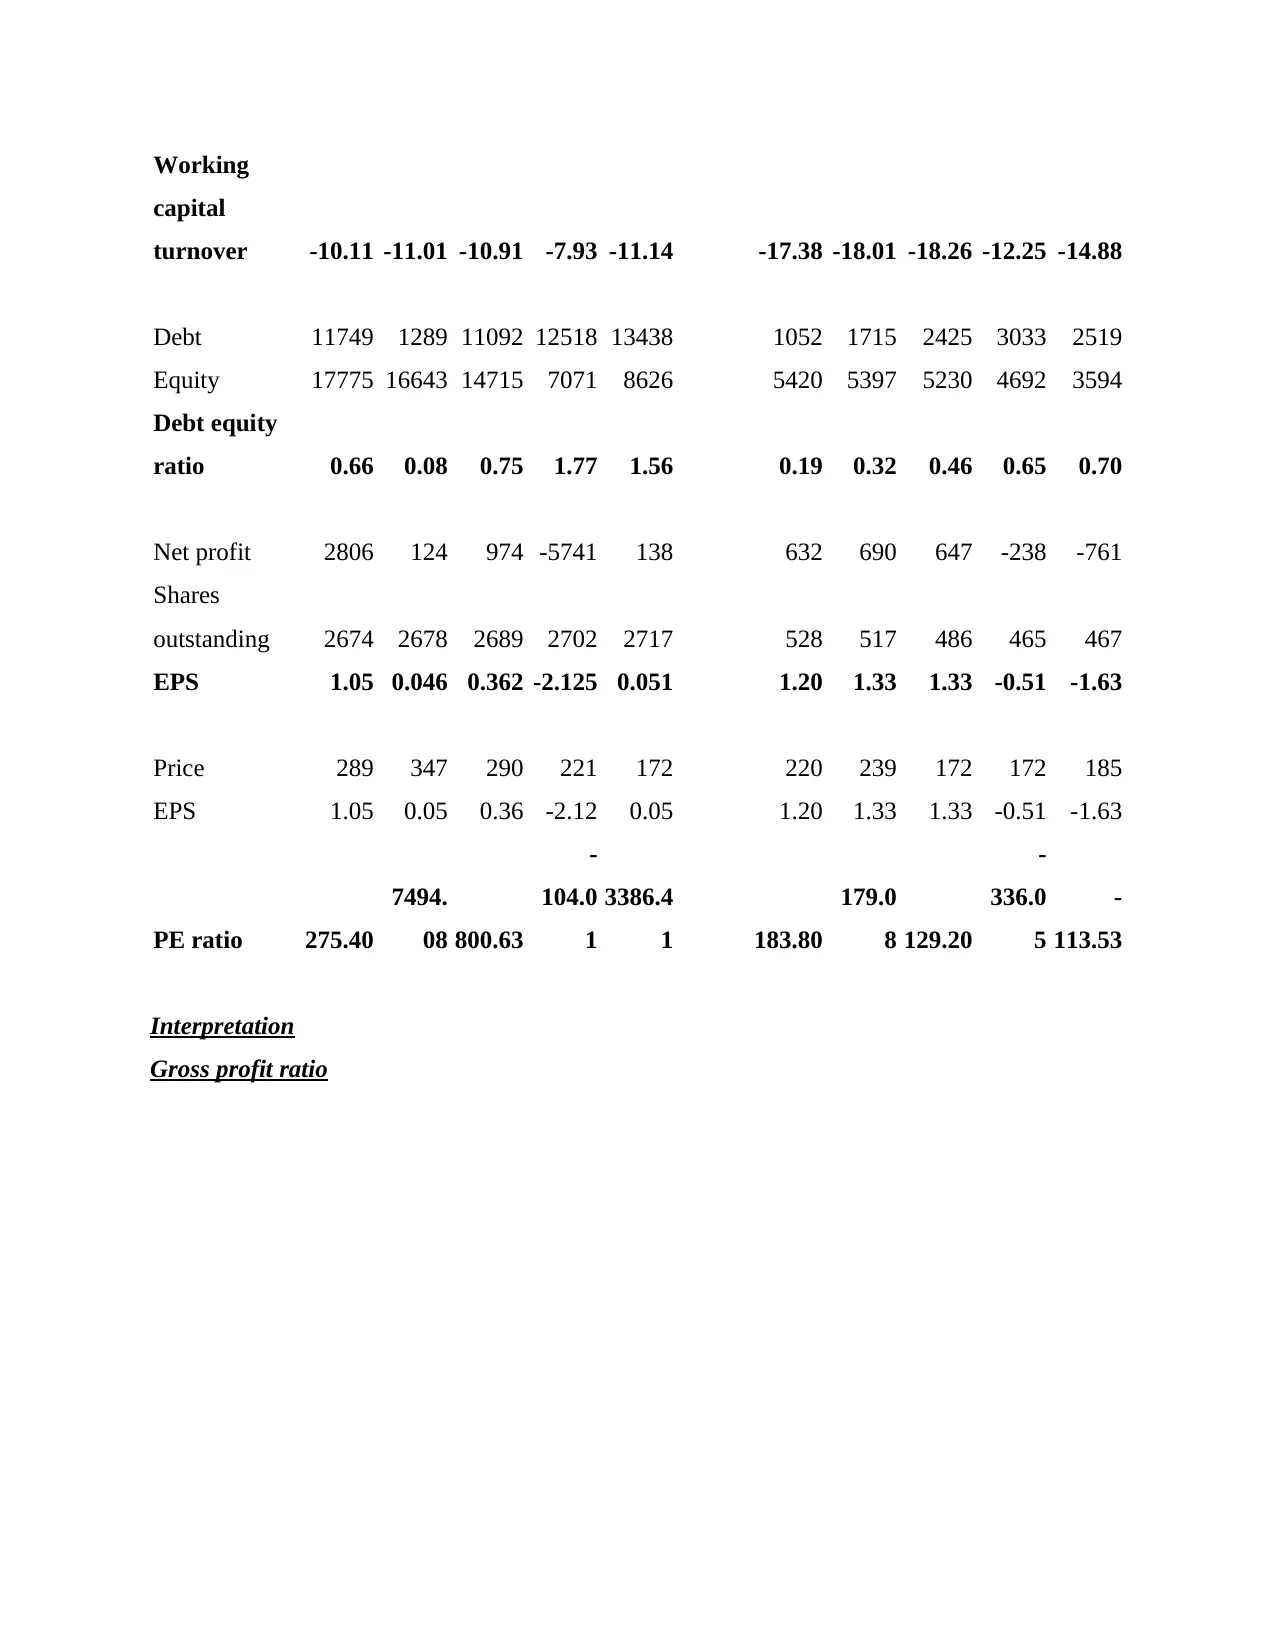
turnover -10.11 -11.01 -10.91 -7.93 -11.14 -17.38 -18.01 -18.26 -12.25 -14.88
Debt 11749 1289 11092 12518 13438 1052 1715 2425 3033 2519
Equity 17775 16643 14715 7071 8626 5420 5397 5230 4692 3594
Debt equity
ratio 0.66 0.08 0.75 1.77 1.56 0.19 0.32 0.46 0.65 0.70
Net profit 2806 124 974 -5741 138 632 690 647 -238 -761
Shares
outstanding 2674 2678 2689 2702 2717 528 517 486 465 467
EPS 1.05 0.046 0.362 -2.125 0.051 1.20 1.33 1.33 -0.51 -1.63
Price 289 347 290 221 172 220 239 172 172 185
EPS 1.05 0.05 0.36 -2.12 0.05 1.20 1.33 1.33 -0.51 -1.63
PE ratio 275.40
7494.
08 800.63
-
104.0
1
3386.4
1 183.80
179.0
8 129.20
-
336.0
5
-
113.53
Interpretation
Gross profit ratio
capital
turnover -10.11 -11.01 -10.91 -7.93 -11.14 -17.38 -18.01 -18.26 -12.25 -14.88
Debt 11749 1289 11092 12518 13438 1052 1715 2425 3033 2519
Equity 17775 16643 14715 7071 8626 5420 5397 5230 4692 3594
Debt equity
ratio 0.66 0.08 0.75 1.77 1.56 0.19 0.32 0.46 0.65 0.70
Net profit 2806 124 974 -5741 138 632 690 647 -238 -761
Shares
outstanding 2674 2678 2689 2702 2717 528 517 486 465 467
EPS 1.05 0.046 0.362 -2.125 0.051 1.20 1.33 1.33 -0.51 -1.63
Price 289 347 290 221 172 220 239 172 172 185
EPS 1.05 0.05 0.36 -2.12 0.05 1.20 1.33 1.33 -0.51 -1.63
PE ratio 275.40
7494.
08 800.63
-
104.0
1
3386.4
1 183.80
179.0
8 129.20
-
336.0
5
-
113.53
Interpretation
Gross profit ratio
Interpretation
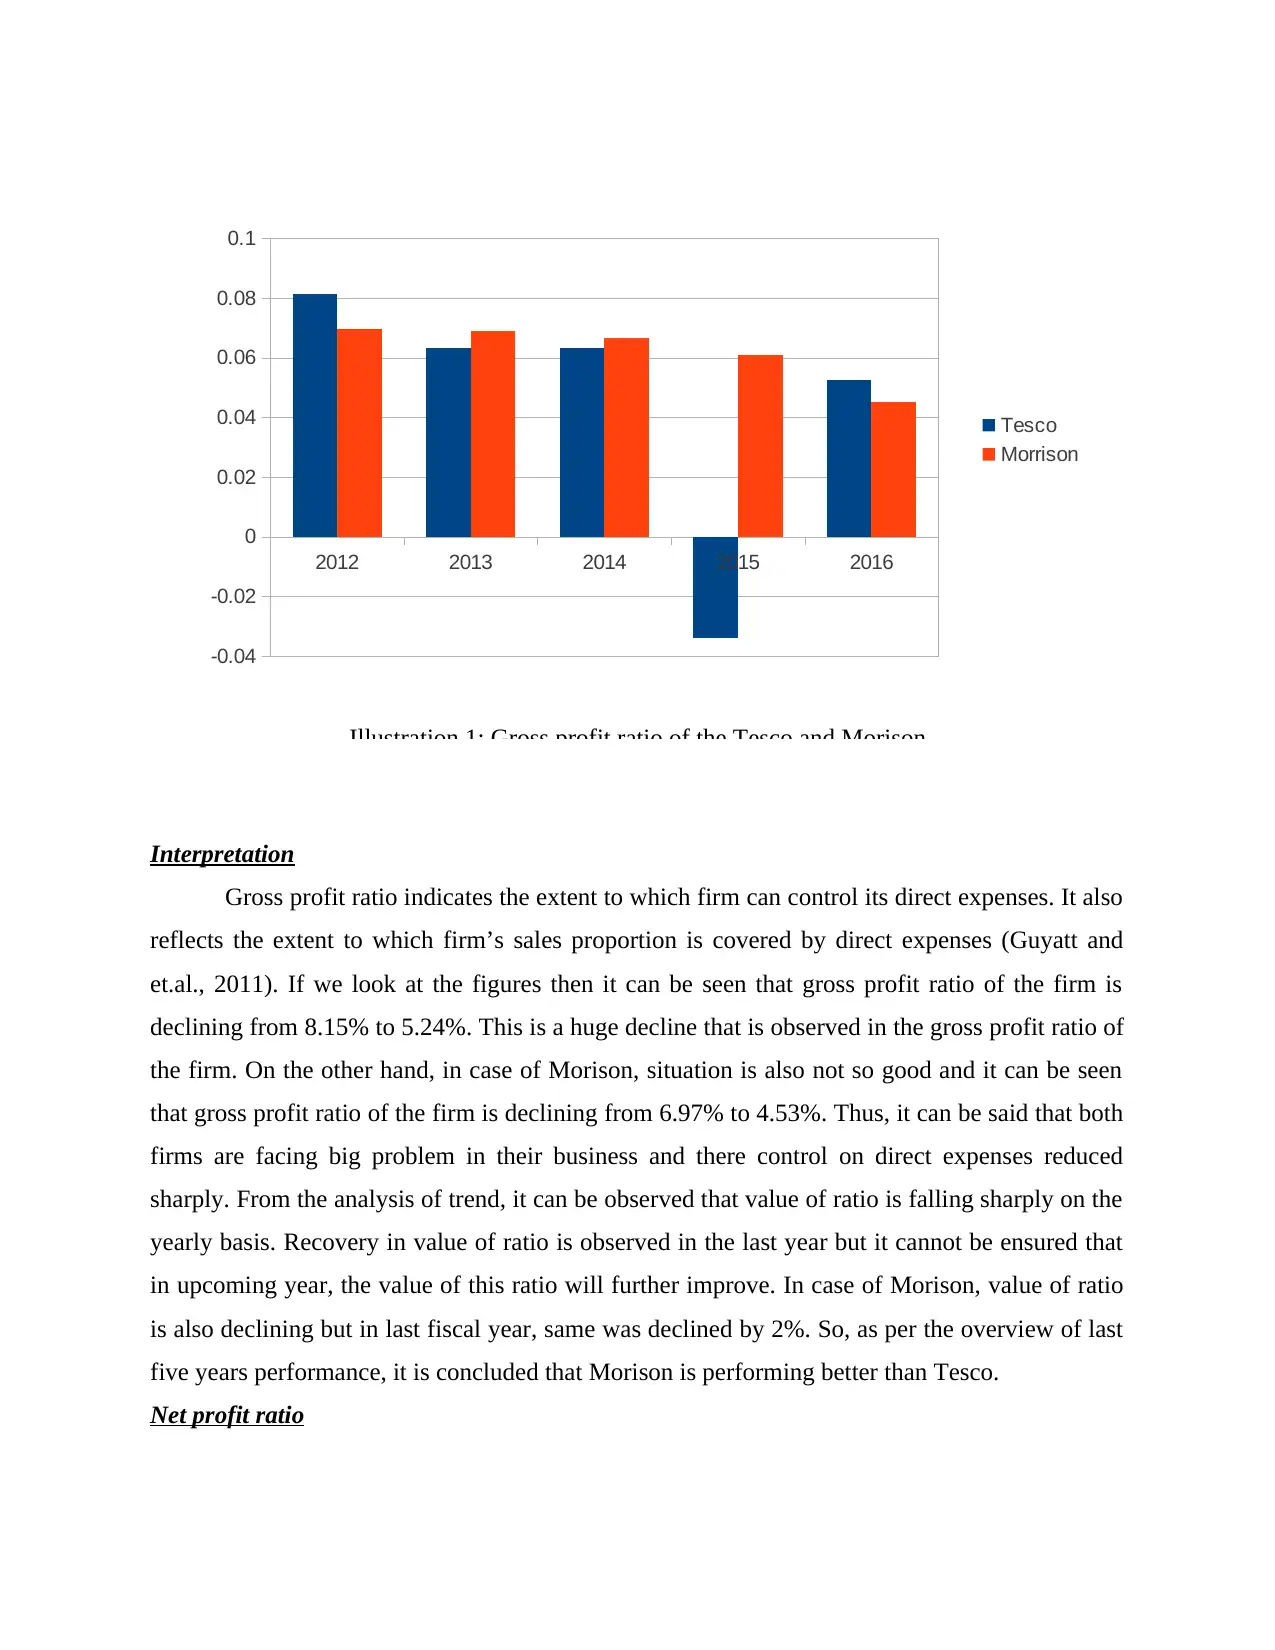
Gross profit ratio indicates the extent to which firm can control its direct expenses. It also
reflects the extent to which firm’s sales proportion is covered by direct expenses (Guyatt and
et.al., 2011). If we look at the figures then it can be seen that gross profit ratio of the firm is
declining from 8.15% to 5.24%. This is a huge decline that is observed in the gross profit ratio of
the firm. On the other hand, in case of Morison, situation is also not so good and it can be seen
that gross profit ratio of the firm is declining from 6.97% to 4.53%. Thus, it can be said that both
firms are facing big problem in their business and there control on direct expenses reduced
sharply. From the analysis of trend, it can be observed that value of ratio is falling sharply on the
yearly basis. Recovery in value of ratio is observed in the last year but it cannot be ensured that
in upcoming year, the value of this ratio will further improve. In case of Morison, value of ratio
is also declining but in last fiscal year, same was declined by 2%. So, as per the overview of last
five years performance, it is concluded that Morison is performing better than Tesco.
Net profit ratio
2012 2013 2014 2015 2016
-0.04
-0.02
0
0.02
0.04
0.06
0.08
0.1
Tesco
Morrison
Illustration 1: Gross profit ratio of the Tesco and Morison
⊘ This is a preview!⊘
Do you want full access?
Subscribe today to unlock all pages.
Trusted by 1+ million students worldwide
Interpretation
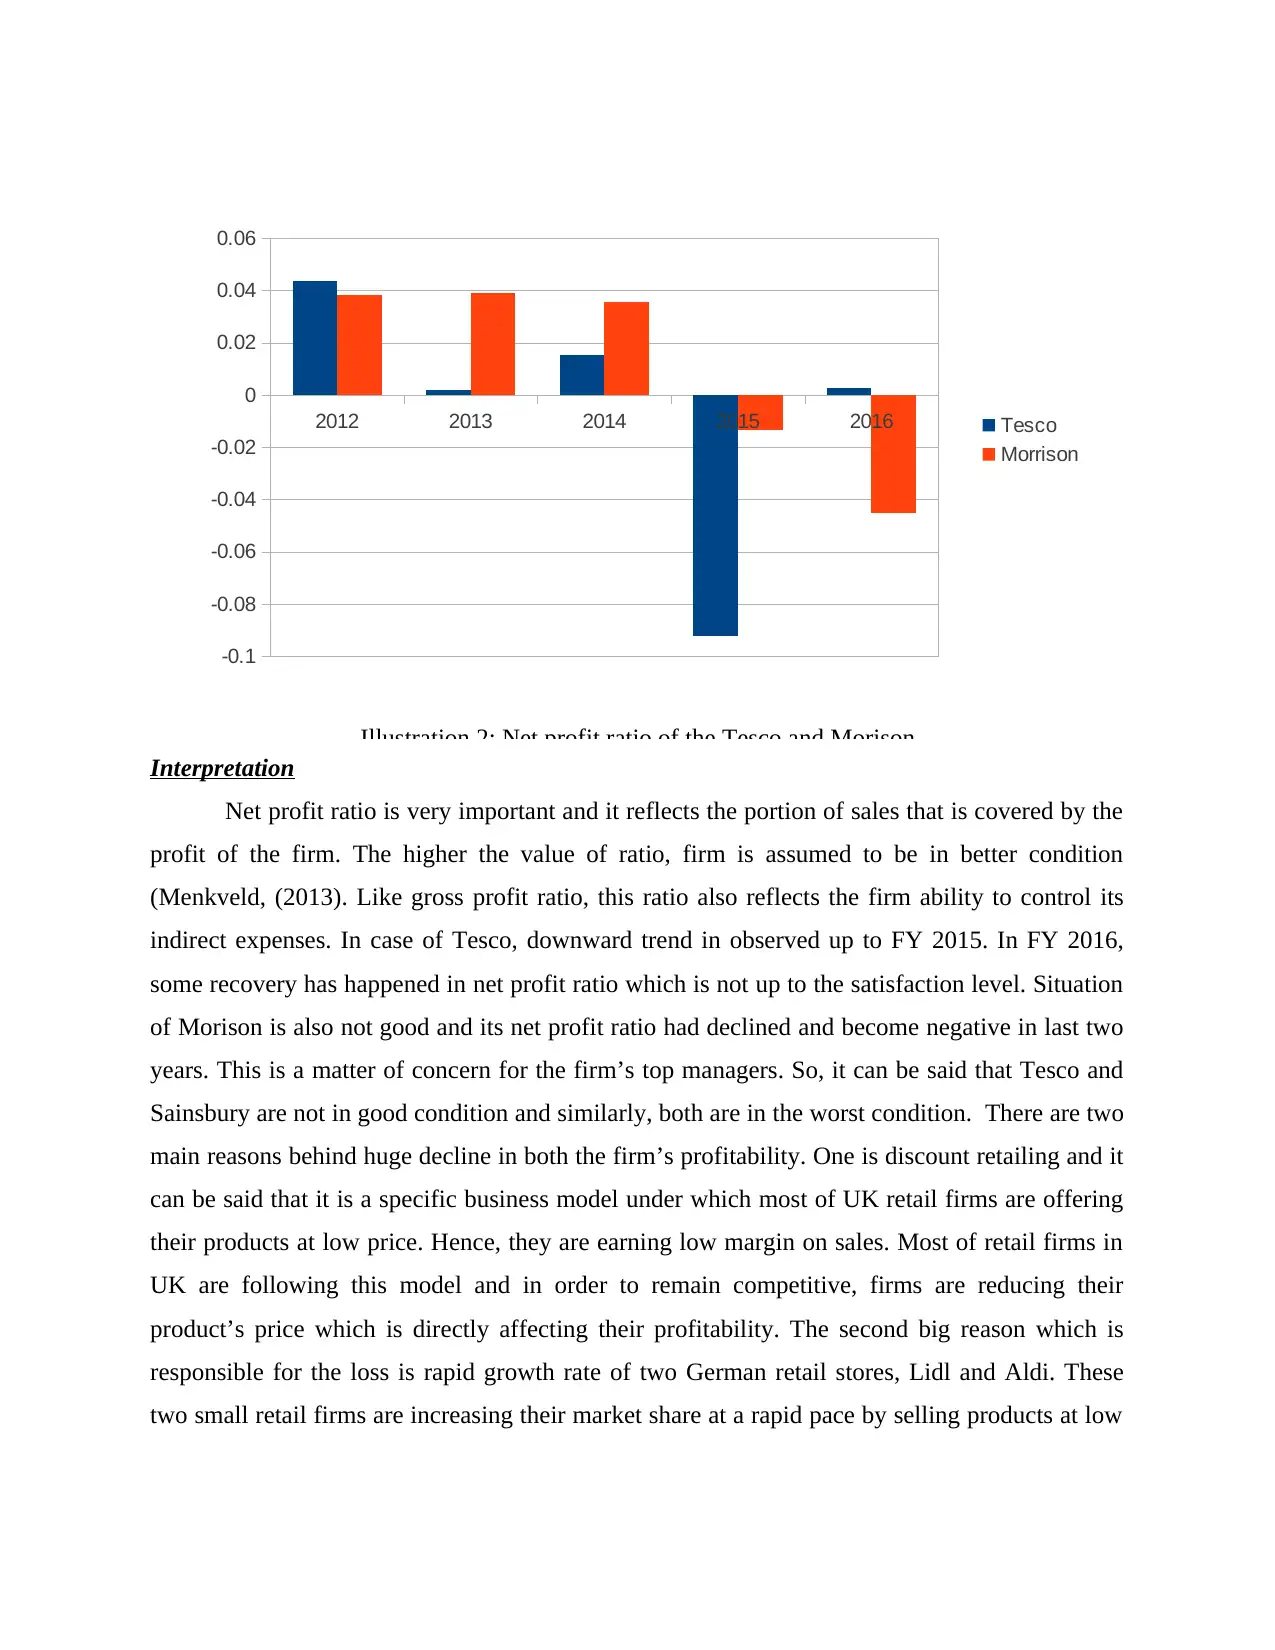
Net profit ratio is very important and it reflects the portion of sales that is covered by the
profit of the firm. The higher the value of ratio, firm is assumed to be in better condition
(Menkveld, (2013). Like gross profit ratio, this ratio also reflects the firm ability to control its
indirect expenses. In case of Tesco, downward trend in observed up to FY 2015. In FY 2016,
some recovery has happened in net profit ratio which is not up to the satisfaction level. Situation
of Morison is also not good and its net profit ratio had declined and become negative in last two
years. This is a matter of concern for the firm’s top managers. So, it can be said that Tesco and
Sainsbury are not in good condition and similarly, both are in the worst condition. There are two
main reasons behind huge decline in both the firm’s profitability. One is discount retailing and it
can be said that it is a specific business model under which most of UK retail firms are offering
their products at low price. Hence, they are earning low margin on sales. Most of retail firms in
UK are following this model and in order to remain competitive, firms are reducing their
product’s price which is directly affecting their profitability. The second big reason which is
responsible for the loss is rapid growth rate of two German retail stores, Lidl and Aldi. These
two small retail firms are increasing their market share at a rapid pace by selling products at low
2012 2013 2014 2015 2016
-0.1
-0.08
-0.06
-0.04
-0.02
0
0.02
0.04
0.06
Tesco
Morrison
Illustration 2: Net profit ratio of the Tesco and Morison
Paraphrase This Document
Need a fresh take? Get an instant paraphrase of this document with our AI Paraphraser
price and generating economies of scale in their business. Hence, firms need to find out the
solution of these two problems as fast as possible.
Current ratio
Interpretation
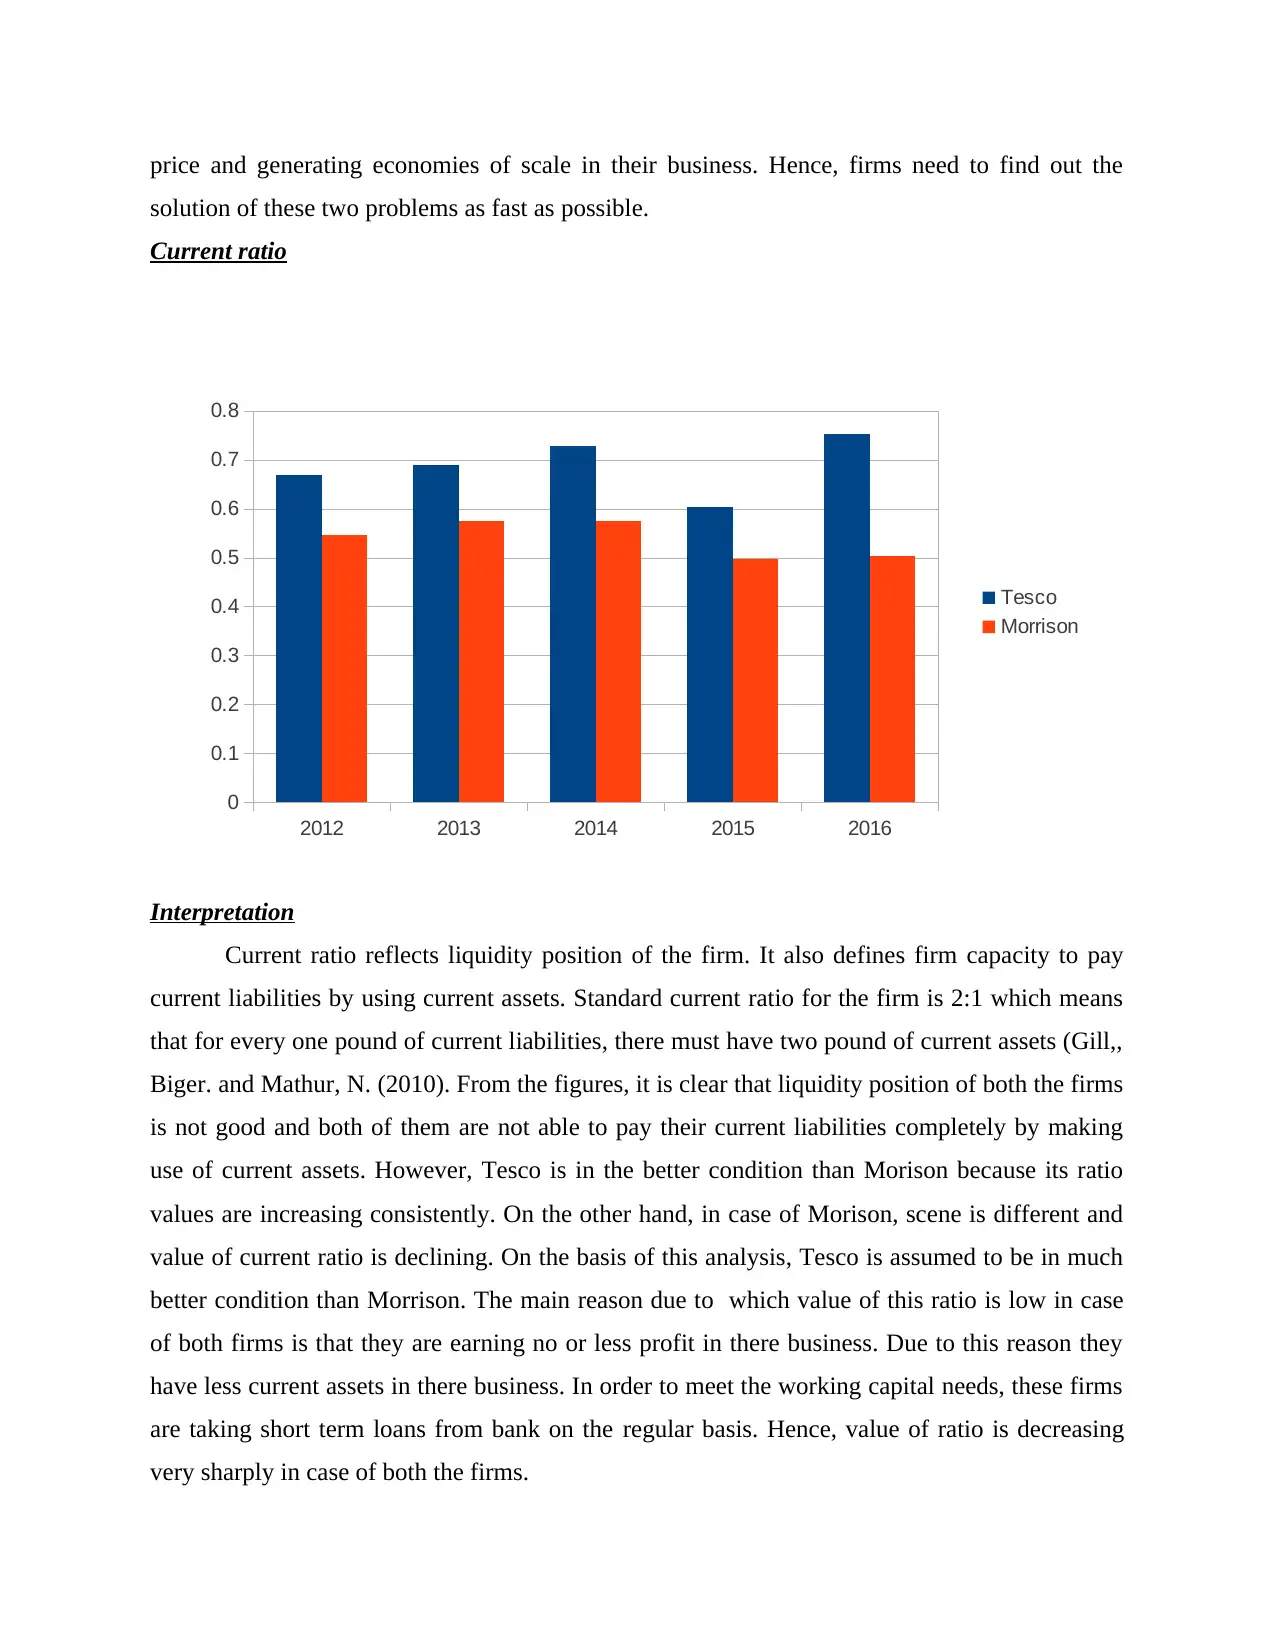
Current ratio reflects liquidity position of the firm. It also defines firm capacity to pay
current liabilities by using current assets. Standard current ratio for the firm is 2:1 which means
that for every one pound of current liabilities, there must have two pound of current assets (Gill,,
Biger. and Mathur, N. (2010). From the figures, it is clear that liquidity position of both the firms
is not good and both of them are not able to pay their current liabilities completely by making
use of current assets. However, Tesco is in the better condition than Morison because its ratio
values are increasing consistently. On the other hand, in case of Morison, scene is different and
value of current ratio is declining. On the basis of this analysis, Tesco is assumed to be in much
better condition than Morrison. The main reason due to which value of this ratio is low in case
of both firms is that they are earning no or less profit in there business. Due to this reason they
have less current assets in there business. In order to meet the working capital needs, these firms
are taking short term loans from bank on the regular basis. Hence, value of ratio is decreasing
very sharply in case of both the firms.
2012 2013 2014 2015 2016
0
0.1
0.2
0.3
0.4
0.5
0.6
0.7
0.8
Tesco
Morrison
Illustration 3: Current ratio of the Tesco and Morison
solution of these two problems as fast as possible.
Current ratio
Interpretation
Current ratio reflects liquidity position of the firm. It also defines firm capacity to pay
current liabilities by using current assets. Standard current ratio for the firm is 2:1 which means
that for every one pound of current liabilities, there must have two pound of current assets (Gill,,
Biger. and Mathur, N. (2010). From the figures, it is clear that liquidity position of both the firms
is not good and both of them are not able to pay their current liabilities completely by making
use of current assets. However, Tesco is in the better condition than Morison because its ratio
values are increasing consistently. On the other hand, in case of Morison, scene is different and
value of current ratio is declining. On the basis of this analysis, Tesco is assumed to be in much
better condition than Morrison. The main reason due to which value of this ratio is low in case
of both firms is that they are earning no or less profit in there business. Due to this reason they
have less current assets in there business. In order to meet the working capital needs, these firms
are taking short term loans from bank on the regular basis. Hence, value of ratio is decreasing
very sharply in case of both the firms.
2012 2013 2014 2015 2016
0
0.1
0.2
0.3
0.4
0.5
0.6
0.7
0.8
Tesco
Morrison
Illustration 3: Current ratio of the Tesco and Morison
Quick ratio
Interpretation
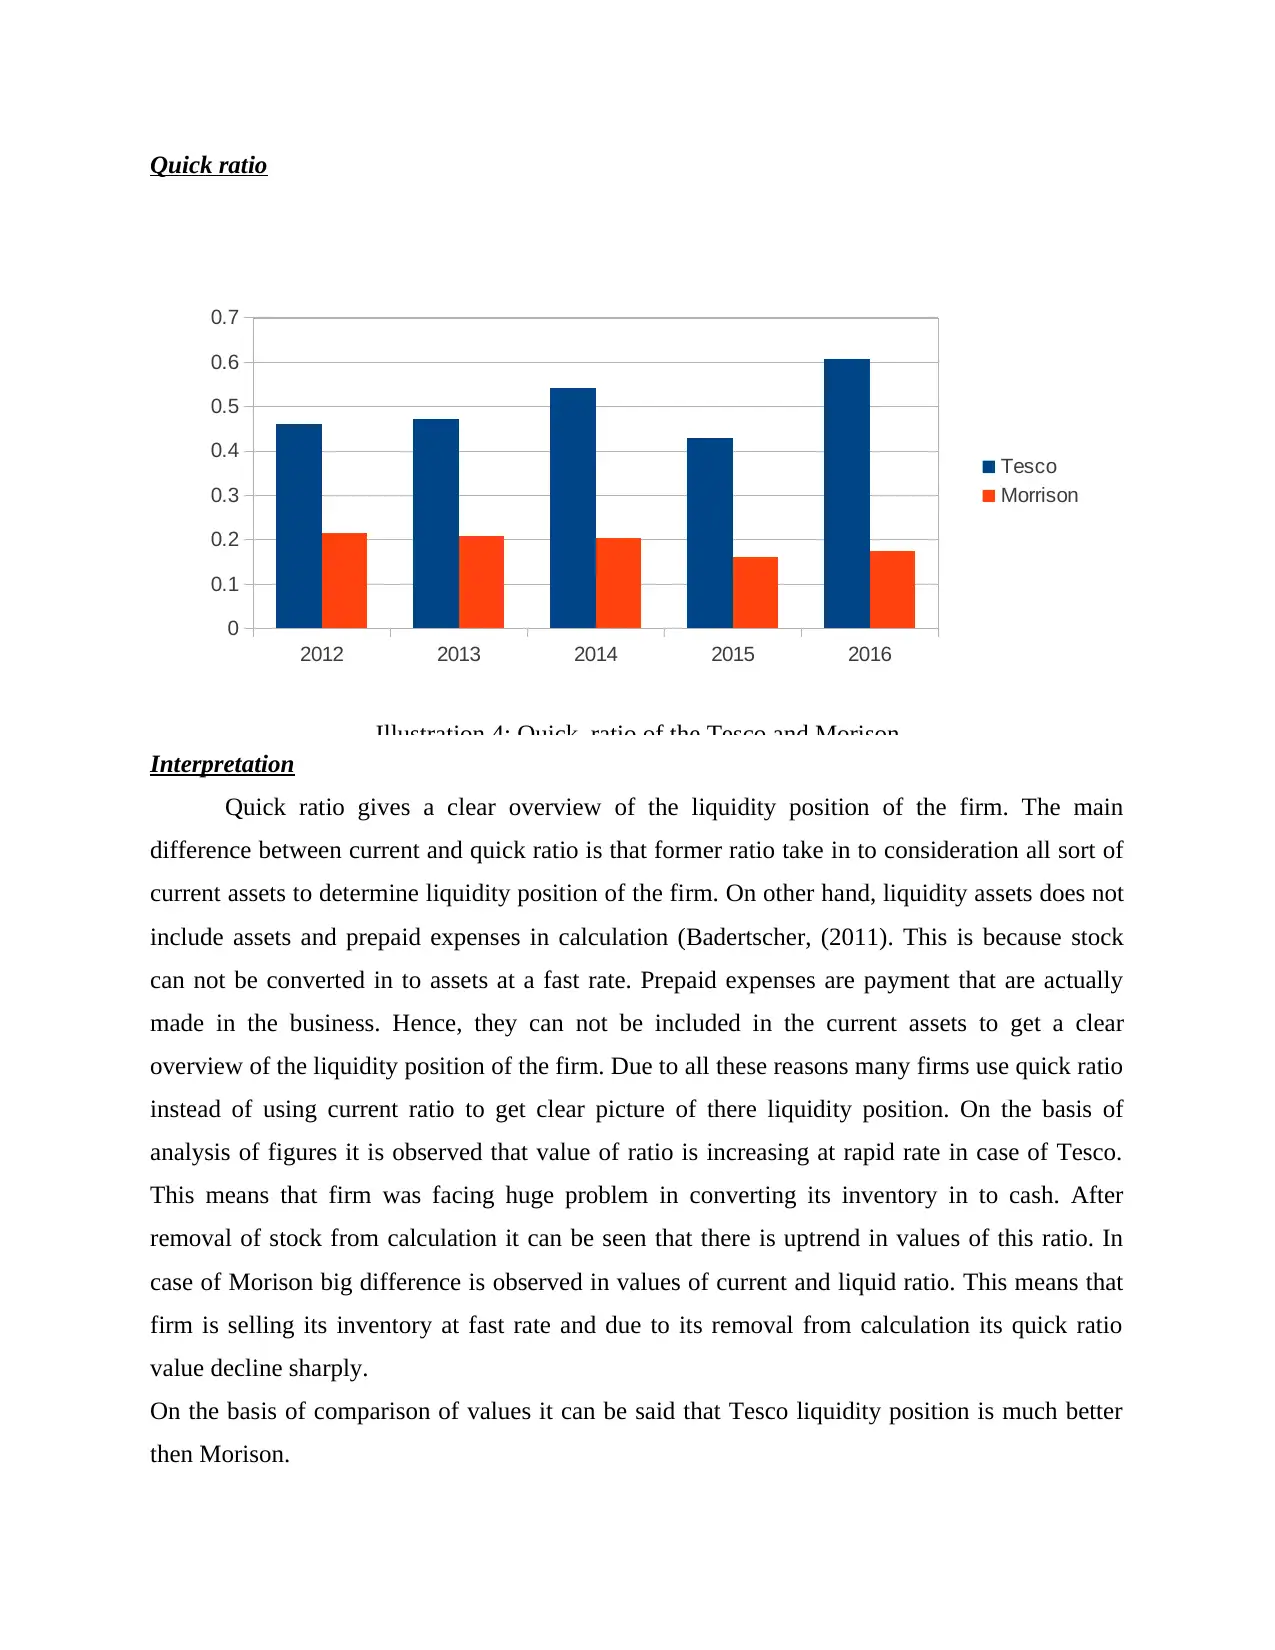
Quick ratio gives a clear overview of the liquidity position of the firm. The main
difference between current and quick ratio is that former ratio take in to consideration all sort of
current assets to determine liquidity position of the firm. On other hand, liquidity assets does not
include assets and prepaid expenses in calculation (Badertscher, (2011). This is because stock
can not be converted in to assets at a fast rate. Prepaid expenses are payment that are actually
made in the business. Hence, they can not be included in the current assets to get a clear
overview of the liquidity position of the firm. Due to all these reasons many firms use quick ratio
instead of using current ratio to get clear picture of there liquidity position. On the basis of
analysis of figures it is observed that value of ratio is increasing at rapid rate in case of Tesco.
This means that firm was facing huge problem in converting its inventory in to cash. After
removal of stock from calculation it can be seen that there is uptrend in values of this ratio. In
case of Morison big difference is observed in values of current and liquid ratio. This means that
firm is selling its inventory at fast rate and due to its removal from calculation its quick ratio
value decline sharply.
On the basis of comparison of values it can be said that Tesco liquidity position is much better
then Morison.
2012 2013 2014 2015 2016
0
0.1
0.2
0.3
0.4
0.5
0.6
0.7
Tesco
Morrison
Illustration 4: Quick ratio of the Tesco and Morison
Interpretation
Quick ratio gives a clear overview of the liquidity position of the firm. The main
difference between current and quick ratio is that former ratio take in to consideration all sort of
current assets to determine liquidity position of the firm. On other hand, liquidity assets does not
include assets and prepaid expenses in calculation (Badertscher, (2011). This is because stock
can not be converted in to assets at a fast rate. Prepaid expenses are payment that are actually
made in the business. Hence, they can not be included in the current assets to get a clear
overview of the liquidity position of the firm. Due to all these reasons many firms use quick ratio
instead of using current ratio to get clear picture of there liquidity position. On the basis of
analysis of figures it is observed that value of ratio is increasing at rapid rate in case of Tesco.
This means that firm was facing huge problem in converting its inventory in to cash. After
removal of stock from calculation it can be seen that there is uptrend in values of this ratio. In
case of Morison big difference is observed in values of current and liquid ratio. This means that
firm is selling its inventory at fast rate and due to its removal from calculation its quick ratio
value decline sharply.
On the basis of comparison of values it can be said that Tesco liquidity position is much better
then Morison.
2012 2013 2014 2015 2016
0
0.1
0.2
0.3
0.4
0.5
0.6
0.7
Tesco
Morrison
Illustration 4: Quick ratio of the Tesco and Morison
⊘ This is a preview!⊘
Do you want full access?
Subscribe today to unlock all pages.
Trusted by 1+ million students worldwide
Working capital turnover ratio
Interpretation
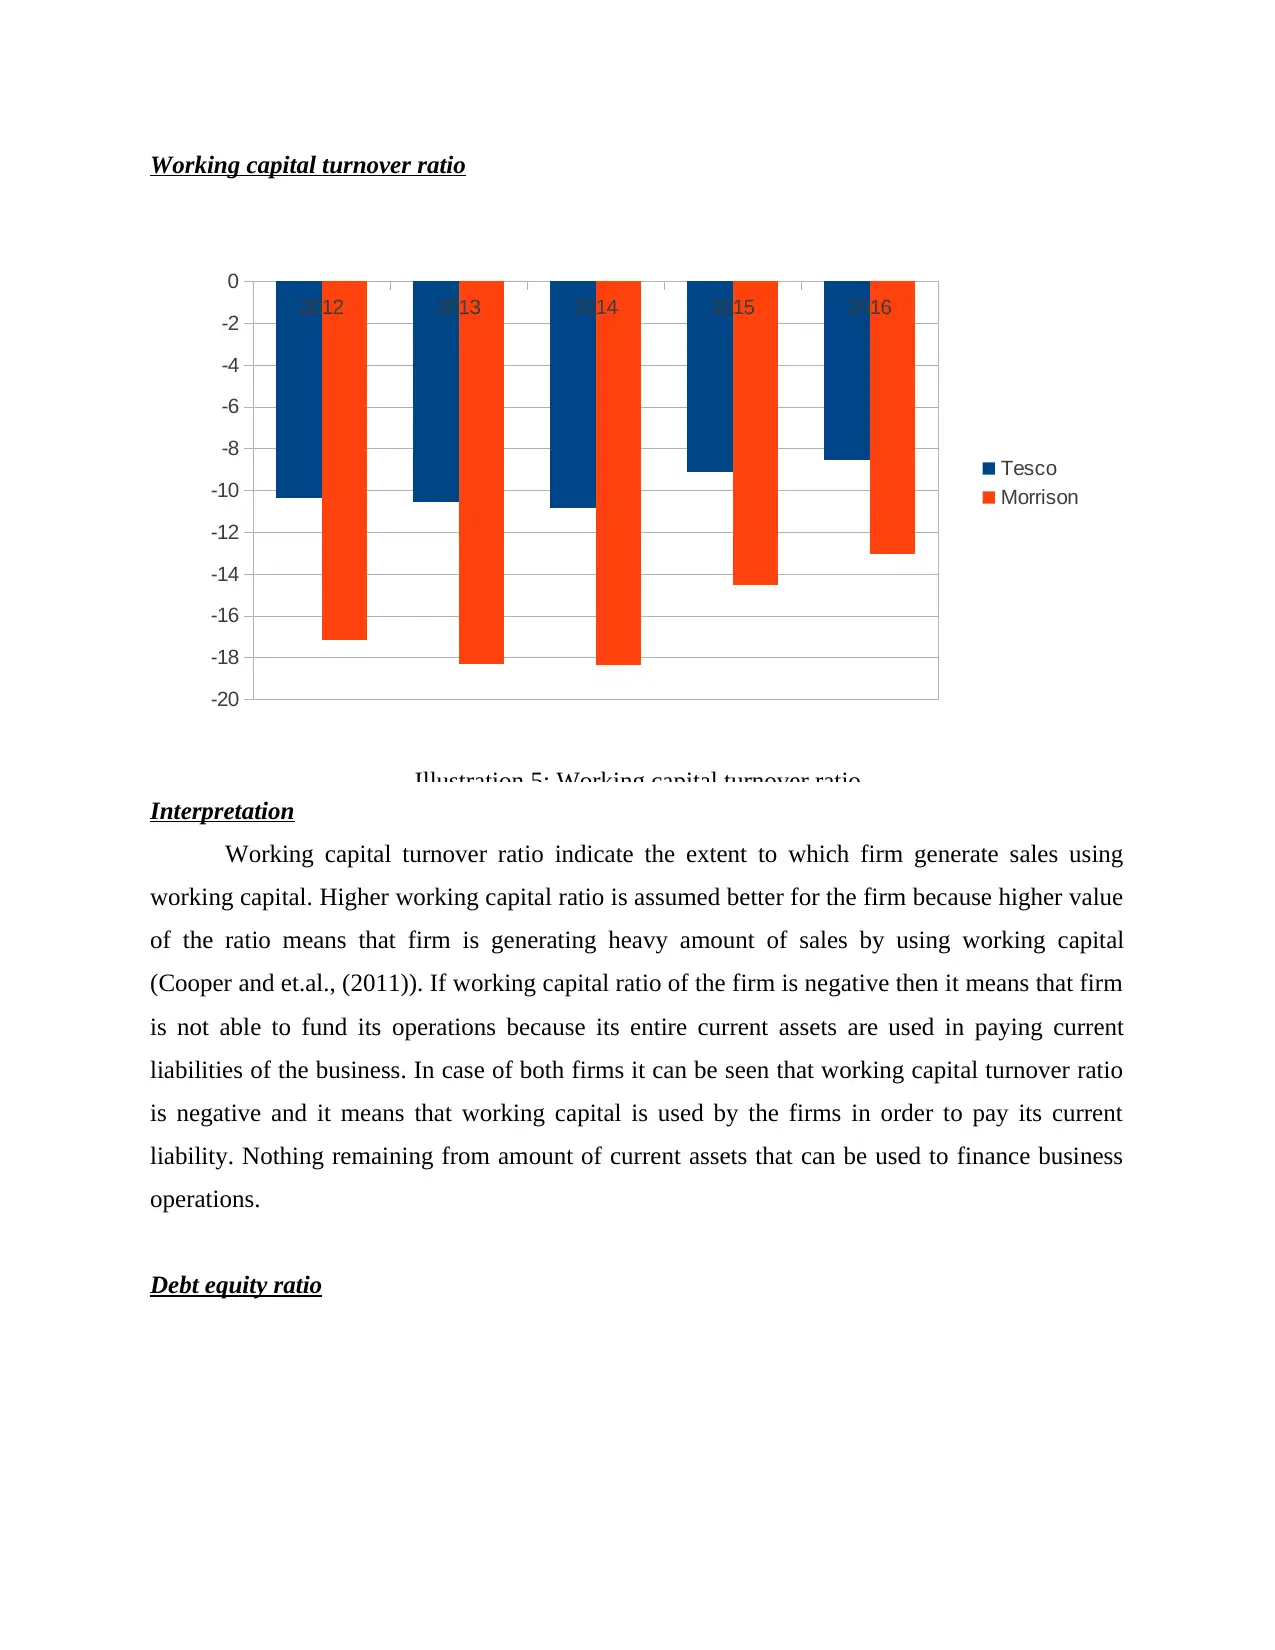
Working capital turnover ratio indicate the extent to which firm generate sales using
working capital. Higher working capital ratio is assumed better for the firm because higher value
of the ratio means that firm is generating heavy amount of sales by using working capital
(Cooper and et.al., (2011)). If working capital ratio of the firm is negative then it means that firm
is not able to fund its operations because its entire current assets are used in paying current
liabilities of the business. In case of both firms it can be seen that working capital turnover ratio
is negative and it means that working capital is used by the firms in order to pay its current
liability. Nothing remaining from amount of current assets that can be used to finance business
operations.
Debt equity ratio
2012 2013 2014 2015 2016
-20
-18
-16
-14
-12
-10
-8
-6
-4
-2
0
Tesco
Morrison
Illustration 5: Working capital turnover ratio
Interpretation
Working capital turnover ratio indicate the extent to which firm generate sales using
working capital. Higher working capital ratio is assumed better for the firm because higher value
of the ratio means that firm is generating heavy amount of sales by using working capital
(Cooper and et.al., (2011)). If working capital ratio of the firm is negative then it means that firm
is not able to fund its operations because its entire current assets are used in paying current
liabilities of the business. In case of both firms it can be seen that working capital turnover ratio
is negative and it means that working capital is used by the firms in order to pay its current
liability. Nothing remaining from amount of current assets that can be used to finance business
operations.
Debt equity ratio
2012 2013 2014 2015 2016
-20
-18
-16
-14
-12
-10
-8
-6
-4
-2
0
Tesco
Morrison
Illustration 5: Working capital turnover ratio
Paraphrase This Document
Need a fresh take? Get an instant paraphrase of this document with our AI Paraphraser
Interpretation
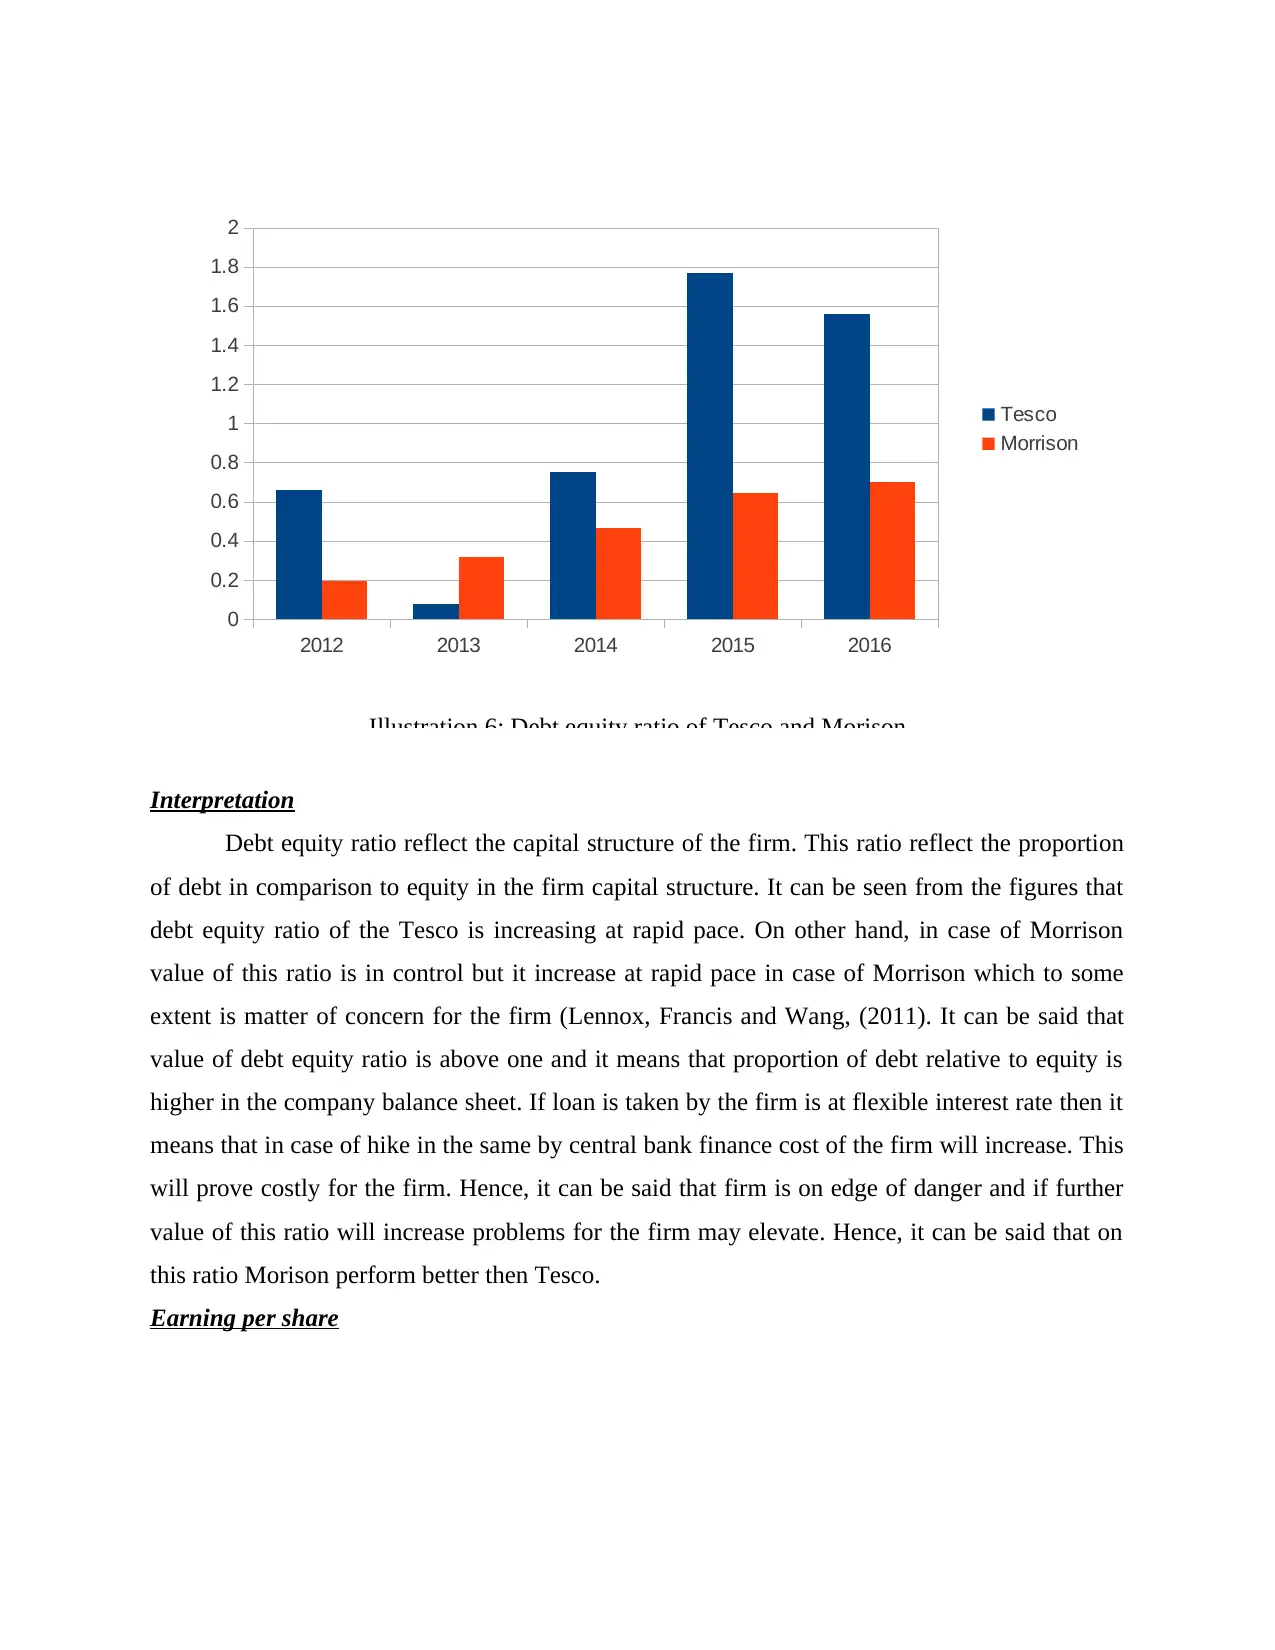
Debt equity ratio reflect the capital structure of the firm. This ratio reflect the proportion
of debt in comparison to equity in the firm capital structure. It can be seen from the figures that
debt equity ratio of the Tesco is increasing at rapid pace. On other hand, in case of Morrison
value of this ratio is in control but it increase at rapid pace in case of Morrison which to some
extent is matter of concern for the firm (Lennox, Francis and Wang, (2011). It can be said that
value of debt equity ratio is above one and it means that proportion of debt relative to equity is
higher in the company balance sheet. If loan is taken by the firm is at flexible interest rate then it
means that in case of hike in the same by central bank finance cost of the firm will increase. This
will prove costly for the firm. Hence, it can be said that firm is on edge of danger and if further
value of this ratio will increase problems for the firm may elevate. Hence, it can be said that on
this ratio Morison perform better then Tesco.
Earning per share
2012 2013 2014 2015 2016
0
0.2
0.4
0.6
0.8
1
1.2
1.4
1.6
1.8
2
Tesco
Morrison
Illustration 6: Debt equity ratio of Tesco and Morison
Interpretation
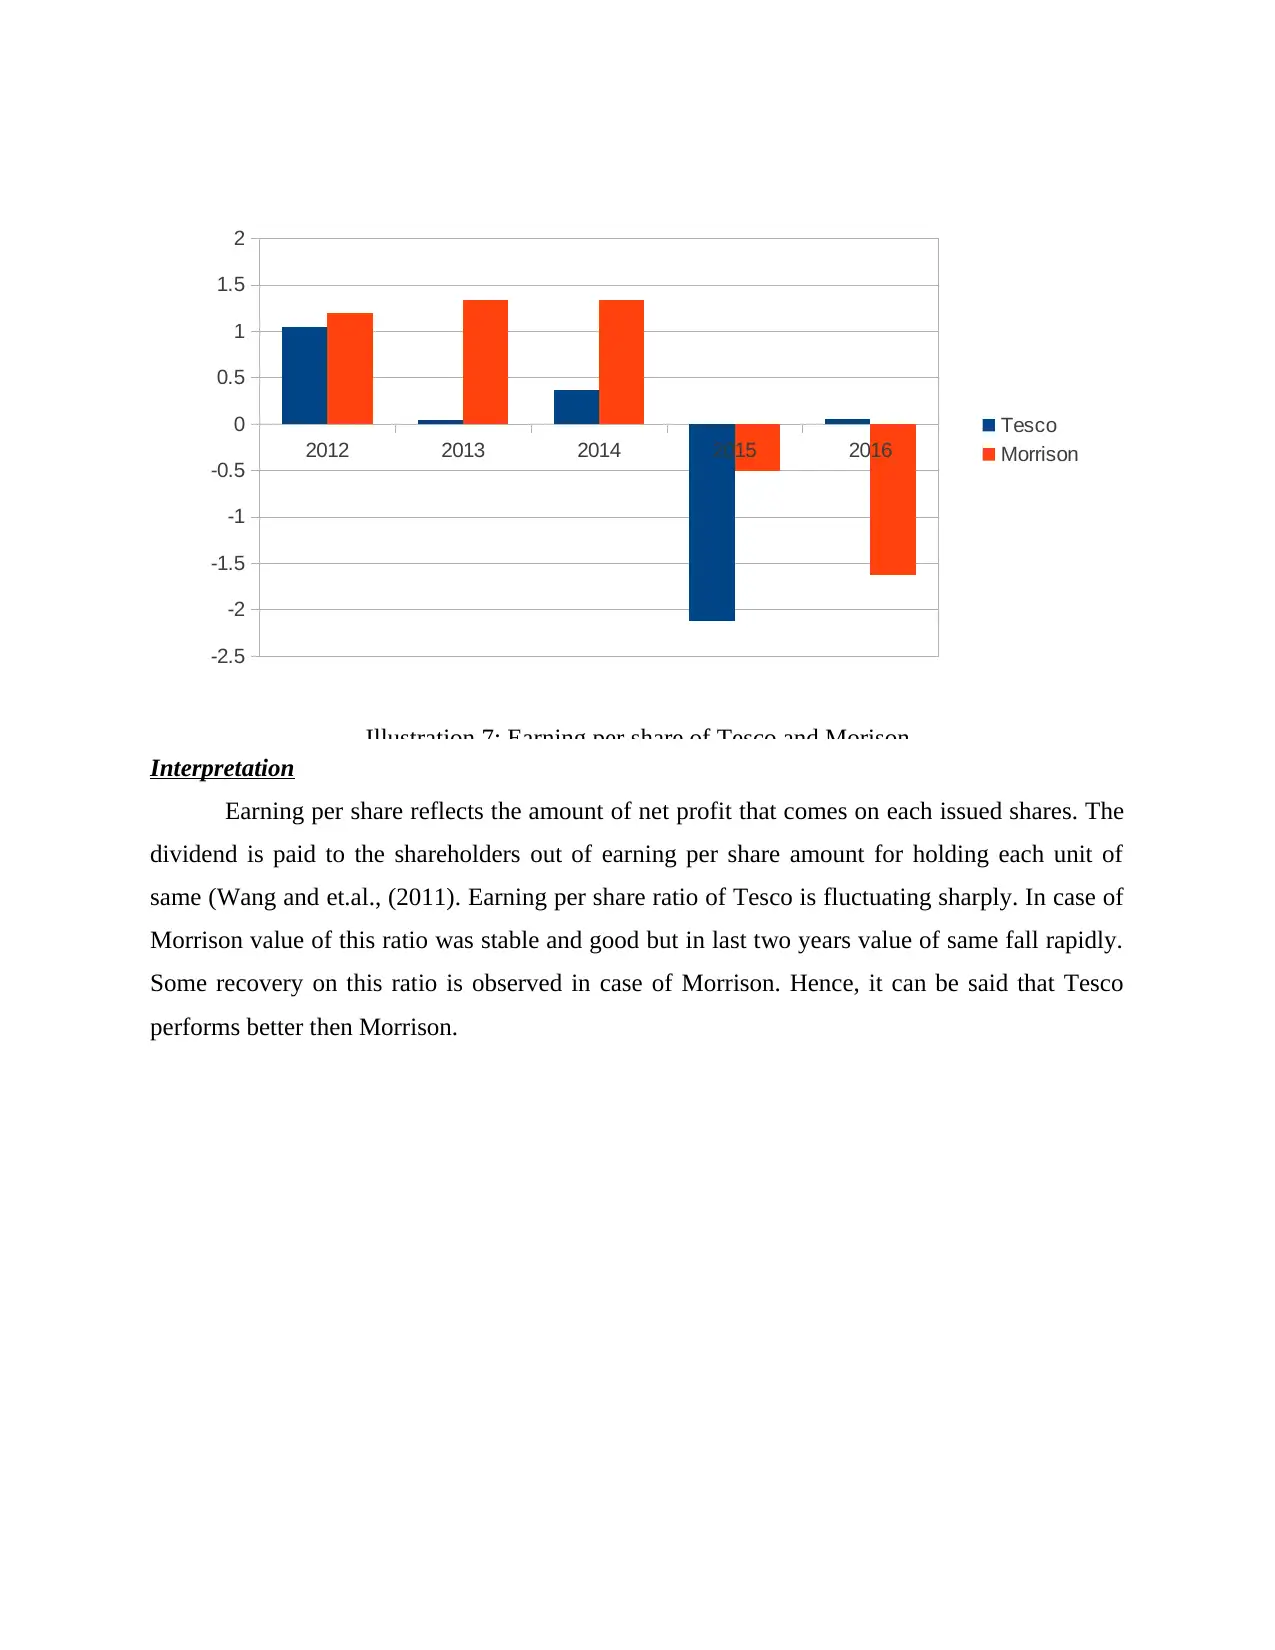
Earning per share reflects the amount of net profit that comes on each issued shares. The
dividend is paid to the shareholders out of earning per share amount for holding each unit of
same (Wang and et.al., (2011). Earning per share ratio of Tesco is fluctuating sharply. In case of
Morrison value of this ratio was stable and good but in last two years value of same fall rapidly.
Some recovery on this ratio is observed in case of Morrison. Hence, it can be said that Tesco
performs better then Morrison.
2012 2013 2014 2015 2016
-2.5
-2
-1.5
-1
-0.5
0
0.5
1
1.5
2
Tesco
Morrison
Illustration 7: Earning per share of Tesco and Morison
⊘ This is a preview!⊘
Do you want full access?
Subscribe today to unlock all pages.
Trusted by 1+ million students worldwide
1 out of 15
Related Documents


Your All-in-One AI-Powered Toolkit for Academic Success.
+13062052269
info@desklib.com
Available 24*7 on WhatsApp / Email
![[object Object]](/_next/static/media/star-bottom.7253800d.svg)
Unlock your academic potential
Copyright © 2020–2026 A2Z Services. All Rights Reserved. Developed and managed by ZUCOL.