Financial Analysis and Ratio Comparison: Tesco versus Walmart Report
VerifiedAdded on 2023/06/12
|17
|3899
|92
Report
AI Summary
This report provides a detailed financial analysis of Tesco and Walmart, focusing on ratio analysis over four years. It examines profitability, liquidity, gearing, efficiency, and investment ratios for both companies, highlighting their financial strengths and weaknesses. The report emphasizes the importance of working capital examination for decision-making, assessing the ability of each company to cover short-term debts and maintain operational solvency. Furthermore, it includes a critical evaluation of annual cash flow records, drawing conclusions about the financial health and market positioning of Tesco and Walmart. The analysis reveals Tesco's superior efficiency in debt management and overall working capacity compared to Walmart, suggesting it as a potentially more favorable investment option. The report concludes with recommendations for Walmart to improve its market performance and cash flow management. Desklib provides this and many other solved assignments for students.

FINANCIAL
ANALYSIS
MANAGEMENT AND
ENTERPRISE
ANALYSIS
MANAGEMENT AND
ENTERPRISE
Paraphrase This Document
Need a fresh take? Get an instant paraphrase of this document with our AI Paraphraser
Table of Contents
INTRODUCTION.................................................................................................................................................. 3
MAIN BODY........................................................................................................................................................ 3
1. RATIO ANALYSIS OF FINANCIAL RECORDS OF TESCO AND WALMART COMPANY FOR 4 YEARS...................................................3
2. STATE THE NECESSITY AND IMPORTANCE OF EXAMINATION OF WORKING CAPITAL FOR BOTH ORGANISATIONS BEFORE TAKING ANY
DECISIONS................................................................................................................................................................ 10
3. CRITICAL EVALUATION OF ANNUAL CASH FLOW RECORD OF BOTH FIRMS...........................................................................13
CONCLUSION.................................................................................................................................................... 14
REFERENCES..................................................................................................................................................................15
INTRODUCTION
The report prepared above takes in account examination and evaluation of two companies
i.e. Tesco and Walmart. It gives a detailed description related to computation of ratios, financial
records, statements of two organisation chosen (Abdulloevich, 2021). It states necessity towards
analysing the working capital before any decision-making process. It must also include a critical
assessment of cash flow on annual basis and search for evidences that would provide support
towards the arguments expressed. It displays an quality to measure business issues that are
complicated and complex in nature. It also provides recommendation and suggestions in an
autonomous way that rely on informed examination and critical assessment. The report prepared
takes in account calculation of liquidity ratios such as current ratio, quick ratio and in case of
profitability ratios gross profit, operating ratio, operating profit ratio and net profit ratio are
computed. It helps to understand the positioning and solvency of a business in competitive
environment. Assessment of working capital ratio and finding related cash flow generated in
related companies over a period of time helps to understand whether the business is sound or not.
It further serves as a base in decision making for investors and customers that are thinking of
investing in business.
MAIN BODY
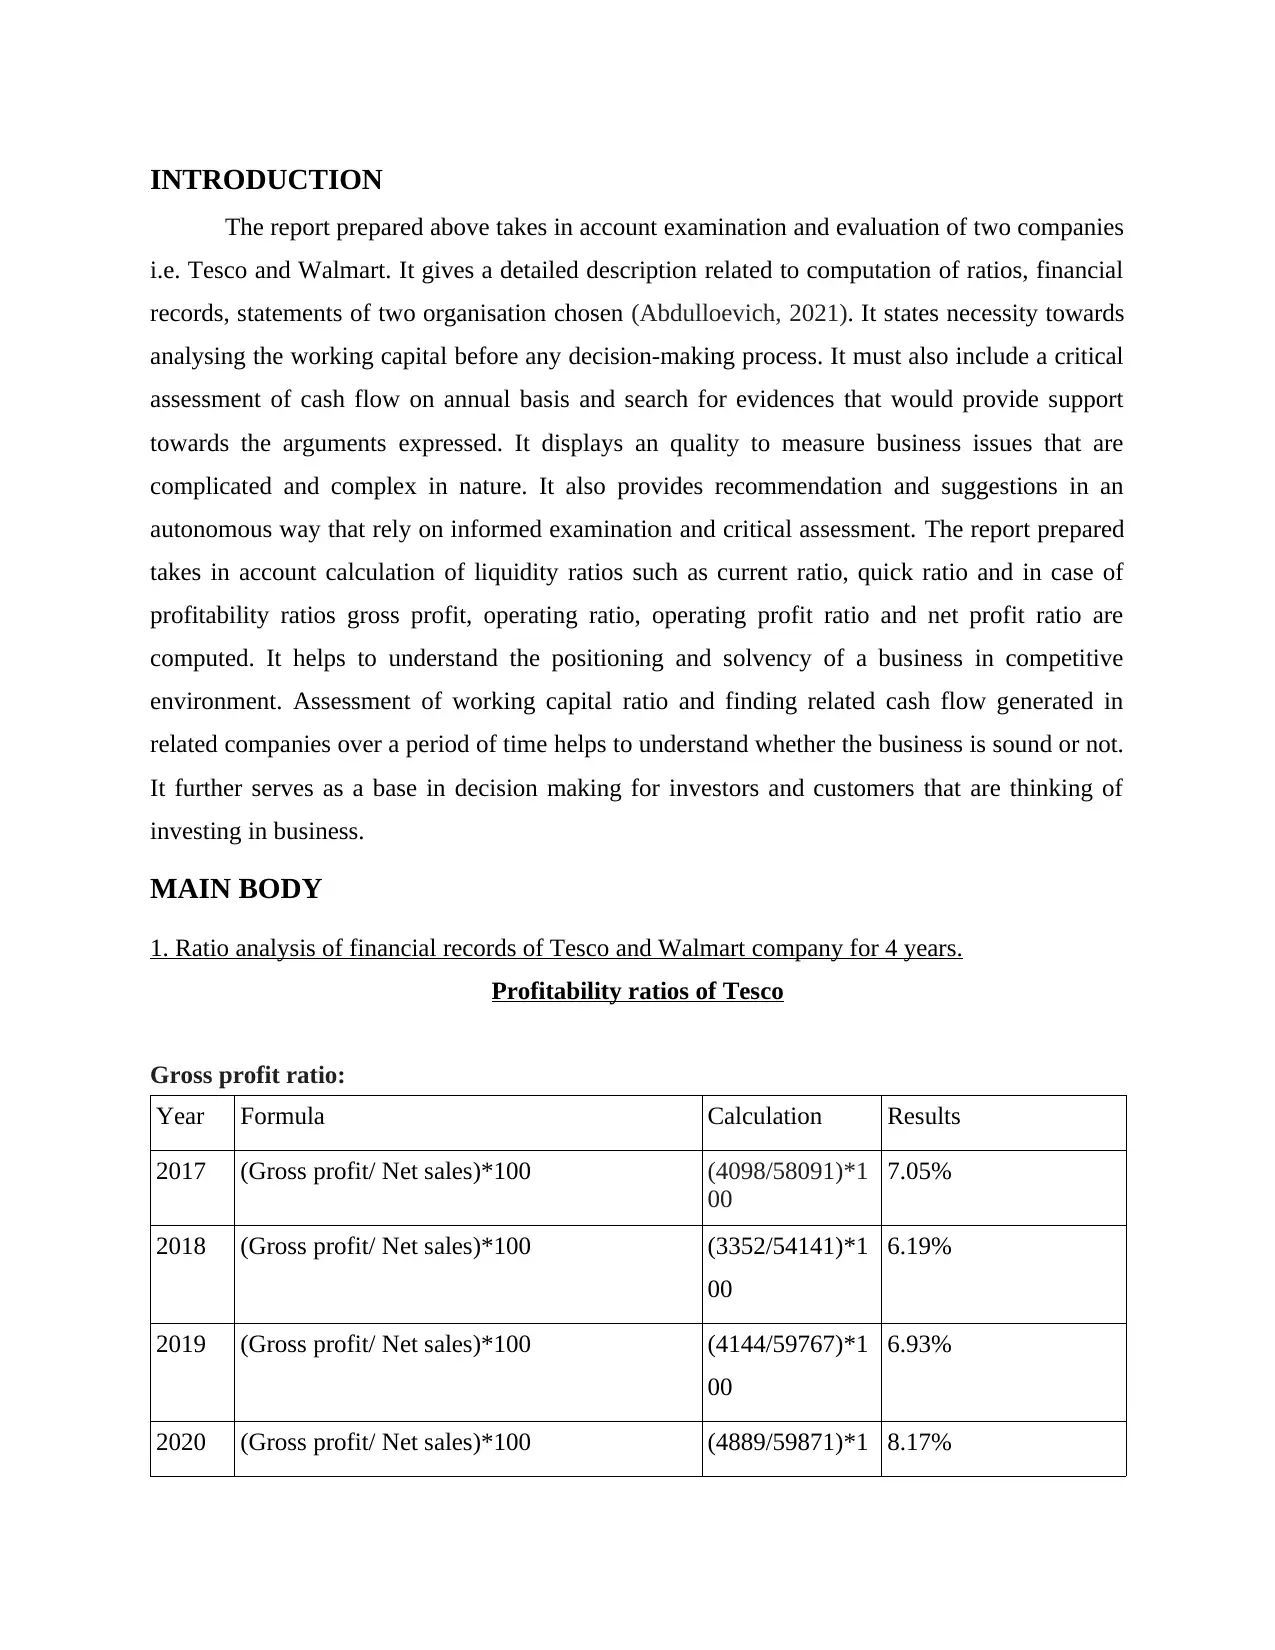
1. Ratio analysis of financial records of Tesco and Walmart company for 4 years.
Profitability ratios of Tesco
Gross profit ratio:
Year Formula Calculation Results
2017 (Gross profit/ Net sales)*100 (4098/58091)*1
00
7.05%
2018 (Gross profit/ Net sales)*100 (3352/54141)*1
00
6.19%
2019 (Gross profit/ Net sales)*100 (4144/59767)*1
00
6.93%
2020 (Gross profit/ Net sales)*100 (4889/59871)*1 8.17%
The report prepared above takes in account examination and evaluation of two companies
i.e. Tesco and Walmart. It gives a detailed description related to computation of ratios, financial
records, statements of two organisation chosen (Abdulloevich, 2021). It states necessity towards
analysing the working capital before any decision-making process. It must also include a critical
assessment of cash flow on annual basis and search for evidences that would provide support
towards the arguments expressed. It displays an quality to measure business issues that are
complicated and complex in nature. It also provides recommendation and suggestions in an
autonomous way that rely on informed examination and critical assessment. The report prepared
takes in account calculation of liquidity ratios such as current ratio, quick ratio and in case of
profitability ratios gross profit, operating ratio, operating profit ratio and net profit ratio are
computed. It helps to understand the positioning and solvency of a business in competitive
environment. Assessment of working capital ratio and finding related cash flow generated in
related companies over a period of time helps to understand whether the business is sound or not.
It further serves as a base in decision making for investors and customers that are thinking of
investing in business.
MAIN BODY
1. Ratio analysis of financial records of Tesco and Walmart company for 4 years.
Profitability ratios of Tesco
Gross profit ratio:
Year Formula Calculation Results
2017 (Gross profit/ Net sales)*100 (4098/58091)*1
00
7.05%
2018 (Gross profit/ Net sales)*100 (3352/54141)*1
00
6.19%
2019 (Gross profit/ Net sales)*100 (4144/59767)*1
00
6.93%
2020 (Gross profit/ Net sales)*100 (4889/59871)*1 8.17%
⊘ This is a preview!⊘
Do you want full access?
Subscribe today to unlock all pages.
Trusted by 1+ million students worldwide
00
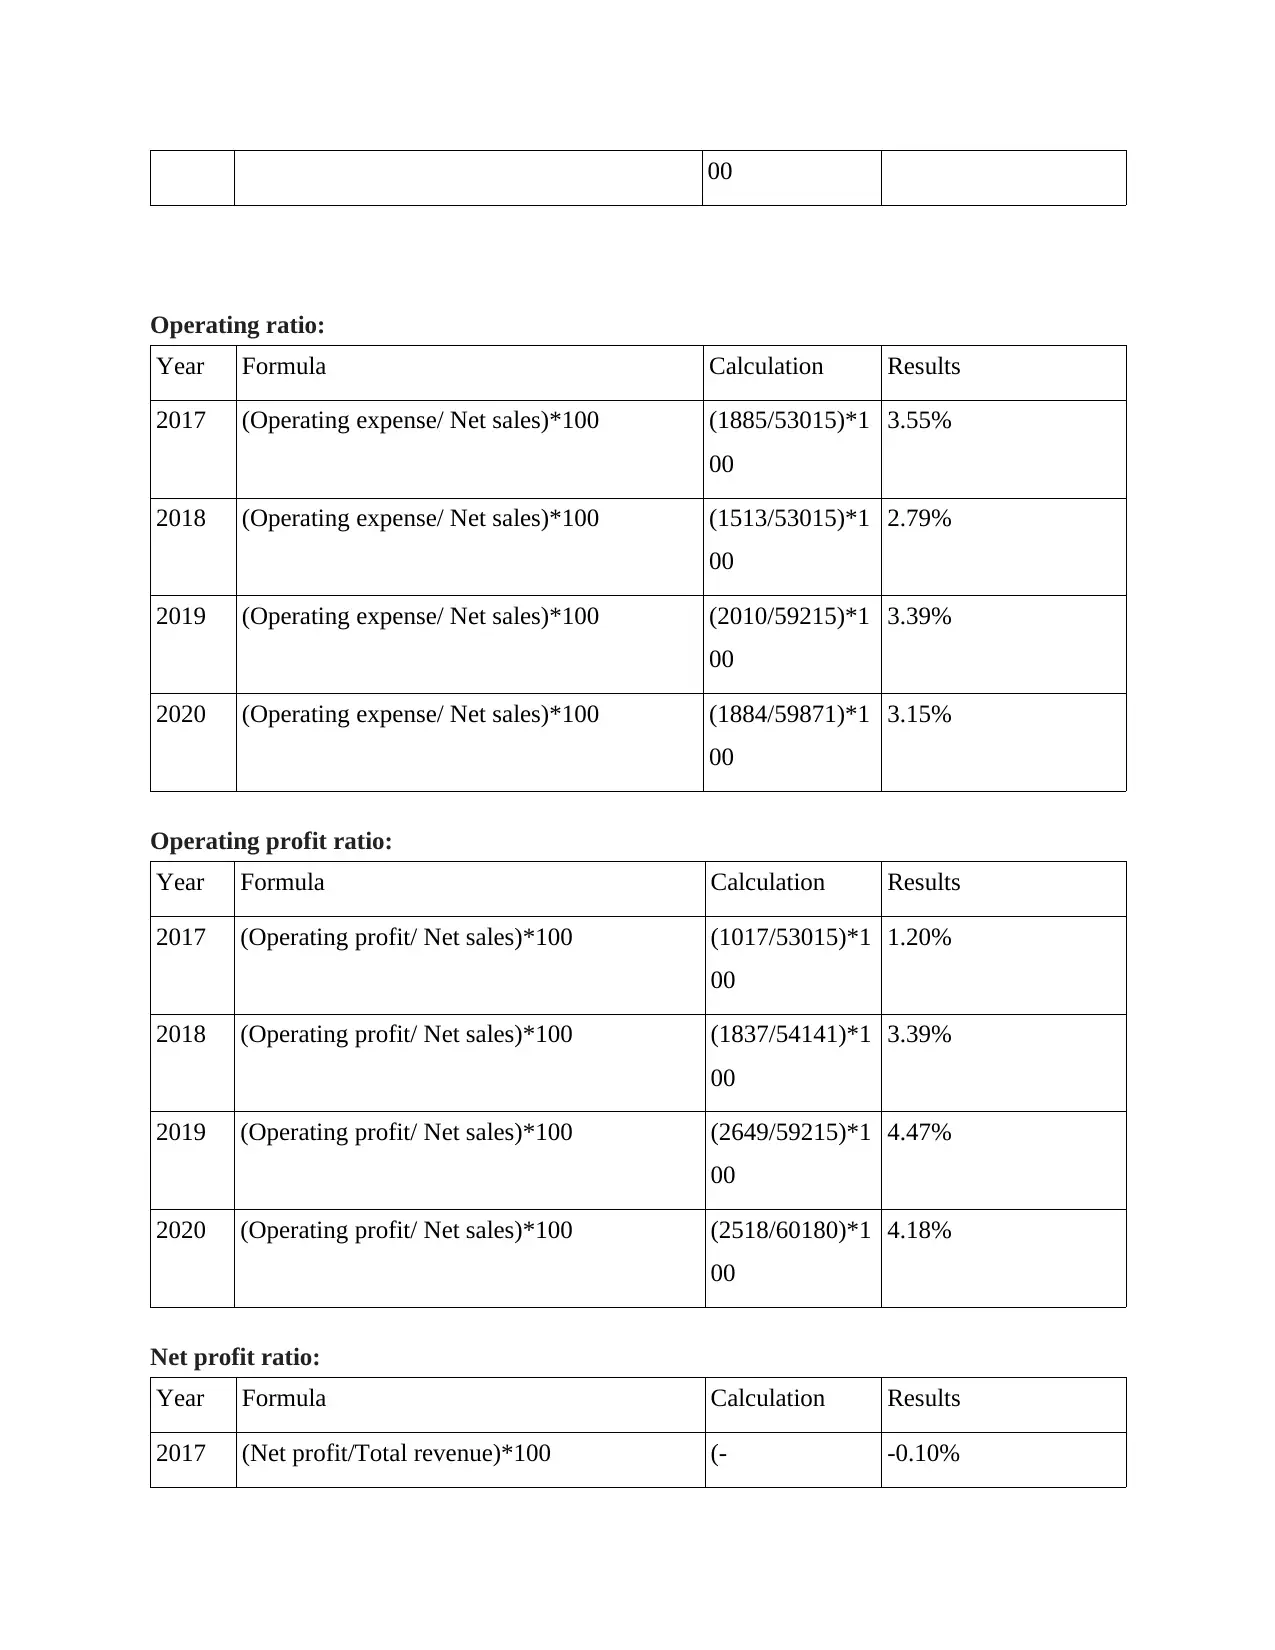
Operating ratio:
Year Formula Calculation Results
2017 (Operating expense/ Net sales)*100 (1885/53015)*1
00
3.55%
2018 (Operating expense/ Net sales)*100 (1513/53015)*1
00
2.79%
2019 (Operating expense/ Net sales)*100 (2010/59215)*1
00
3.39%
2020 (Operating expense/ Net sales)*100 (1884/59871)*1
00
3.15%
Operating profit ratio:
Year Formula Calculation Results
2017 (Operating profit/ Net sales)*100 (1017/53015)*1
00
1.20%
2018 (Operating profit/ Net sales)*100 (1837/54141)*1
00
3.39%
2019 (Operating profit/ Net sales)*100 (2649/59215)*1
00
4.47%
2020 (Operating profit/ Net sales)*100 (2518/60180)*1
00
4.18%
Net profit ratio:
Year Formula Calculation Results
2017 (Net profit/Total revenue)*100 (- -0.10%
Paraphrase This Document
Need a fresh take? Get an instant paraphrase of this document with our AI Paraphraser
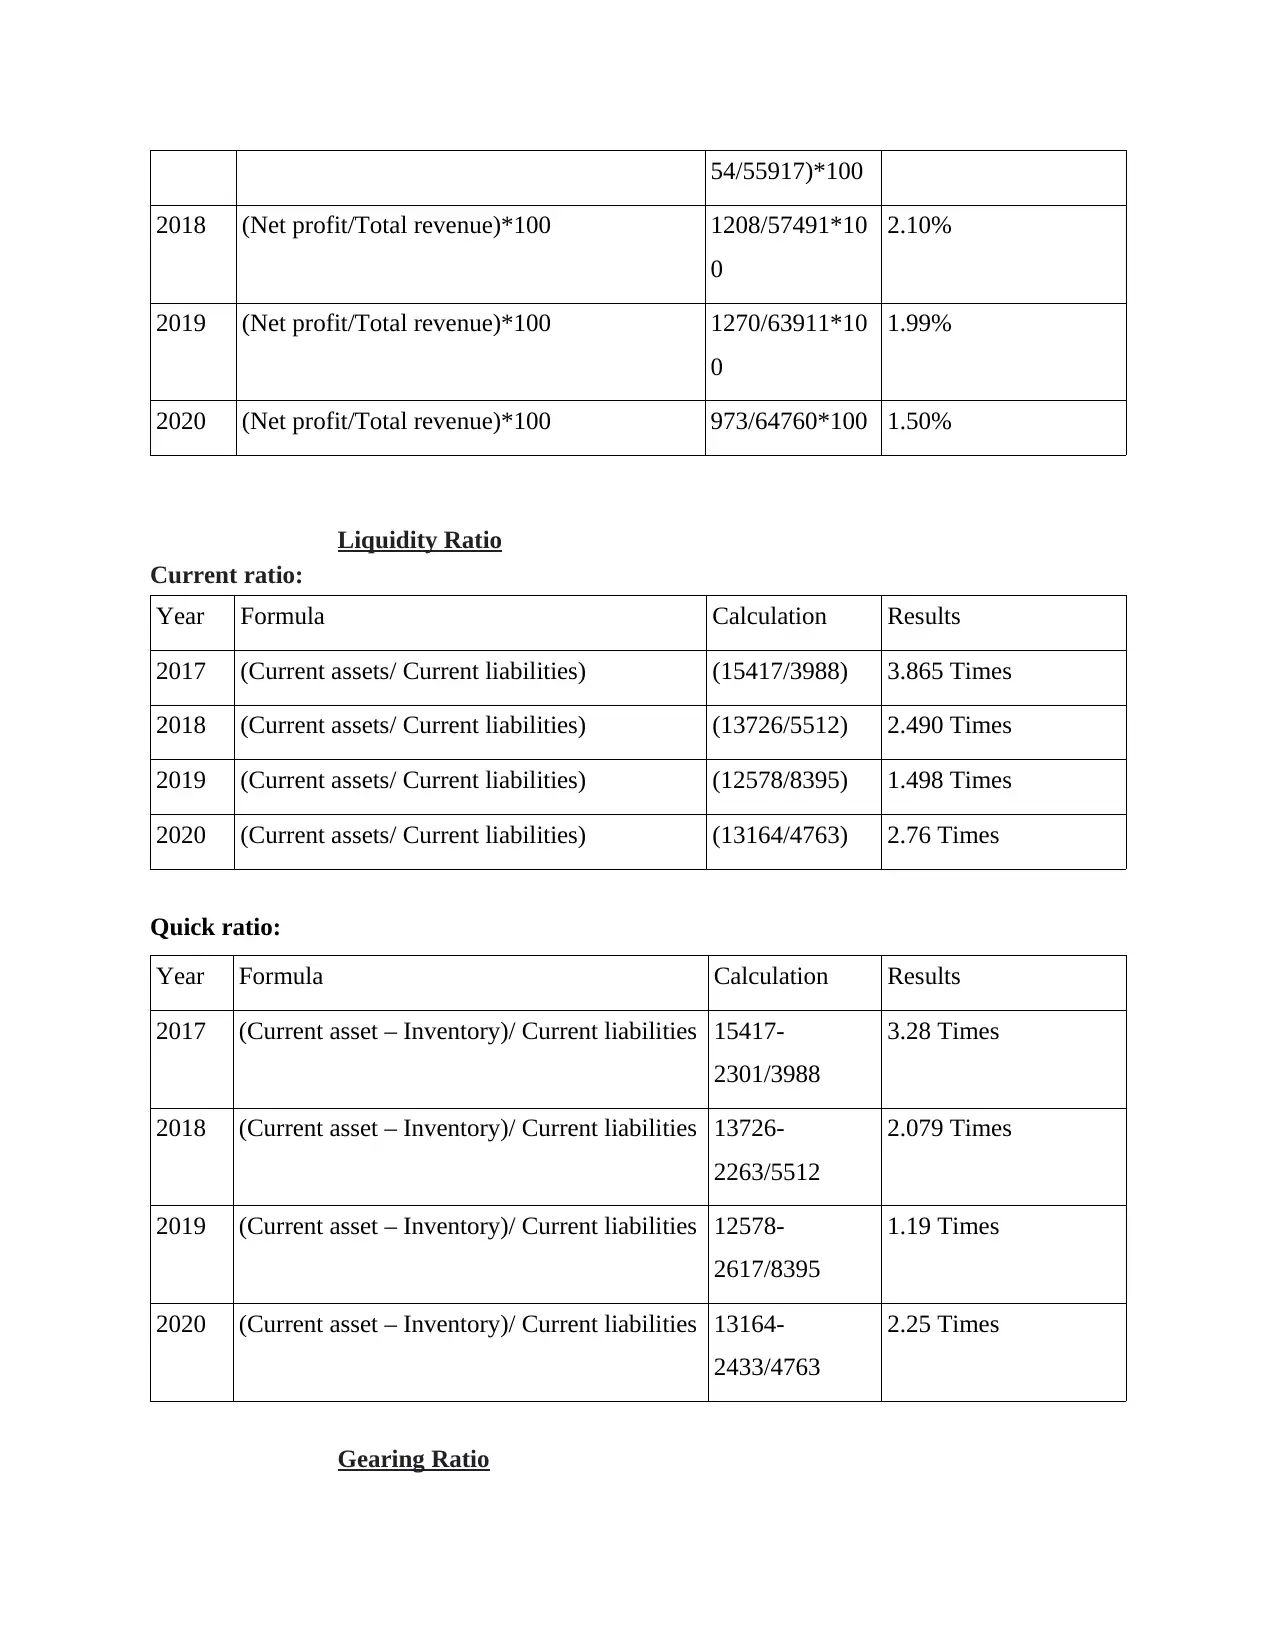
54/55917)*100
2018 (Net profit/Total revenue)*100 1208/57491*10
0
2.10%
2019 (Net profit/Total revenue)*100 1270/63911*10
0
1.99%
2020 (Net profit/Total revenue)*100 973/64760*100 1.50%
Liquidity Ratio
Current ratio:
Year Formula Calculation Results
2017 (Current assets/ Current liabilities) (15417/3988) 3.865 Times
2018 (Current assets/ Current liabilities) (13726/5512) 2.490 Times
2019 (Current assets/ Current liabilities) (12578/8395) 1.498 Times
2020 (Current assets/ Current liabilities) (13164/4763) 2.76 Times
Quick ratio:
Year Formula Calculation Results
2017 (Current asset – Inventory)/ Current liabilities 15417-
2301/3988
3.28 Times
2018 (Current asset – Inventory)/ Current liabilities 13726-
2263/5512
2.079 Times
2019 (Current asset – Inventory)/ Current liabilities 12578-
2617/8395
1.19 Times
2020 (Current asset – Inventory)/ Current liabilities 13164-
2433/4763
2.25 Times
Gearing Ratio
Debt equity ratio:
Year Formula Calculation Results
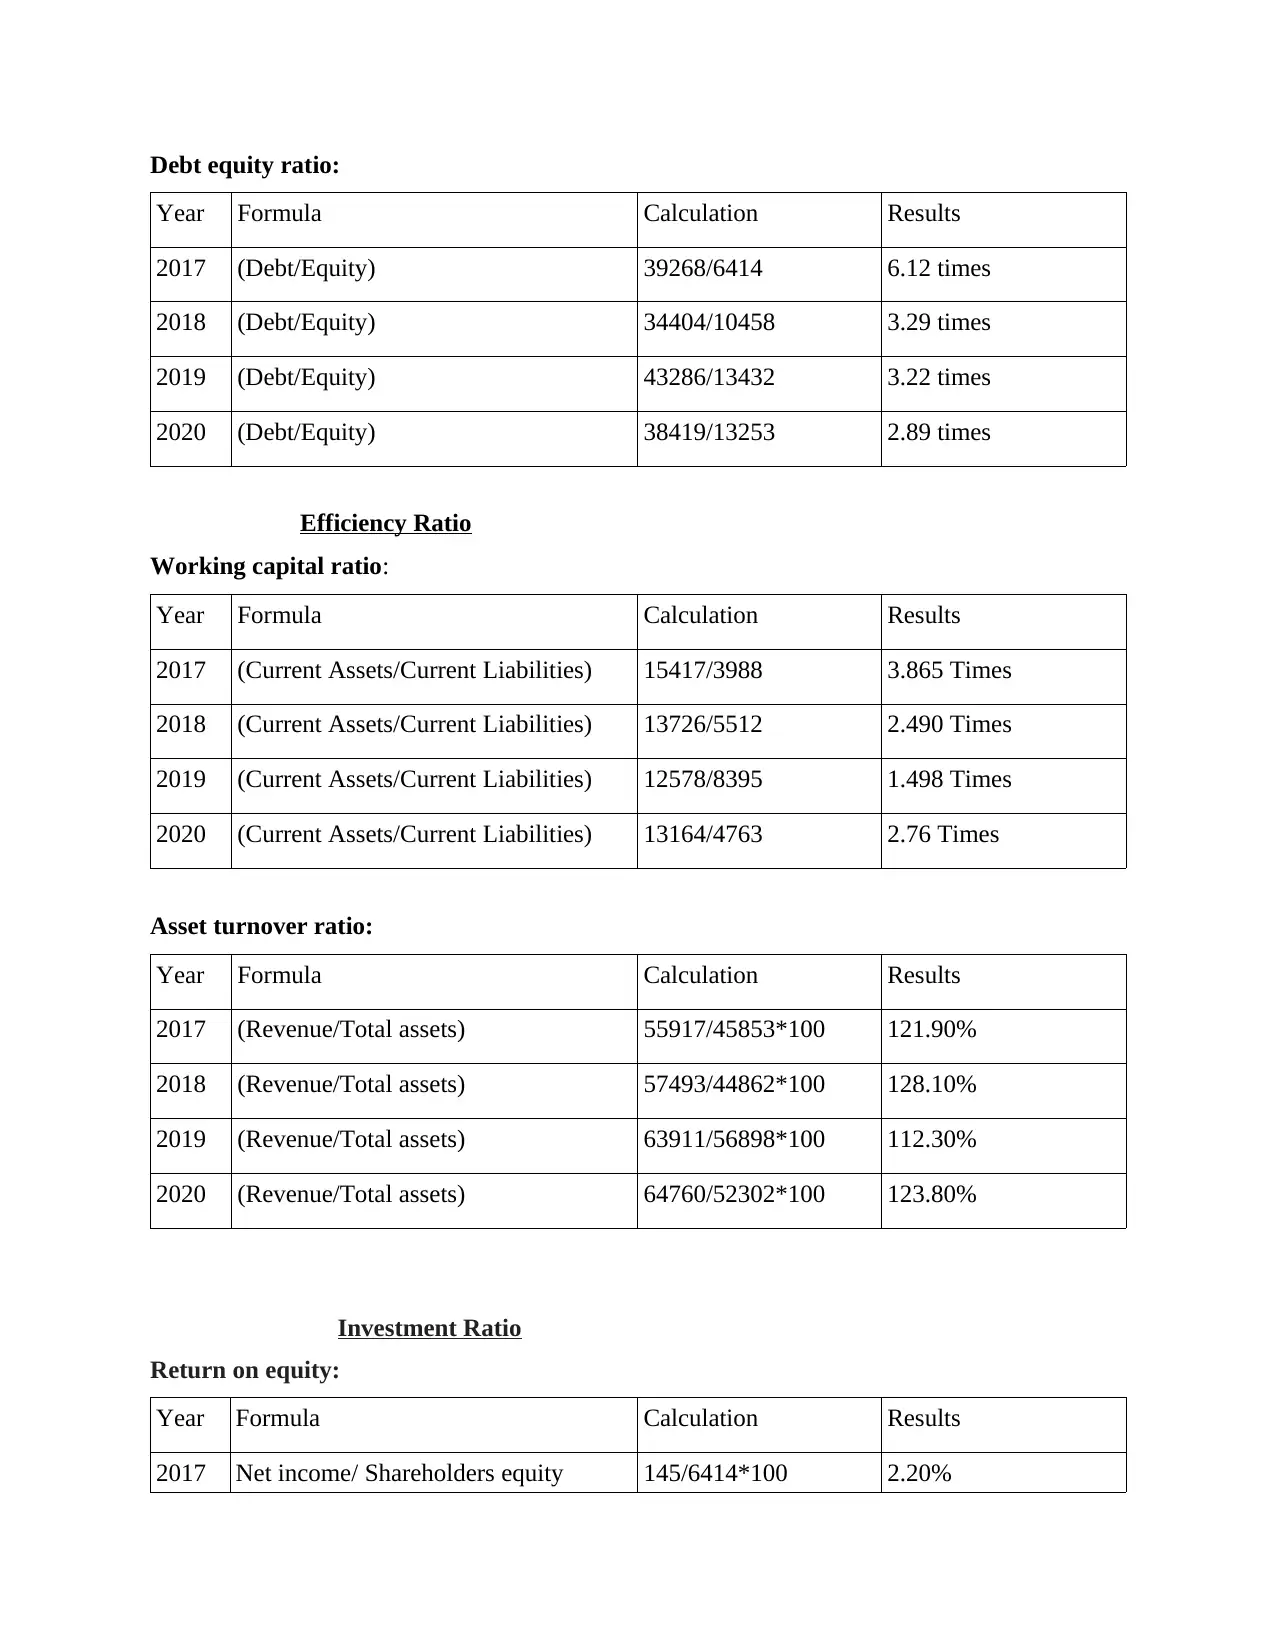
2017 (Debt/Equity) 39268/6414 6.12 times
2018 (Debt/Equity) 34404/10458 3.29 times
2019 (Debt/Equity) 43286/13432 3.22 times
2020 (Debt/Equity) 38419/13253 2.89 times
Efficiency Ratio
Working capital ratio:
Year Formula Calculation Results
2017 (Current Assets/Current Liabilities) 15417/3988 3.865 Times
2018 (Current Assets/Current Liabilities) 13726/5512 2.490 Times
2019 (Current Assets/Current Liabilities) 12578/8395 1.498 Times
2020 (Current Assets/Current Liabilities) 13164/4763 2.76 Times
Asset turnover ratio:
Year Formula Calculation Results
2017 (Revenue/Total assets) 55917/45853*100 121.90%
2018 (Revenue/Total assets) 57493/44862*100 128.10%
2019 (Revenue/Total assets) 63911/56898*100 112.30%
2020 (Revenue/Total assets) 64760/52302*100 123.80%
Investment Ratio
Return on equity:
Year Formula Calculation Results
2017 Net income/ Shareholders equity 145/6414*100 2.20%
Year Formula Calculation Results
2017 (Debt/Equity) 39268/6414 6.12 times
2018 (Debt/Equity) 34404/10458 3.29 times
2019 (Debt/Equity) 43286/13432 3.22 times
2020 (Debt/Equity) 38419/13253 2.89 times
Efficiency Ratio
Working capital ratio:
Year Formula Calculation Results
2017 (Current Assets/Current Liabilities) 15417/3988 3.865 Times
2018 (Current Assets/Current Liabilities) 13726/5512 2.490 Times
2019 (Current Assets/Current Liabilities) 12578/8395 1.498 Times
2020 (Current Assets/Current Liabilities) 13164/4763 2.76 Times
Asset turnover ratio:
Year Formula Calculation Results
2017 (Revenue/Total assets) 55917/45853*100 121.90%
2018 (Revenue/Total assets) 57493/44862*100 128.10%
2019 (Revenue/Total assets) 63911/56898*100 112.30%
2020 (Revenue/Total assets) 64760/52302*100 123.80%
Investment Ratio
Return on equity:
Year Formula Calculation Results
2017 Net income/ Shareholders equity 145/6414*100 2.20%
⊘ This is a preview!⊘
Do you want full access?
Subscribe today to unlock all pages.
Trusted by 1+ million students worldwide
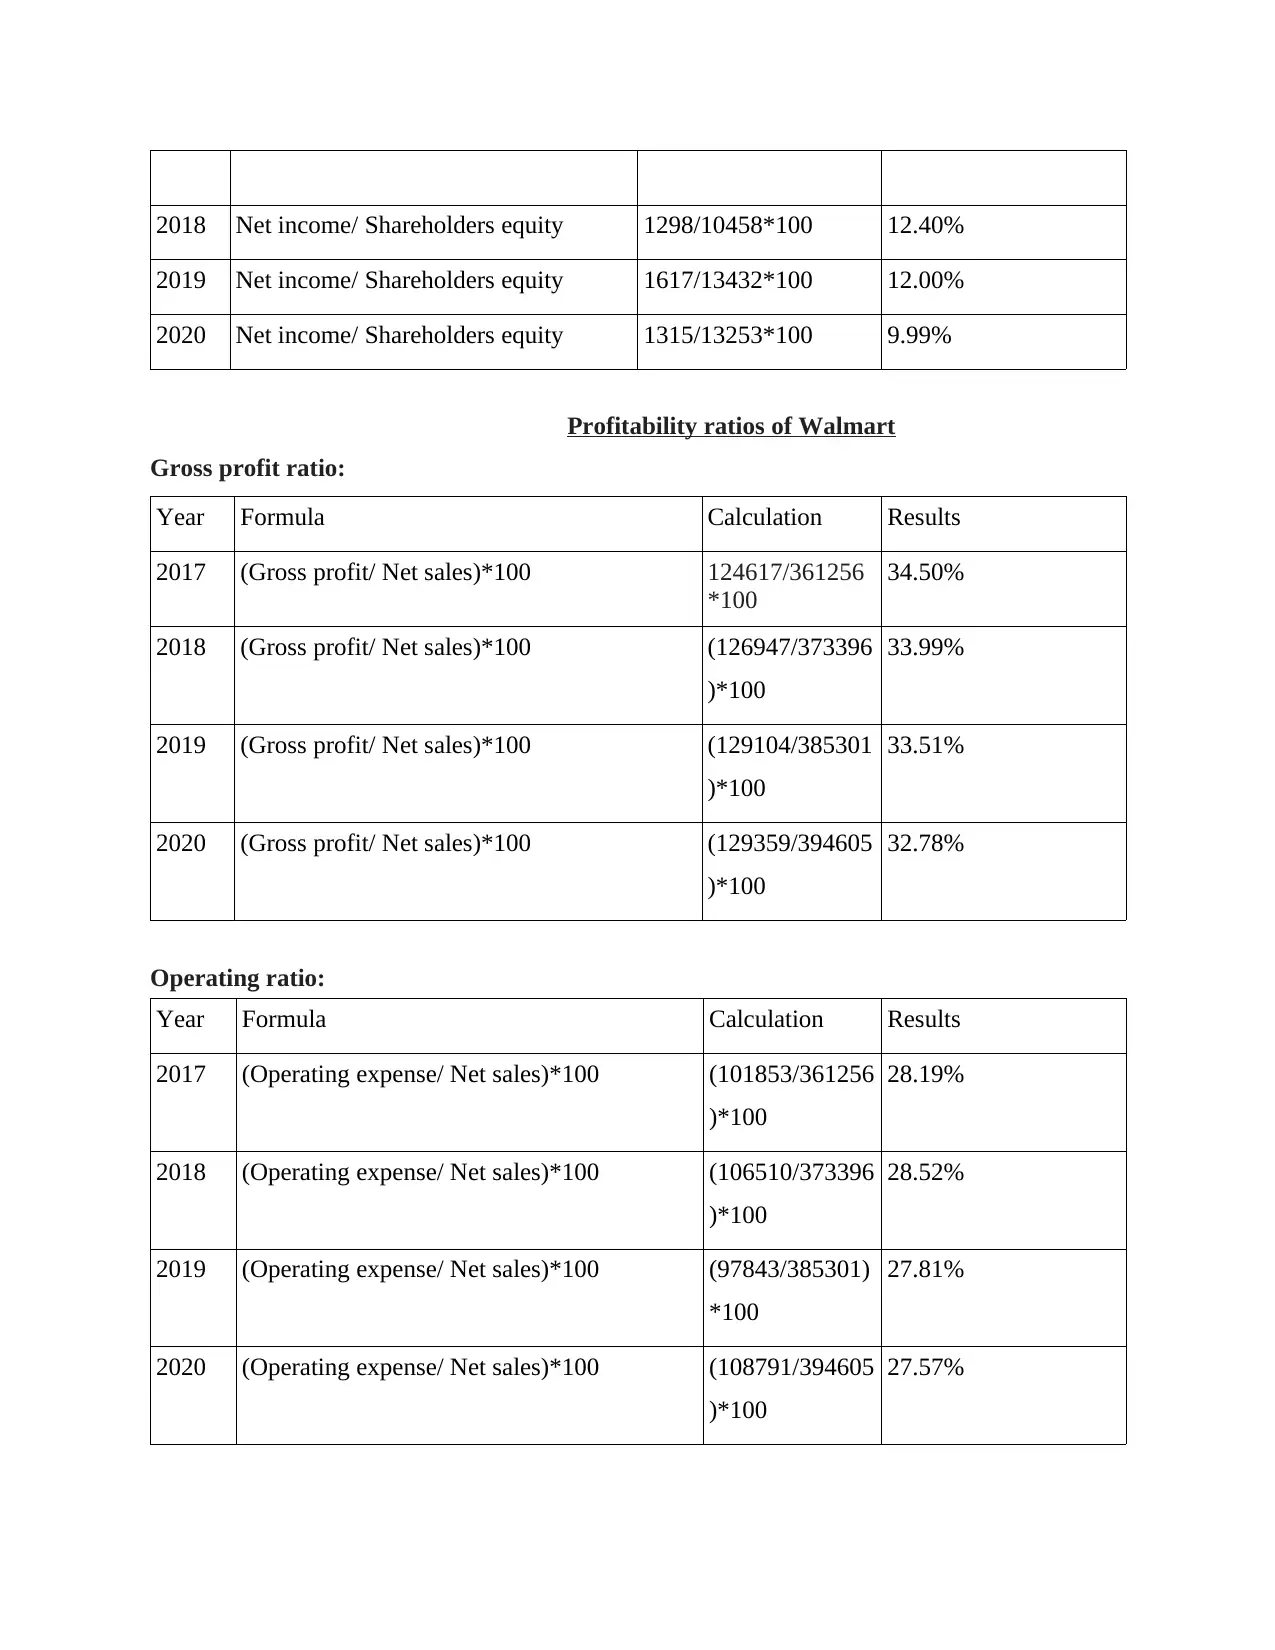
2018 Net income/ Shareholders equity 1298/10458*100 12.40%
2019 Net income/ Shareholders equity 1617/13432*100 12.00%
2020 Net income/ Shareholders equity 1315/13253*100 9.99%
Profitability ratios of Walmart
Gross profit ratio:
Year Formula Calculation Results
2017 (Gross profit/ Net sales)*100 124617/361256
*100
34.50%
2018 (Gross profit/ Net sales)*100 (126947/373396
)*100
33.99%
2019 (Gross profit/ Net sales)*100 (129104/385301
)*100
33.51%
2020 (Gross profit/ Net sales)*100 (129359/394605
)*100
32.78%
Operating ratio:
Year Formula Calculation Results
2017 (Operating expense/ Net sales)*100 (101853/361256
)*100
28.19%
2018 (Operating expense/ Net sales)*100 (106510/373396
)*100
28.52%
2019 (Operating expense/ Net sales)*100 (97843/385301)
*100
27.81%
2020 (Operating expense/ Net sales)*100 (108791/394605
)*100
27.57%
Paraphrase This Document
Need a fresh take? Get an instant paraphrase of this document with our AI Paraphraser
Net profit ratio:
Year Formula Calculation Results
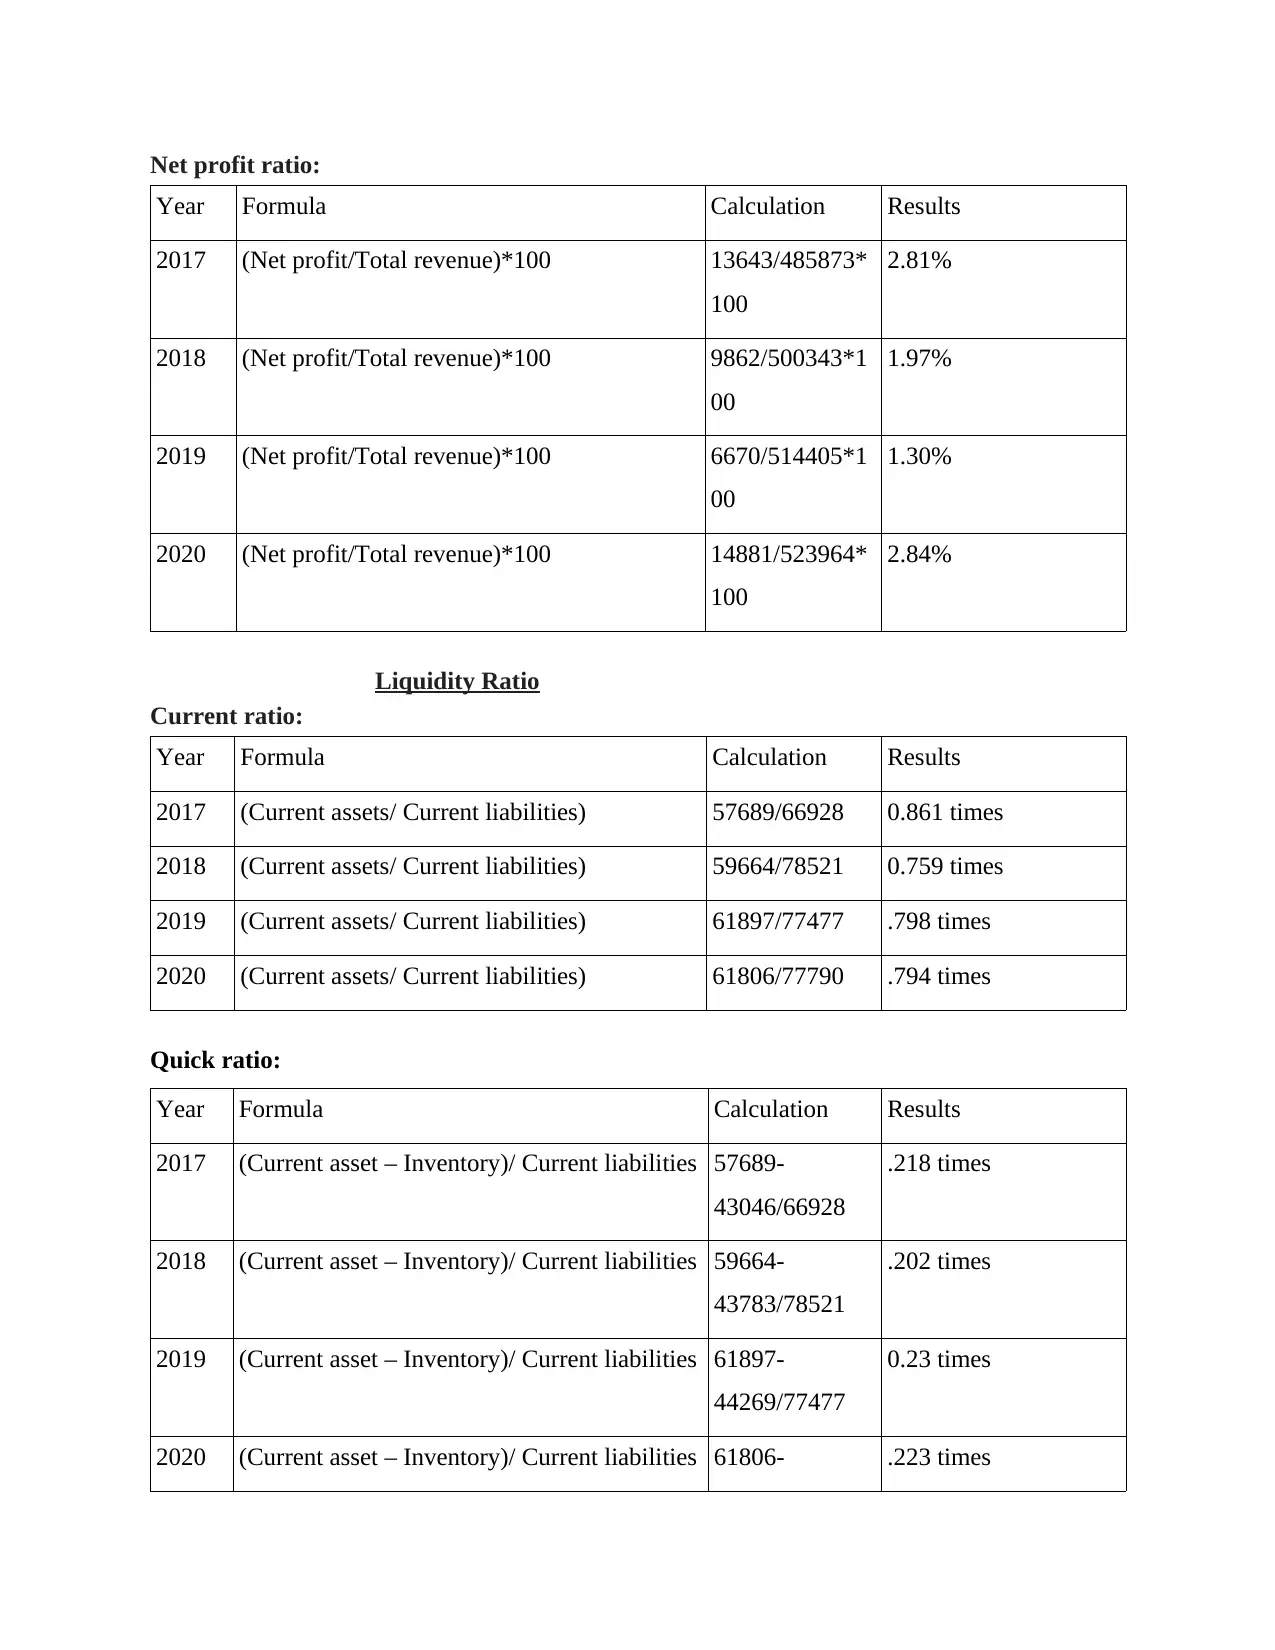
2017 (Net profit/Total revenue)*100 13643/485873*
100
2.81%
2018 (Net profit/Total revenue)*100 9862/500343*1
00
1.97%
2019 (Net profit/Total revenue)*100 6670/514405*1
00
1.30%
2020 (Net profit/Total revenue)*100 14881/523964*
100
2.84%
Liquidity Ratio
Current ratio:
Year Formula Calculation Results
2017 (Current assets/ Current liabilities) 57689/66928 0.861 times
2018 (Current assets/ Current liabilities) 59664/78521 0.759 times
2019 (Current assets/ Current liabilities) 61897/77477 .798 times
2020 (Current assets/ Current liabilities) 61806/77790 .794 times
Quick ratio:
Year Formula Calculation Results
2017 (Current asset – Inventory)/ Current liabilities 57689-
43046/66928
.218 times
2018 (Current asset – Inventory)/ Current liabilities 59664-
43783/78521
.202 times
2019 (Current asset – Inventory)/ Current liabilities 61897-
44269/77477
0.23 times
2020 (Current asset – Inventory)/ Current liabilities 61806- .223 times
Year Formula Calculation Results
2017 (Net profit/Total revenue)*100 13643/485873*
100
2.81%
2018 (Net profit/Total revenue)*100 9862/500343*1
00
1.97%
2019 (Net profit/Total revenue)*100 6670/514405*1
00
1.30%
2020 (Net profit/Total revenue)*100 14881/523964*
100
2.84%
Liquidity Ratio
Current ratio:
Year Formula Calculation Results
2017 (Current assets/ Current liabilities) 57689/66928 0.861 times
2018 (Current assets/ Current liabilities) 59664/78521 0.759 times
2019 (Current assets/ Current liabilities) 61897/77477 .798 times
2020 (Current assets/ Current liabilities) 61806/77790 .794 times
Quick ratio:
Year Formula Calculation Results
2017 (Current asset – Inventory)/ Current liabilities 57689-
43046/66928
.218 times
2018 (Current asset – Inventory)/ Current liabilities 59664-
43783/78521
.202 times
2019 (Current asset – Inventory)/ Current liabilities 61897-
44269/77477
0.23 times
2020 (Current asset – Inventory)/ Current liabilities 61806- .223 times
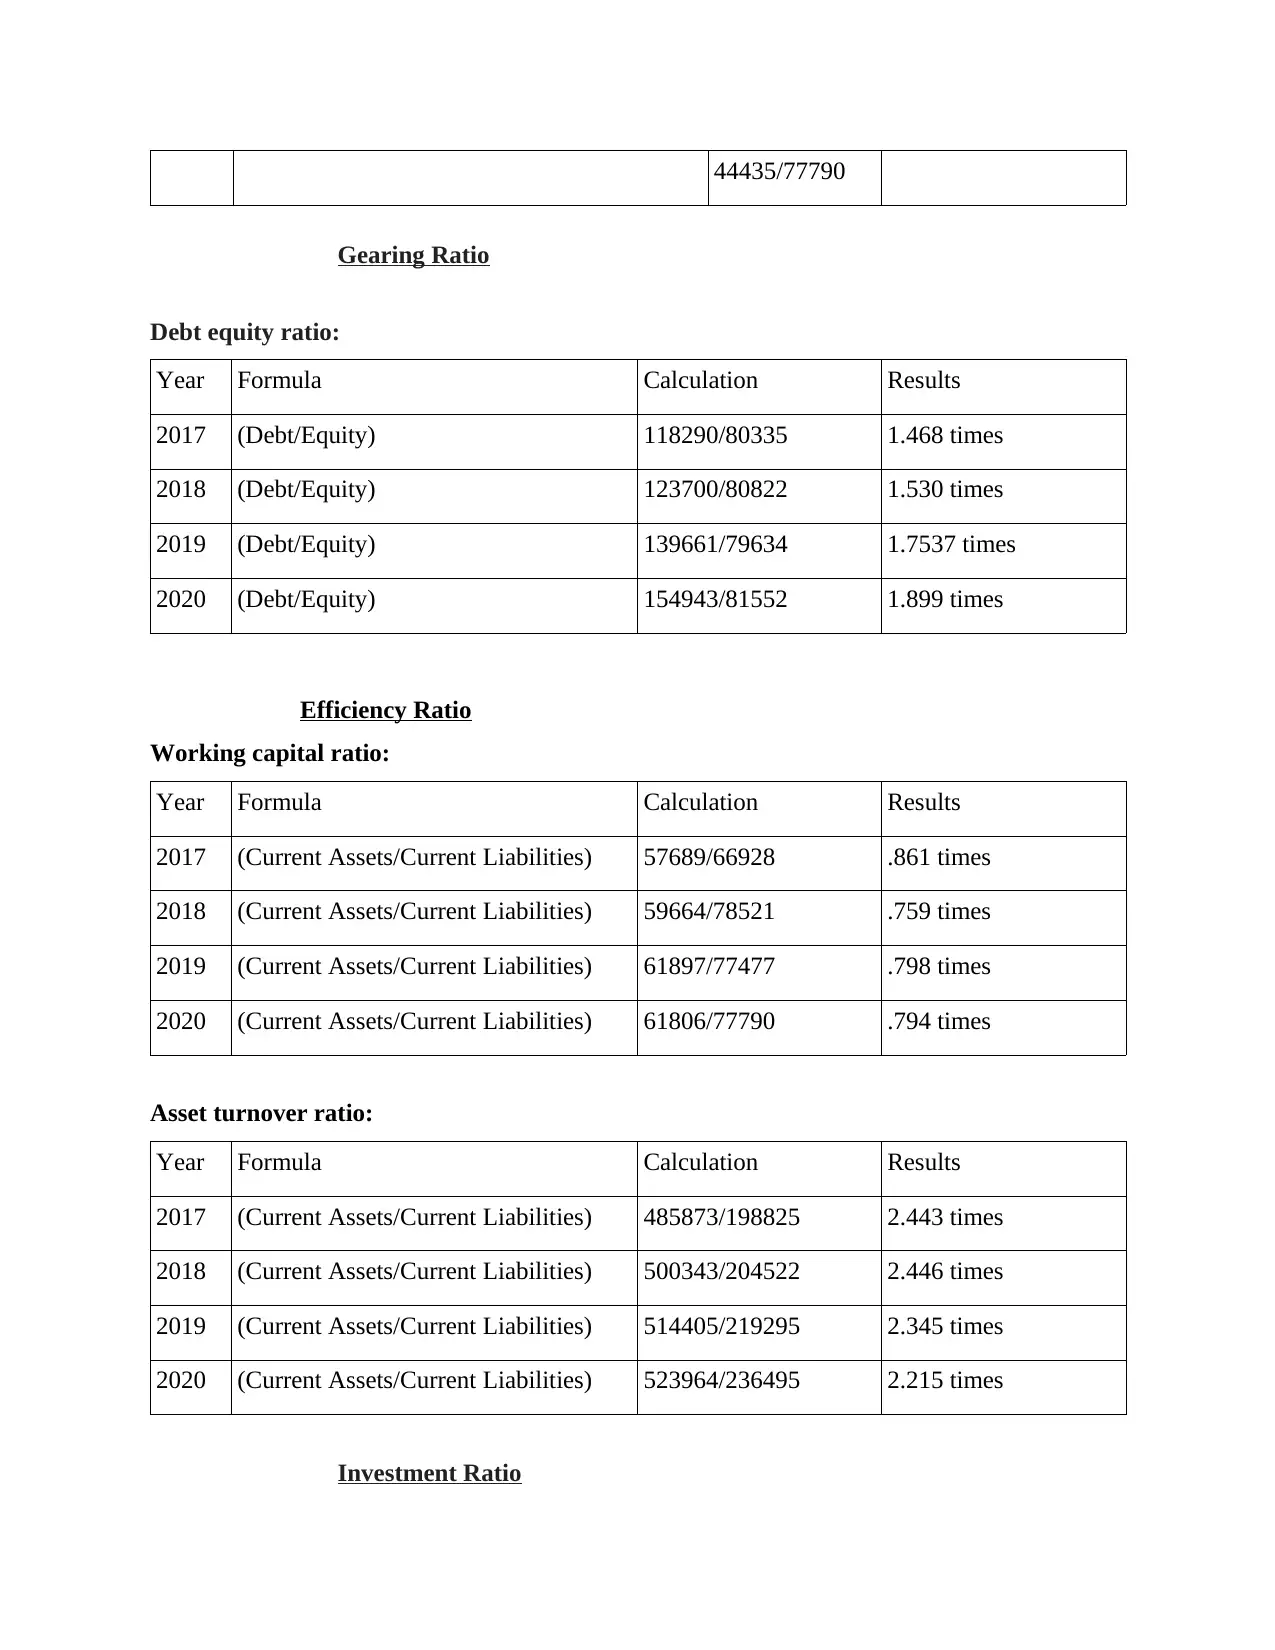
44435/77790
Gearing Ratio
Debt equity ratio:
Year Formula Calculation Results
2017 (Debt/Equity) 118290/80335 1.468 times
2018 (Debt/Equity) 123700/80822 1.530 times
2019 (Debt/Equity) 139661/79634 1.7537 times
2020 (Debt/Equity) 154943/81552 1.899 times
Efficiency Ratio
Working capital ratio:
Year Formula Calculation Results
2017 (Current Assets/Current Liabilities) 57689/66928 .861 times
2018 (Current Assets/Current Liabilities) 59664/78521 .759 times
2019 (Current Assets/Current Liabilities) 61897/77477 .798 times
2020 (Current Assets/Current Liabilities) 61806/77790 .794 times
Asset turnover ratio:
Year Formula Calculation Results
2017 (Current Assets/Current Liabilities) 485873/198825 2.443 times
2018 (Current Assets/Current Liabilities) 500343/204522 2.446 times
2019 (Current Assets/Current Liabilities) 514405/219295 2.345 times
2020 (Current Assets/Current Liabilities) 523964/236495 2.215 times
Investment Ratio
⊘ This is a preview!⊘
Do you want full access?
Subscribe today to unlock all pages.
Trusted by 1+ million students worldwide
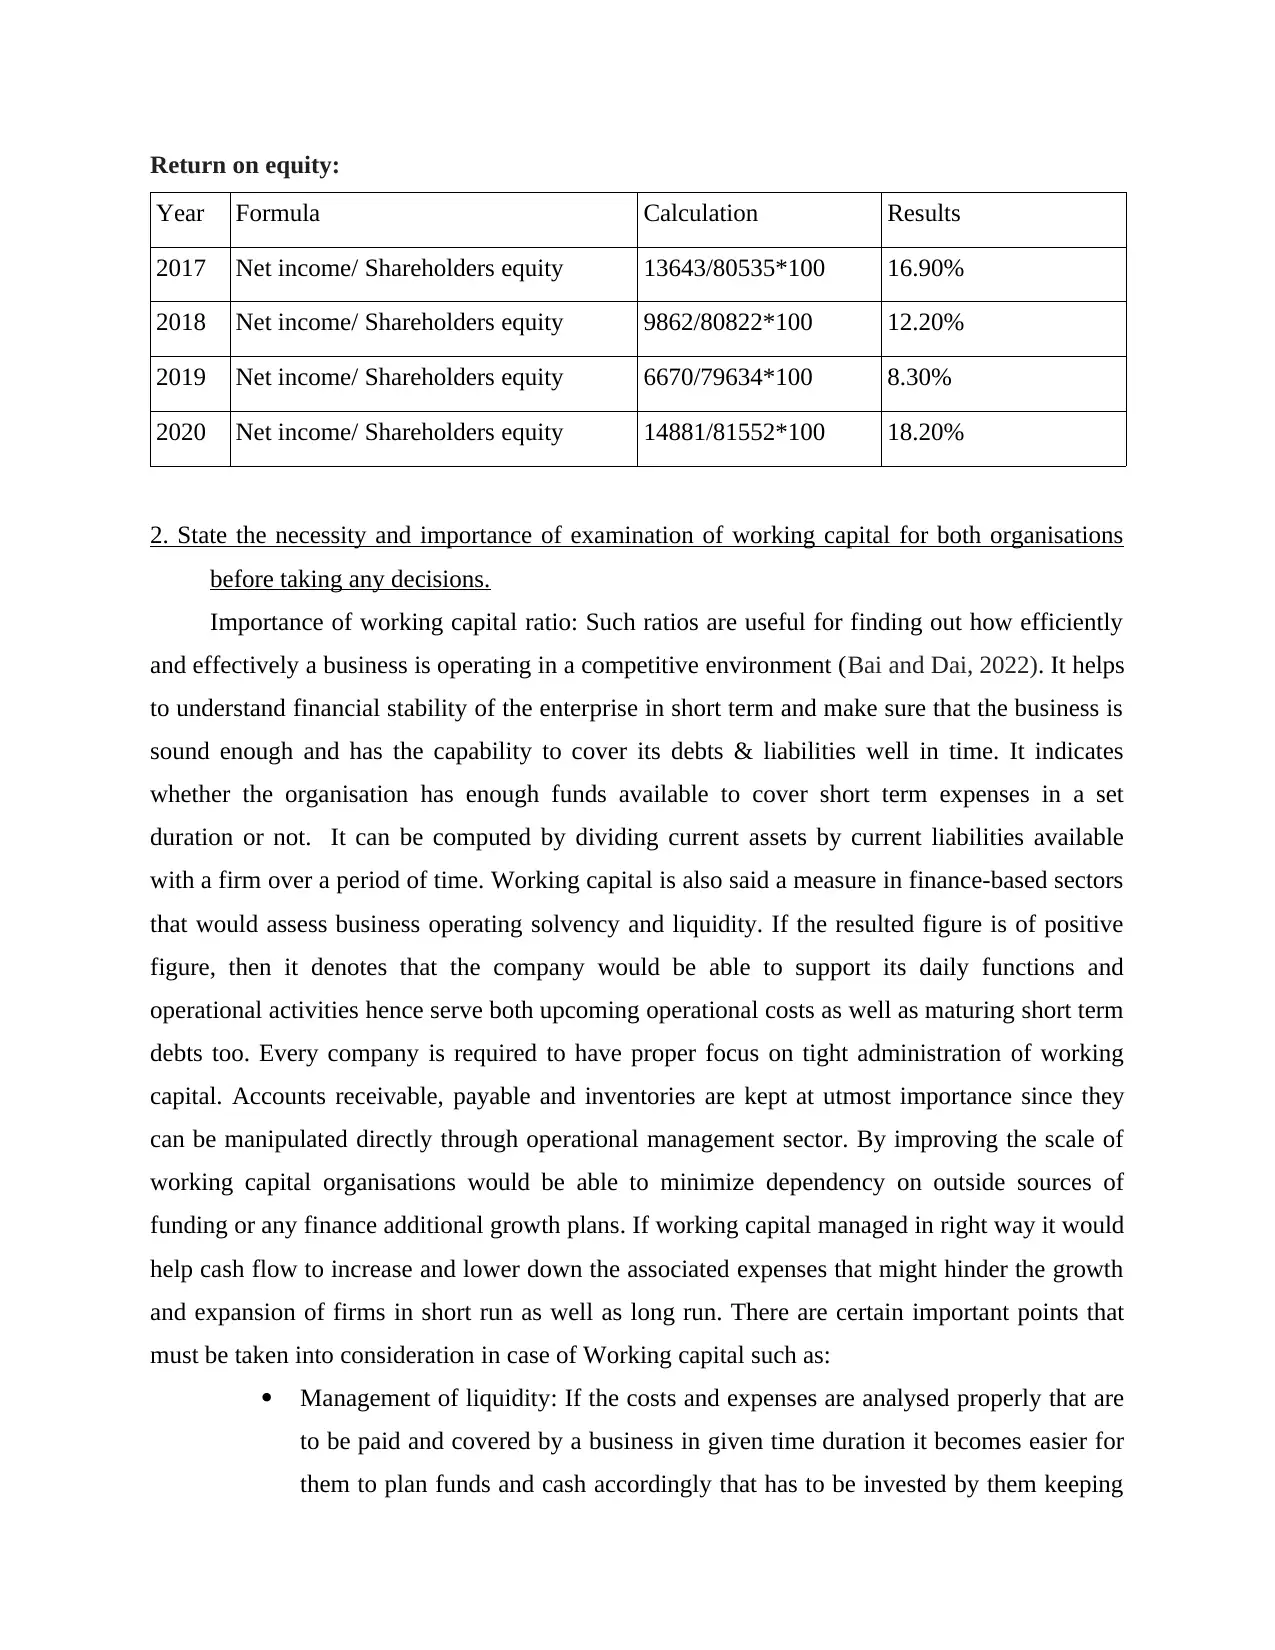
Return on equity:
Year Formula Calculation Results
2017 Net income/ Shareholders equity 13643/80535*100 16.90%
2018 Net income/ Shareholders equity 9862/80822*100 12.20%
2019 Net income/ Shareholders equity 6670/79634*100 8.30%
2020 Net income/ Shareholders equity 14881/81552*100 18.20%
2. State the necessity and importance of examination of working capital for both organisations
before taking any decisions.
Importance of working capital ratio: Such ratios are useful for finding out how efficiently
and effectively a business is operating in a competitive environment (Bai and Dai, 2022). It helps
to understand financial stability of the enterprise in short term and make sure that the business is
sound enough and has the capability to cover its debts & liabilities well in time. It indicates
whether the organisation has enough funds available to cover short term expenses in a set
duration or not. It can be computed by dividing current assets by current liabilities available
with a firm over a period of time. Working capital is also said a measure in finance-based sectors
that would assess business operating solvency and liquidity. If the resulted figure is of positive
figure, then it denotes that the company would be able to support its daily functions and
operational activities hence serve both upcoming operational costs as well as maturing short term
debts too. Every company is required to have proper focus on tight administration of working
capital. Accounts receivable, payable and inventories are kept at utmost importance since they
can be manipulated directly through operational management sector. By improving the scale of
working capital organisations would be able to minimize dependency on outside sources of
funding or any finance additional growth plans. If working capital managed in right way it would
help cash flow to increase and lower down the associated expenses that might hinder the growth
and expansion of firms in short run as well as long run. There are certain important points that
must be taken into consideration in case of Working capital such as:
Management of liquidity: If the costs and expenses are analysed properly that are
to be paid and covered by a business in given time duration it becomes easier for
them to plan funds and cash accordingly that has to be invested by them keeping
Paraphrase This Document
Need a fresh take? Get an instant paraphrase of this document with our AI Paraphraser
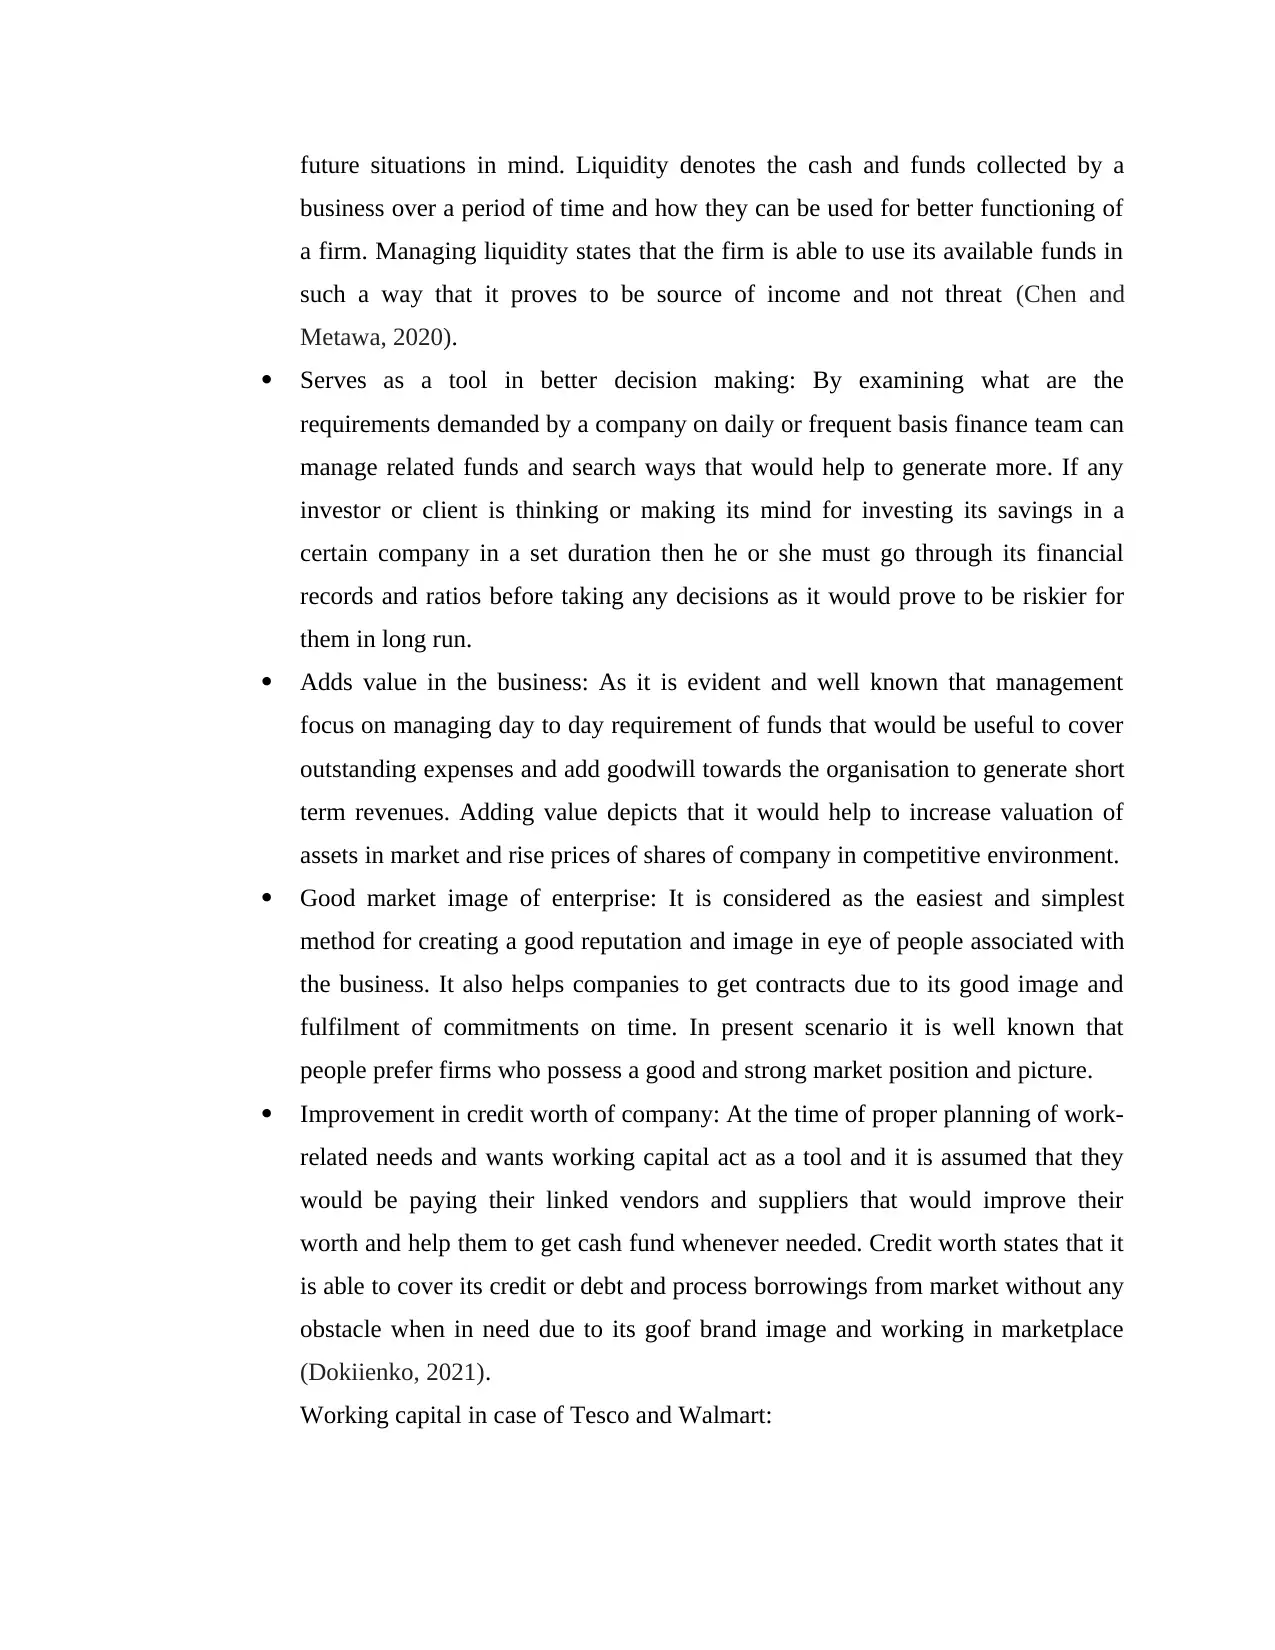
future situations in mind. Liquidity denotes the cash and funds collected by a
business over a period of time and how they can be used for better functioning of
a firm. Managing liquidity states that the firm is able to use its available funds in
such a way that it proves to be source of income and not threat (Chen and
Metawa, 2020).
Serves as a tool in better decision making: By examining what are the
requirements demanded by a company on daily or frequent basis finance team can
manage related funds and search ways that would help to generate more. If any
investor or client is thinking or making its mind for investing its savings in a
certain company in a set duration then he or she must go through its financial
records and ratios before taking any decisions as it would prove to be riskier for
them in long run.
Adds value in the business: As it is evident and well known that management
focus on managing day to day requirement of funds that would be useful to cover
outstanding expenses and add goodwill towards the organisation to generate short
term revenues. Adding value depicts that it would help to increase valuation of
assets in market and rise prices of shares of company in competitive environment.
Good market image of enterprise: It is considered as the easiest and simplest
method for creating a good reputation and image in eye of people associated with
the business. It also helps companies to get contracts due to its good image and
fulfilment of commitments on time. In present scenario it is well known that
people prefer firms who possess a good and strong market position and picture.
Improvement in credit worth of company: At the time of proper planning of work-
related needs and wants working capital act as a tool and it is assumed that they
would be paying their linked vendors and suppliers that would improve their
worth and help them to get cash fund whenever needed. Credit worth states that it
is able to cover its credit or debt and process borrowings from market without any
obstacle when in need due to its goof brand image and working in marketplace
(Dokiienko, 2021).
Working capital in case of Tesco and Walmart:
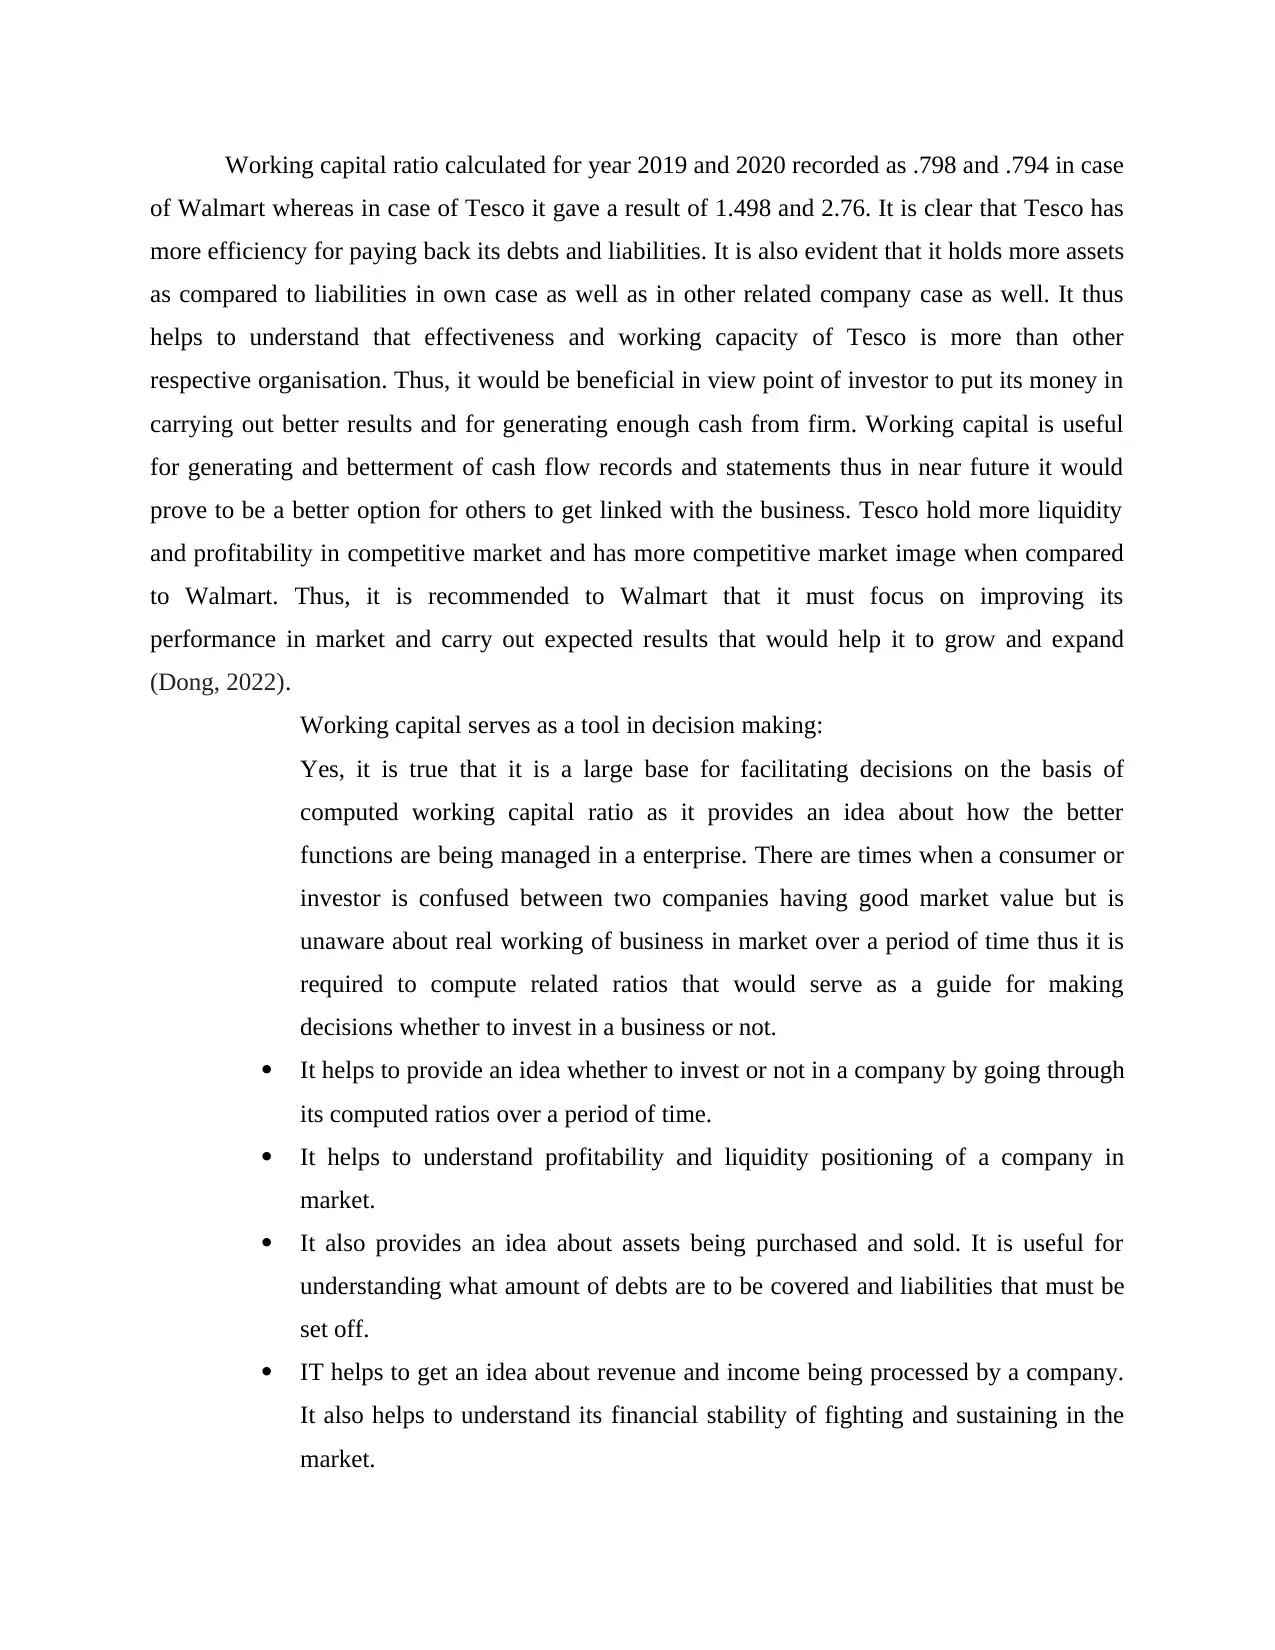
Working capital ratio calculated for year 2019 and 2020 recorded as .798 and .794 in case
of Walmart whereas in case of Tesco it gave a result of 1.498 and 2.76. It is clear that Tesco has
more efficiency for paying back its debts and liabilities. It is also evident that it holds more assets
as compared to liabilities in own case as well as in other related company case as well. It thus
helps to understand that effectiveness and working capacity of Tesco is more than other
respective organisation. Thus, it would be beneficial in view point of investor to put its money in
carrying out better results and for generating enough cash from firm. Working capital is useful
for generating and betterment of cash flow records and statements thus in near future it would
prove to be a better option for others to get linked with the business. Tesco hold more liquidity
and profitability in competitive market and has more competitive market image when compared
to Walmart. Thus, it is recommended to Walmart that it must focus on improving its
performance in market and carry out expected results that would help it to grow and expand
(Dong, 2022).
Working capital serves as a tool in decision making:
Yes, it is true that it is a large base for facilitating decisions on the basis of
computed working capital ratio as it provides an idea about how the better
functions are being managed in a enterprise. There are times when a consumer or
investor is confused between two companies having good market value but is
unaware about real working of business in market over a period of time thus it is
required to compute related ratios that would serve as a guide for making
decisions whether to invest in a business or not.
It helps to provide an idea whether to invest or not in a company by going through
its computed ratios over a period of time.
It helps to understand profitability and liquidity positioning of a company in
market.
It also provides an idea about assets being purchased and sold. It is useful for
understanding what amount of debts are to be covered and liabilities that must be
set off.
IT helps to get an idea about revenue and income being processed by a company.
It also helps to understand its financial stability of fighting and sustaining in the
market.
⊘ This is a preview!⊘
Do you want full access?
Subscribe today to unlock all pages.
Trusted by 1+ million students worldwide
1 out of 17
Related Documents


Your All-in-One AI-Powered Toolkit for Academic Success.
+13062052269
info@desklib.com
Available 24*7 on WhatsApp / Email
![[object Object]](/_next/static/media/star-bottom.7253800d.svg)
Unlock your academic potential
Copyright © 2020–2026 A2Z Services. All Rights Reserved. Developed and managed by ZUCOL.