Financial Analysis: Ratio Calculation and Breakeven Point Analysis
VerifiedAdded on 2023/06/04
|18
|4582
|250
Homework Assignment
AI Summary
This document presents a comprehensive solution to a finance assignment. It begins with an introduction to finance, defining its core concepts and evolution. The assignment then delves into detailed financial ratio analysis, calculating and interpreting various ratios such as gross profit margin, asset usage, current ratio, acid test ratio, inventory holding period, and debt-to-equity ratio for Liverton Co. for the years ending 2019 and 2018. The importance of financial statements for both external and internal users is also discussed. Furthermore, the solution includes a cash budget for Sassy Clothing, addressing the company's financial position and strategies for improvement. The assignment proceeds to calculate breakeven points in units and sales revenue for 2019 and 2020, along with margin of safety calculations. Finally, the document covers capital budgeting techniques including payback period, accounting rate of return, and net present value, offering a complete financial analysis.

Introduction to
Finance
Finance
Paraphrase This Document
Need a fresh take? Get an instant paraphrase of this document with our AI Paraphraser
Table of Contents
INTRODUCTION...........................................................................................................................3
QUESTION 1..................................................................................................................................3
QUESTION 2..................................................................................................................................6
(c) Explanation of additional expenditures.............................................................................8
QUESTION 3..................................................................................................................................8
(a) Calculate the breakeven point in units and sales revenue for the year ended 31 March
2019 and the year ended 31 March 2020.................................................................................8
(b) Calculate the margin of safety in units and sales revenue for the year 2019 and 2020.
...................................................................................................................................................10
(c) Discuss the new strategy developed by Jessica................................................................10
QUESTION 4................................................................................................................................10
(a)Payback period....................................................................................................................10
Accounting rate of return.......................................................................................................11
Net present value......................................................................................................................13
(b) Project A should be undertaken.......................................................................................14
(c) Capital appraisal technique: -...........................................................................................14
REFERENCES..............................................................................................................................17

⊘ This is a preview!⊘
Do you want full access?
Subscribe today to unlock all pages.
Trusted by 1+ million students worldwide
INTRODUCTION
Finance can be defined as the system of exchange amongst the various borrowers, lenders
and investors. It involves various complexities, as it operates at various levels in various
organisations globally. In finance the medium of exchange that are used can be money, credit
and finance. The concept of finance has been there in the global economy for a very long time
that is since 20th century. Earlier the financial function was more inclined towards arranging
funds from the financial institutions through shares and debentures. It transformed and changed
with an emphasis on day to day activities. It came with fund analysis in a very regularised
manner rather than casual basis. Final phase of transition of the financial function involved the
emphasis over growth of business and thus this increased the competition in the economy. In this
particular phase the economy is more inclined towards financing all that needs finance and do
not follow stereotyped financing.(Adegboye, and Iweriebor, 2018)
In the following assessment we will try to study various ratios that are used to study the
health of the business. Importance and working of various financial statements, break even point,
pay back period, various rates of return, etc.
QUESTION 1.
(a) Calculation of the financial ratios
i) Gross profit margin
Gross profit margin = ( Sales – COGS)*100 / Sales
Sales for the year ending 2019= 3,495
COGS for the year ending 2019= 2,182
Gross profit margin for the year ending 2019 = ( 3,495 – 2,182)*100 / 3,495
= 37.56%
Interpretation : Gross profit margin indicates the share of gross profit out of the total revenues
of a company and so for the purpose it considers gross profit over net. The ideal percentage for
the same is 50% - 70% . Liverton Co. is having a gross profit margin of around 37.56% which
shows that it still has the potential to improvise on its profits. This can be done probably by
increasing the selling price of the products and services or by decreasing the cost of goods sold.
ii)Asset usage = ( net sales / average total assets)
Paraphrase This Document
Need a fresh take? Get an instant paraphrase of this document with our AI Paraphraser
Sales = 3,495
Total assets for year ending 31st march 2018 = 2,503
Total assets for year ending 31st march 2019 = 3,812
Average total assets = (2,503 + 3,812)/2
= 3,157.5
Asset usage ratio for the year ending 2018 = 3,495 / 3157.5
= 1.10 times
Interpretation : The asset usage ratio is used to see as to how efficiently an organisation is
utilising its resources. The ideal ratio for the same is above 2.5 times or more % whereas the
ratio for Liverton Co. stands at around 1.10 times which means the assets of the company are
not being utilised efficientlyand has scope for improvement.(Andreeva., and et.al, 2018)
iii) Current ratio = current acid / current liabilities
Current assets (inventory+Trade receivables+short term investments+cash at
bank) for the year ending 2019 = (150+1010+75+452) = 1687
Current liability (trade payable+bank overdraft+Taxation) for the year ending
2019 = (289+143+312) = 744
Current ratio for the year ending 2019 = 1687 / 744 = 2.26
Current assets (inventory+Trade receivables+short term investments+cash at
bank) for the year ending 2018 = (102+315+0+1) = 418
Current liability (trade payable+bank overdraft+Taxation) for the year ending
2018 = (119+98+285) = 502
Current ratio for the year ending 2018 = 418 / 502 = 0.83
Interpretation :The current ratio shows as to what an extent is a firm able to meet its short term
liabilities without compromising the long term assets. The ideal ratio for the same is 2 : 1,
whereas the company's ratio stands at around 2.26 : 1. It stood at around 0.83 : 1 in the previous
year and since then the firm has improvised on its ratios.
iv) Acid test = current asset – inventory / current liability
current asset – inventory for the year ending 2019 = 1687 – 150 =1537
currenrt liablity for the year ending 2019 = 744
acid test ratio for the year ending 2019 = 1537 / 744 = 2.06
current asset – inventory for the year ending 2018 = 418 - 102
current liability for the year ending 2018 = 502
acid test ratio for the year ending 2018 = 102 / 502 = 0.20
Interpretation : The acid test ratio is used to analyse the short term liquidity of the company and
for the purpose it considers only highly liquid assets. The ideal ratio for the same is 1 times
whereas the company's ratio stands at 2.06. This ratio has increased since the last year as it stood
at 0.20 in the previous year. Which seems to be a good sign.(Berrou, Ciampoli, and Marini,
2019)
v) Inventories holding period = (Average inventory / cost of goods sold)*365
average inventory for the year ending 2019 = ( 150 + 102 ) / 2 = 126
cost of googs sold for the year ending 2019 = 2182
inventory holding period for the year ending 2019 = (126*365) / 2185 = 21.04
Interpretation : This particular ratio depicts the number of days for which a company is holding
up its inventory. The ideal ratio for the same is 5 – 10 whereas the company stands with a ratio
of around 21 days which is much higher, thus the company should try to reduce this period by
decreasing the production or increasing the sales.
vi) Debt to Equity ratio = Debt / Equity
debt(Trade payables
+Bank overdraft+long term loans) for the year ending 2019 = 289+143+170 =
602
equity for the year ending 2019 = 2898
debt / equity ratio for the year ending 2019 = 602/2989 = 0.20
debt(Trade payables
+Bank overdraft+long term loans) for the year ending 2018 = 119+98+50 =
267
equity for the year ending 2018 =1951
debt / equity ratio for the year ending 2018 =267 / 1951 = 0.13
⊘ This is a preview!⊘
Do you want full access?
Subscribe today to unlock all pages.
Trusted by 1+ million students worldwide
Interpretation : This particular ratio is used to find the leverage of a company that the ratio
between the debt and equity of a company. The ideal ratio for the same is 2 – 2.5 times whereas
the company's ratio stands at around .20 which is too less than the ideal ratio. Somehow it should
be observed that the ratio has improvised as compared to .13 for the previous year.
(b) Importance of considering audience :-
External Users:-
1. Shareholders- Financial statements depicts the current financial condition of any
company. Since no one wants to lose money by investing in a loss making company, it
becomes imperative to study the financial statements. Statements shows whether a
company is making profit or incurring losses which includes Income statement or P&l
statement.(Dong, Xu, and McIver, 2020)
2. Bank and financial institutions:- Banks provides credit facility to the companies having
good financial records. Therefore, it is necessary for every company to have accurate
financial records audited by an expert while applying for a loan. In case of otherwise,
may cancel the loan process and have legal proceedings.
3. Government:- Governments use financial statements for taxation purposes. To
determine corporation tax, the company's taxable income has to be ascertained. Hence, it
is very necessary to have audit of financial records, otherwise the company may get stuck
in the taxation processes.
Internal Users:-
4. Management:- The financial statements helps the management in analysing the
company’s performance in comparison to the previous years along with other businesses
and sectors. Providing management with accurate information enables them to take
correct decisions as well as forming policies.
5. Employees:- Employees primarily use financial statements with the main objective of a
salary or wage increments. Another key factor is that employees generally feel more
satisfied working with a profit-making company and not a loss-making company.
QUESTION 2.
(a) Opening statement of financial position at the start of July 20X5
Opening Statement of Financial Position
Paraphrase This Document
Need a fresh take? Get an instant paraphrase of this document with our AI Paraphraser
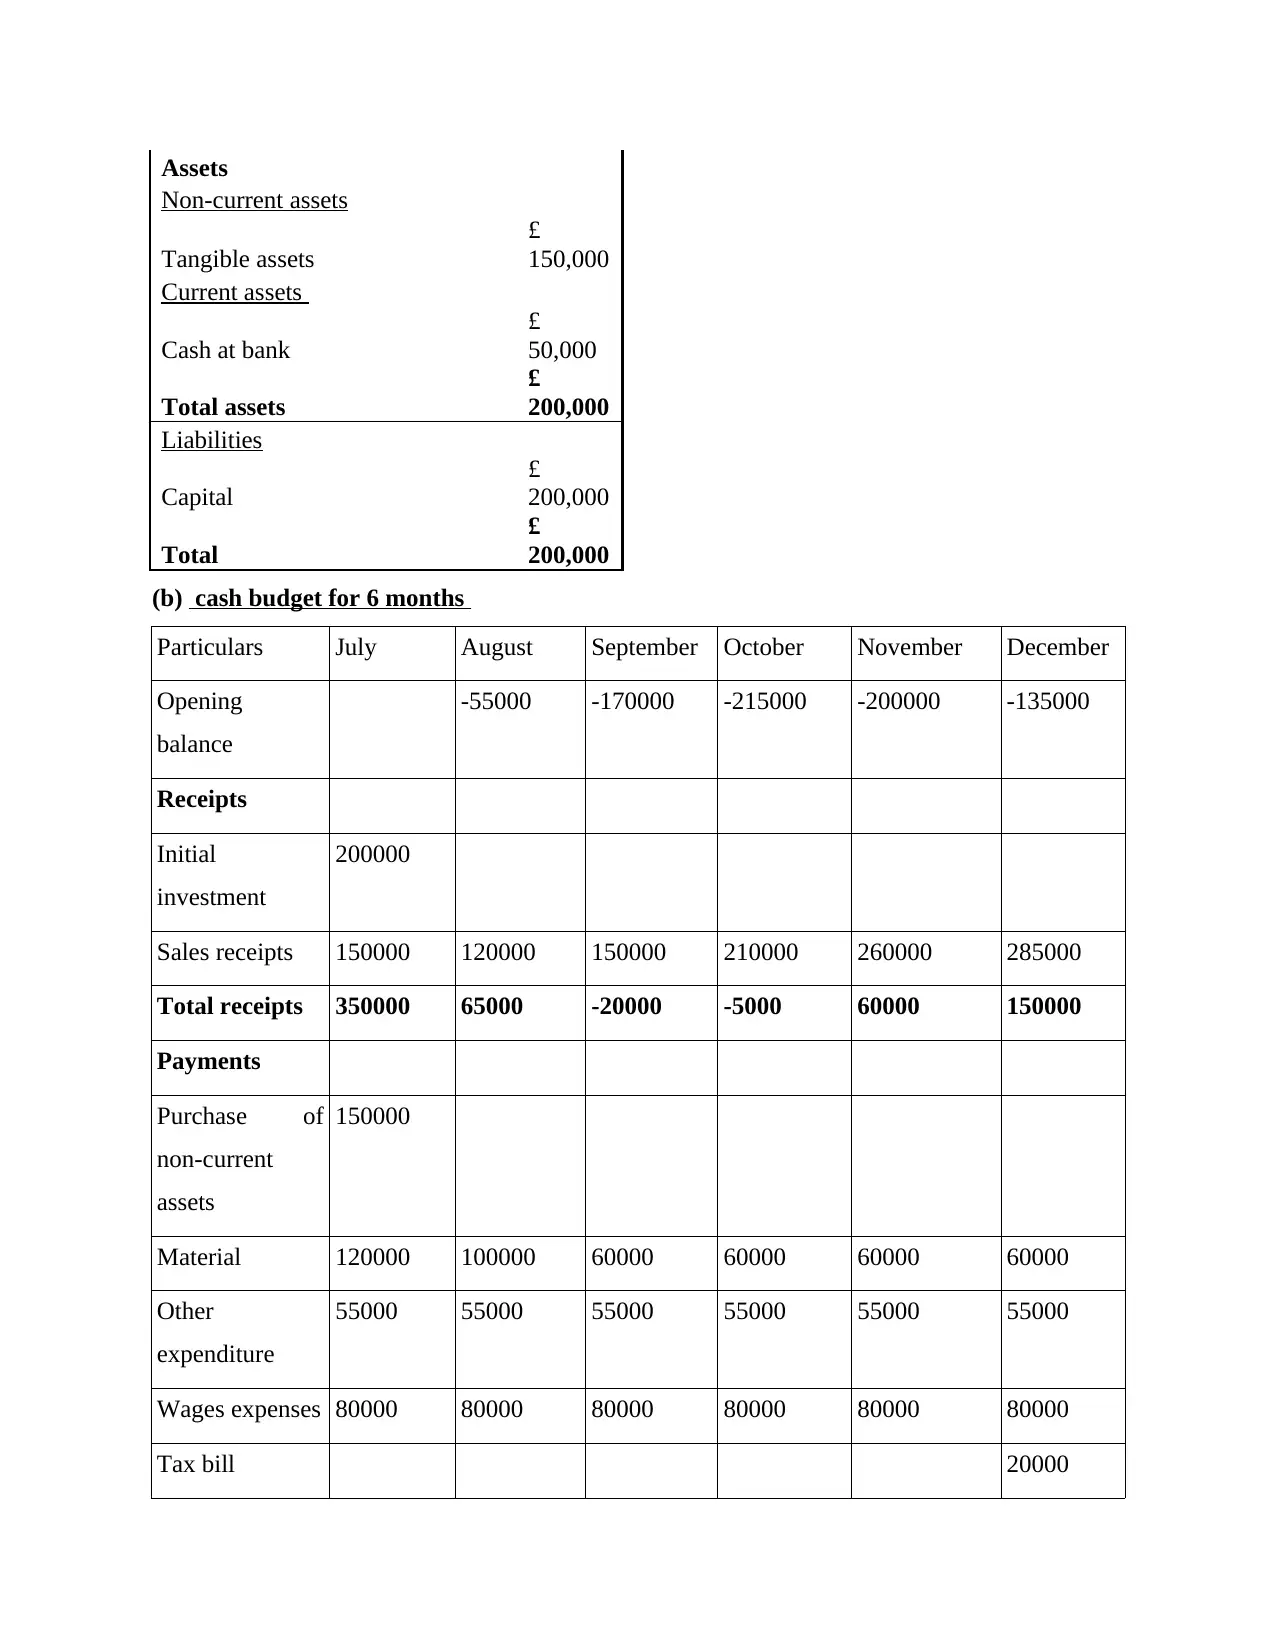
Assets
Non-current assets
Tangible assets
£
150,000
Current assets
Cash at bank
£
50,000
Total assets
£
200,000
Liabilities
Capital
£
200,000
Total
£
200,000
(b) cash budget for 6 months
Particulars July August September October November December
Opening
balance
-55000 -170000 -215000 -200000 -135000
Receipts
Initial
investment
200000
Sales receipts 150000 120000 150000 210000 260000 285000
Total receipts 350000 65000 -20000 -5000 60000 150000
Payments
Purchase of
non-current
assets
150000
Material 120000 100000 60000 60000 60000 60000
Other
expenditure
55000 55000 55000 55000 55000 55000
Wages expenses 80000 80000 80000 80000 80000 80000
Tax bill 20000
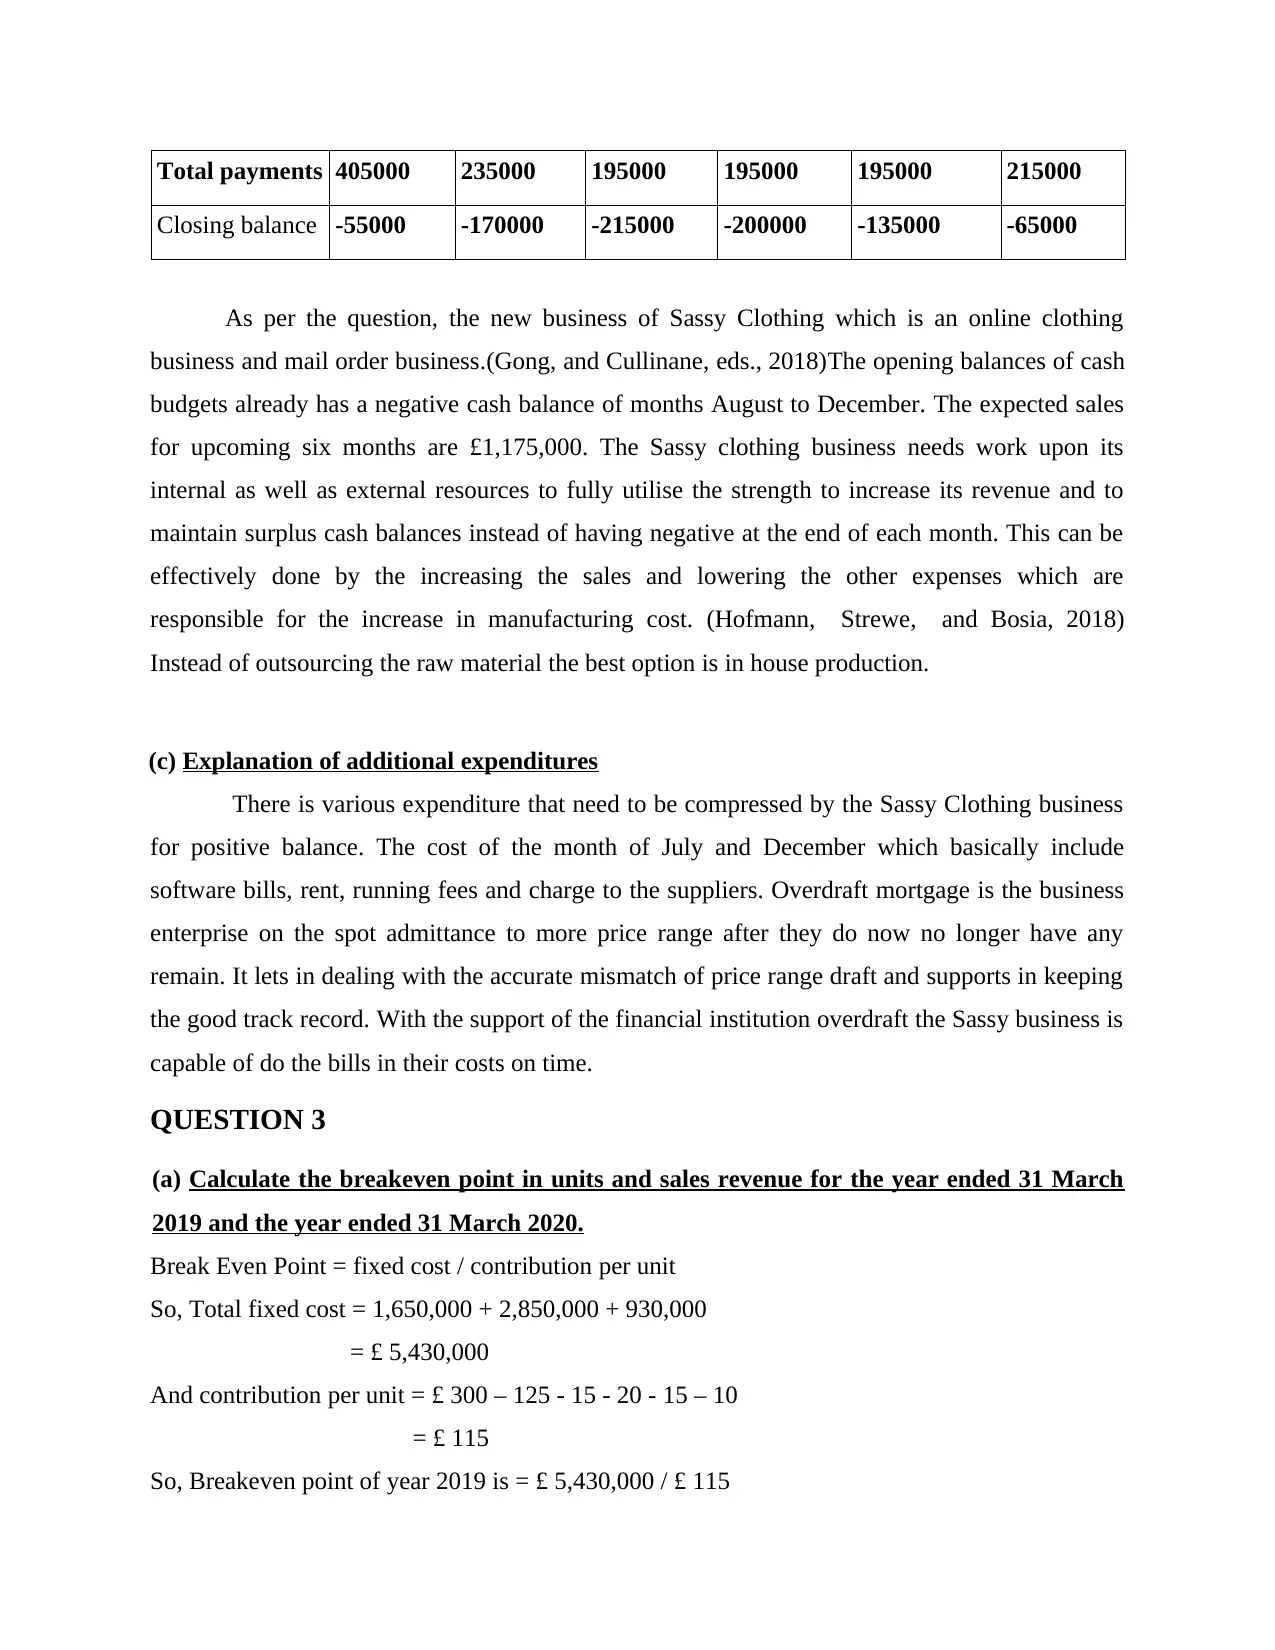
Total payments 405000 235000 195000 195000 195000 215000
Closing balance -55000 -170000 -215000 -200000 -135000 -65000
As per the question, the new business of Sassy Clothing which is an online clothing
business and mail order business.(Gong, and Cullinane, eds., 2018)The opening balances of cash
budgets already has a negative cash balance of months August to December. The expected sales
for upcoming six months are £1,175,000. The Sassy clothing business needs work upon its
internal as well as external resources to fully utilise the strength to increase its revenue and to
maintain surplus cash balances instead of having negative at the end of each month. This can be
effectively done by the increasing the sales and lowering the other expenses which are
responsible for the increase in manufacturing cost. (Hofmann, Strewe, and Bosia, 2018)
Instead of outsourcing the raw material the best option is in house production.
(c) Explanation of additional expenditures
There is various expenditure that need to be compressed by the Sassy Clothing business
for positive balance. The cost of the month of July and December which basically include
software bills, rent, running fees and charge to the suppliers. Overdraft mortgage is the business
enterprise on the spot admittance to more price range after they do now no longer have any
remain. It lets in dealing with the accurate mismatch of price range draft and supports in keeping
the good track record. With the support of the financial institution overdraft the Sassy business is
capable of do the bills in their costs on time.
QUESTION 3
(a) Calculate the breakeven point in units and sales revenue for the year ended 31 March
2019 and the year ended 31 March 2020.
Break Even Point = fixed cost / contribution per unit
So, Total fixed cost = 1,650,000 + 2,850,000 + 930,000
= £ 5,430,000
And contribution per unit = £ 300 – 125 - 15 - 20 - 15 – 10
= £ 115
So, Breakeven point of year 2019 is = £ 5,430,000 / £ 115
⊘ This is a preview!⊘
Do you want full access?
Subscribe today to unlock all pages.
Trusted by 1+ million students worldwide
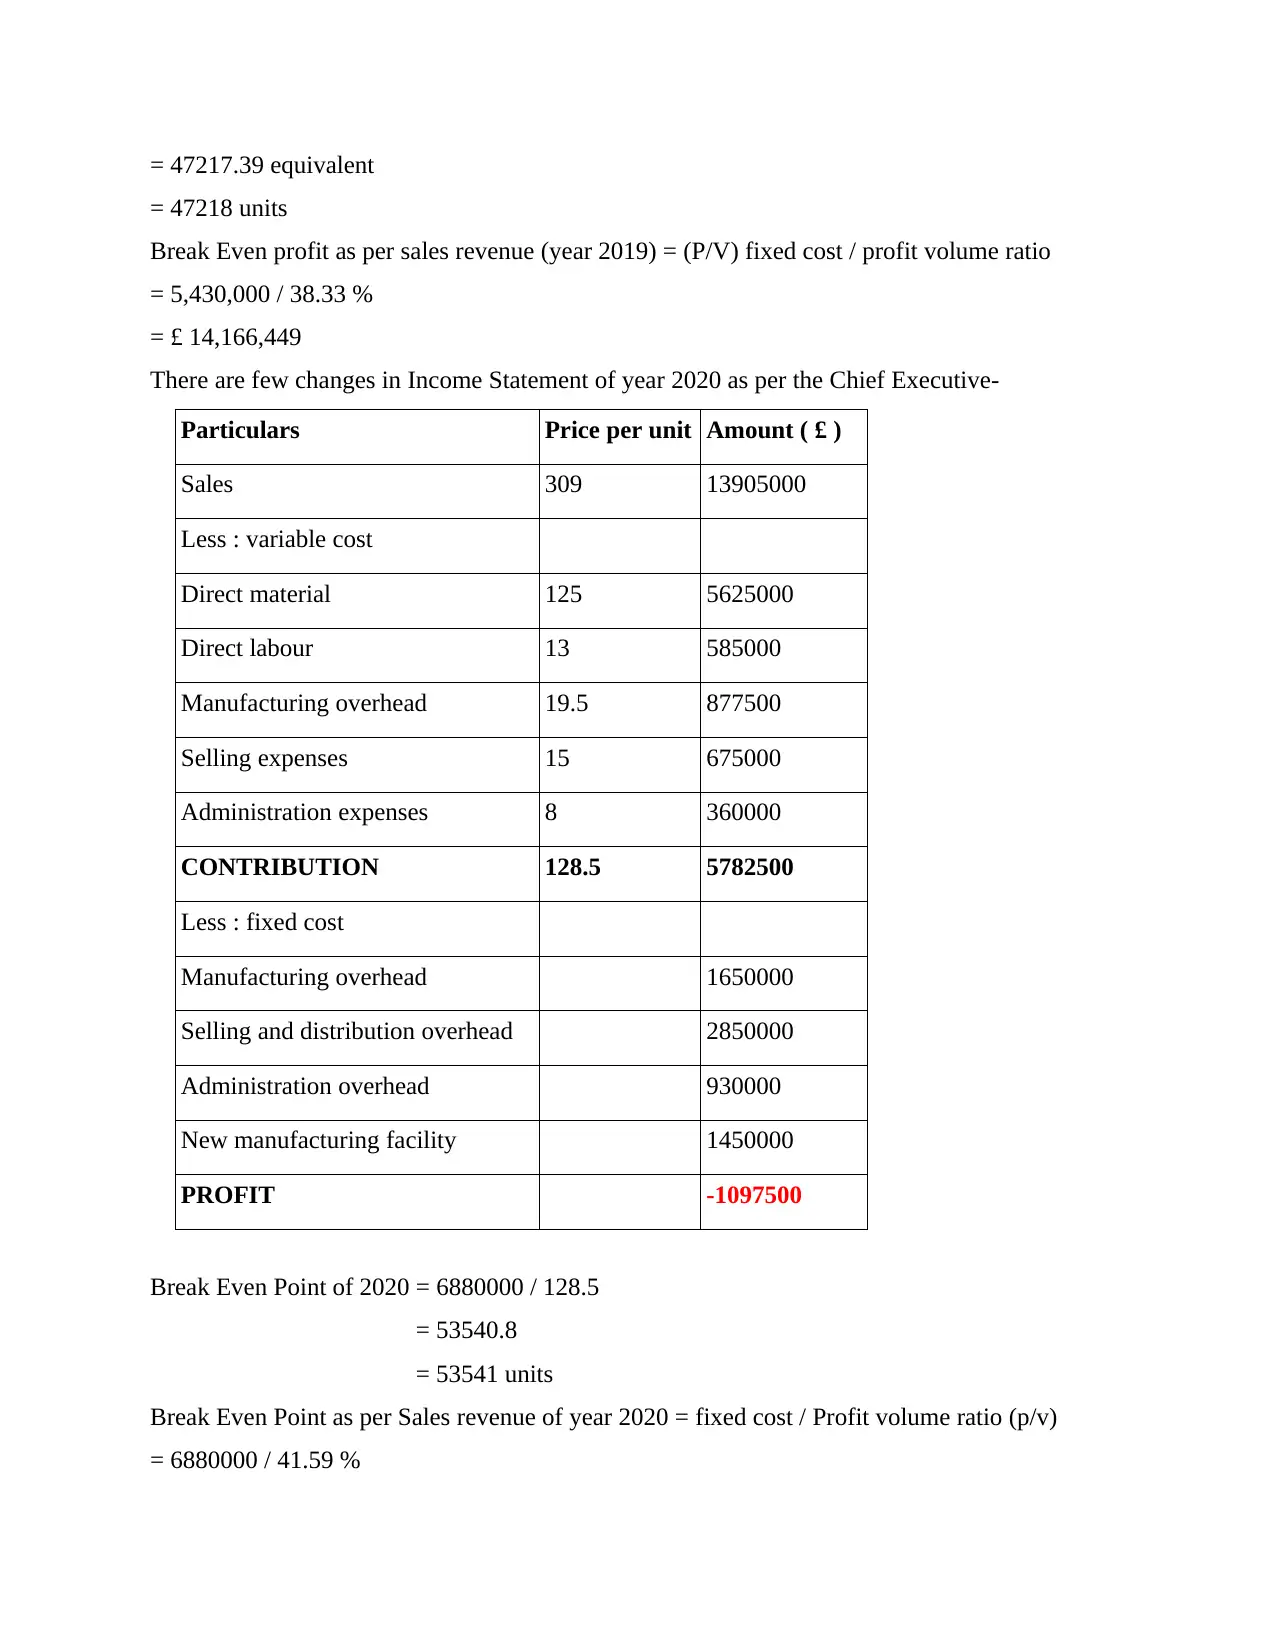
= 47217.39 equivalent
= 47218 units
Break Even profit as per sales revenue (year 2019) = (P/V) fixed cost / profit volume ratio
= 5,430,000 / 38.33 %
= £ 14,166,449
There are few changes in Income Statement of year 2020 as per the Chief Executive-
Particulars Price per unit Amount ( £ )
Sales 309 13905000
Less : variable cost
Direct material 125 5625000
Direct labour 13 585000
Manufacturing overhead 19.5 877500
Selling expenses 15 675000
Administration expenses 8 360000
CONTRIBUTION 128.5 5782500
Less : fixed cost
Manufacturing overhead 1650000
Selling and distribution overhead 2850000
Administration overhead 930000
New manufacturing facility 1450000
PROFIT -1097500
Break Even Point of 2020 = 6880000 / 128.5
= 53540.8
= 53541 units
Break Even Point as per Sales revenue of year 2020 = fixed cost / Profit volume ratio (p/v)
= 6880000 / 41.59 %
Paraphrase This Document
Need a fresh take? Get an instant paraphrase of this document with our AI Paraphraser
= £ 16542438.09
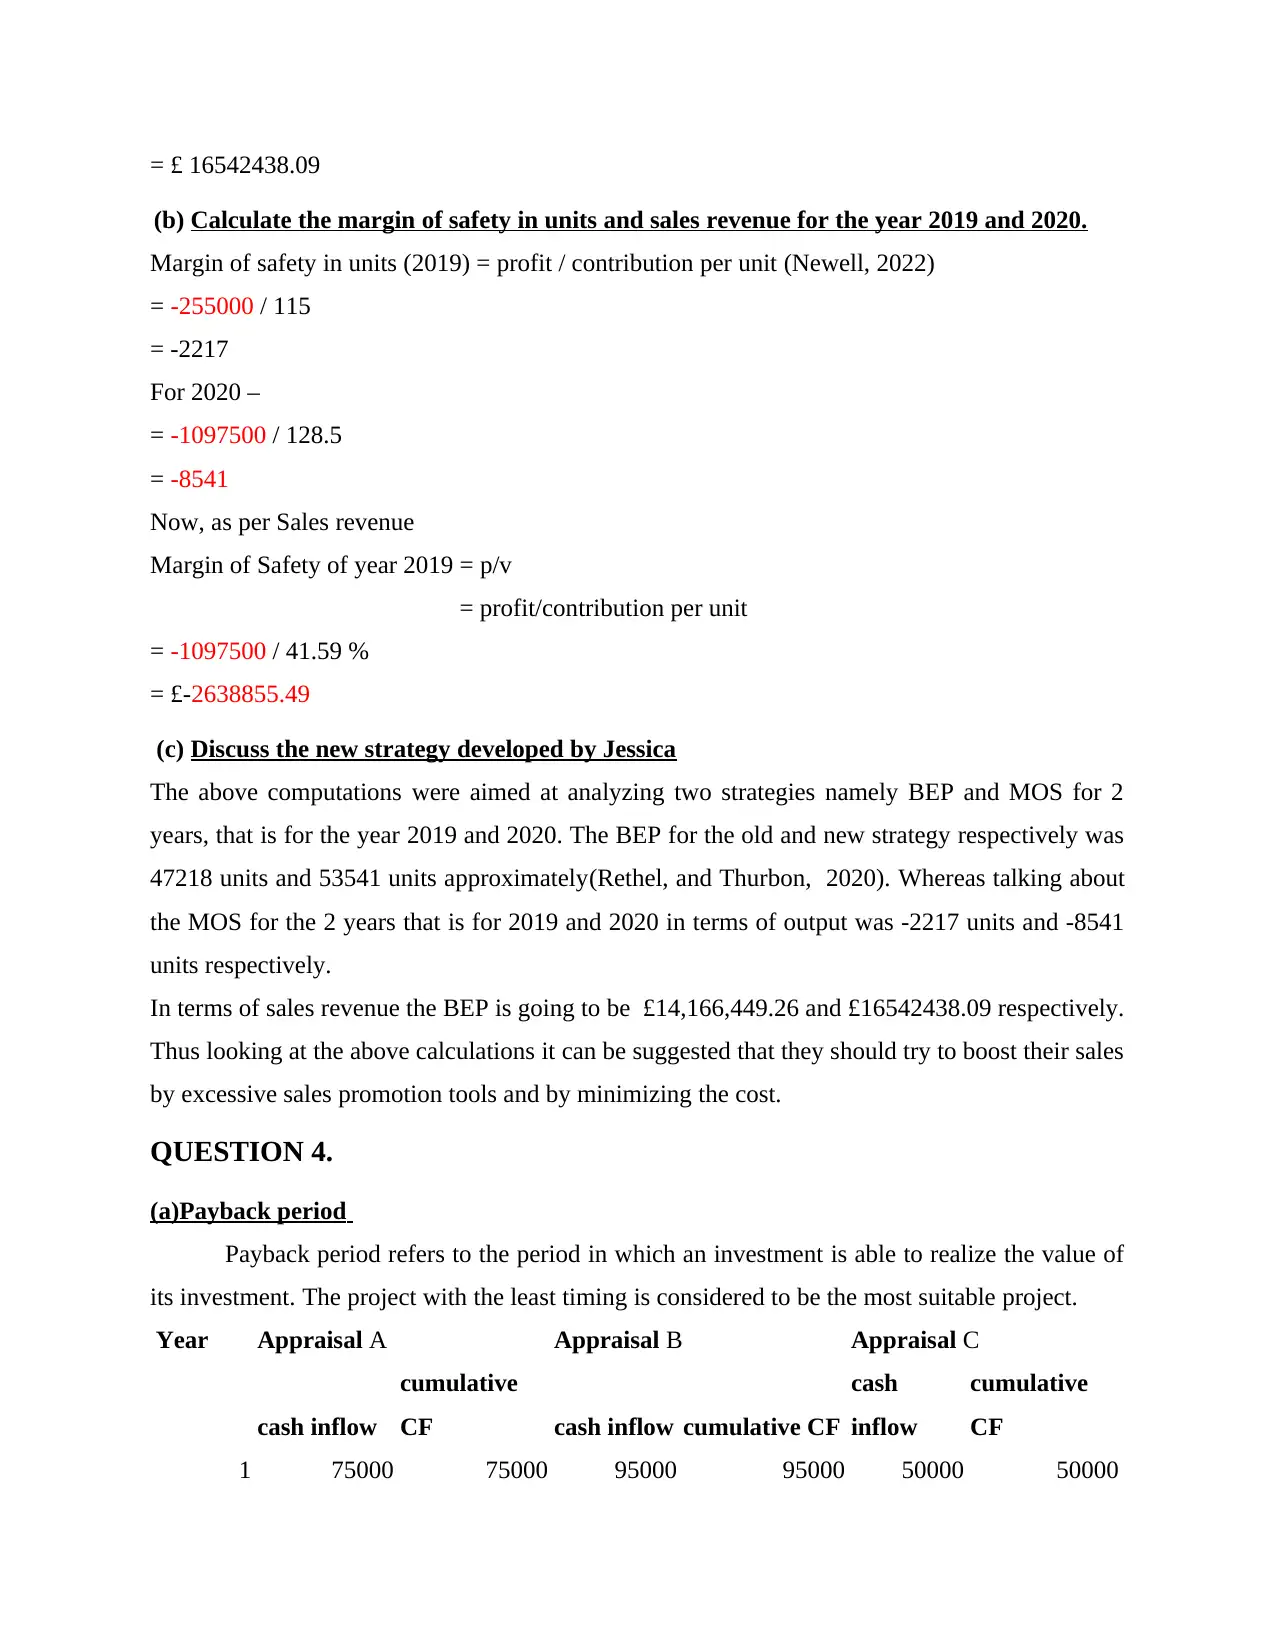
(b) Calculate the margin of safety in units and sales revenue for the year 2019 and 2020.
Margin of safety in units (2019) = profit / contribution per unit (Newell, 2022)
= -255000 / 115
= -2217
For 2020 –
= -1097500 / 128.5
= -8541
Now, as per Sales revenue
Margin of Safety of year 2019 = p/v
= profit/contribution per unit
= -1097500 / 41.59 %
= £-2638855.49
(c) Discuss the new strategy developed by Jessica
The above computations were aimed at analyzing two strategies namely BEP and MOS for 2
years, that is for the year 2019 and 2020. The BEP for the old and new strategy respectively was
47218 units and 53541 units approximately(Rethel, and Thurbon, 2020). Whereas talking about
the MOS for the 2 years that is for 2019 and 2020 in terms of output was -2217 units and -8541
units respectively.
In terms of sales revenue the BEP is going to be £14,166,449.26 and £16542438.09 respectively.
Thus looking at the above calculations it can be suggested that they should try to boost their sales
by excessive sales promotion tools and by minimizing the cost.
QUESTION 4.
(a)Payback period
Payback period refers to the period in which an investment is able to realize the value of
its investment. The project with the least timing is considered to be the most suitable project.
Year Appraisal A Appraisal B Appraisal C
cash inflow
cumulative
CF cash inflow cumulative CF
cash
inflow
cumulative
CF
1 75000 75000 95000 95000 50000 50000
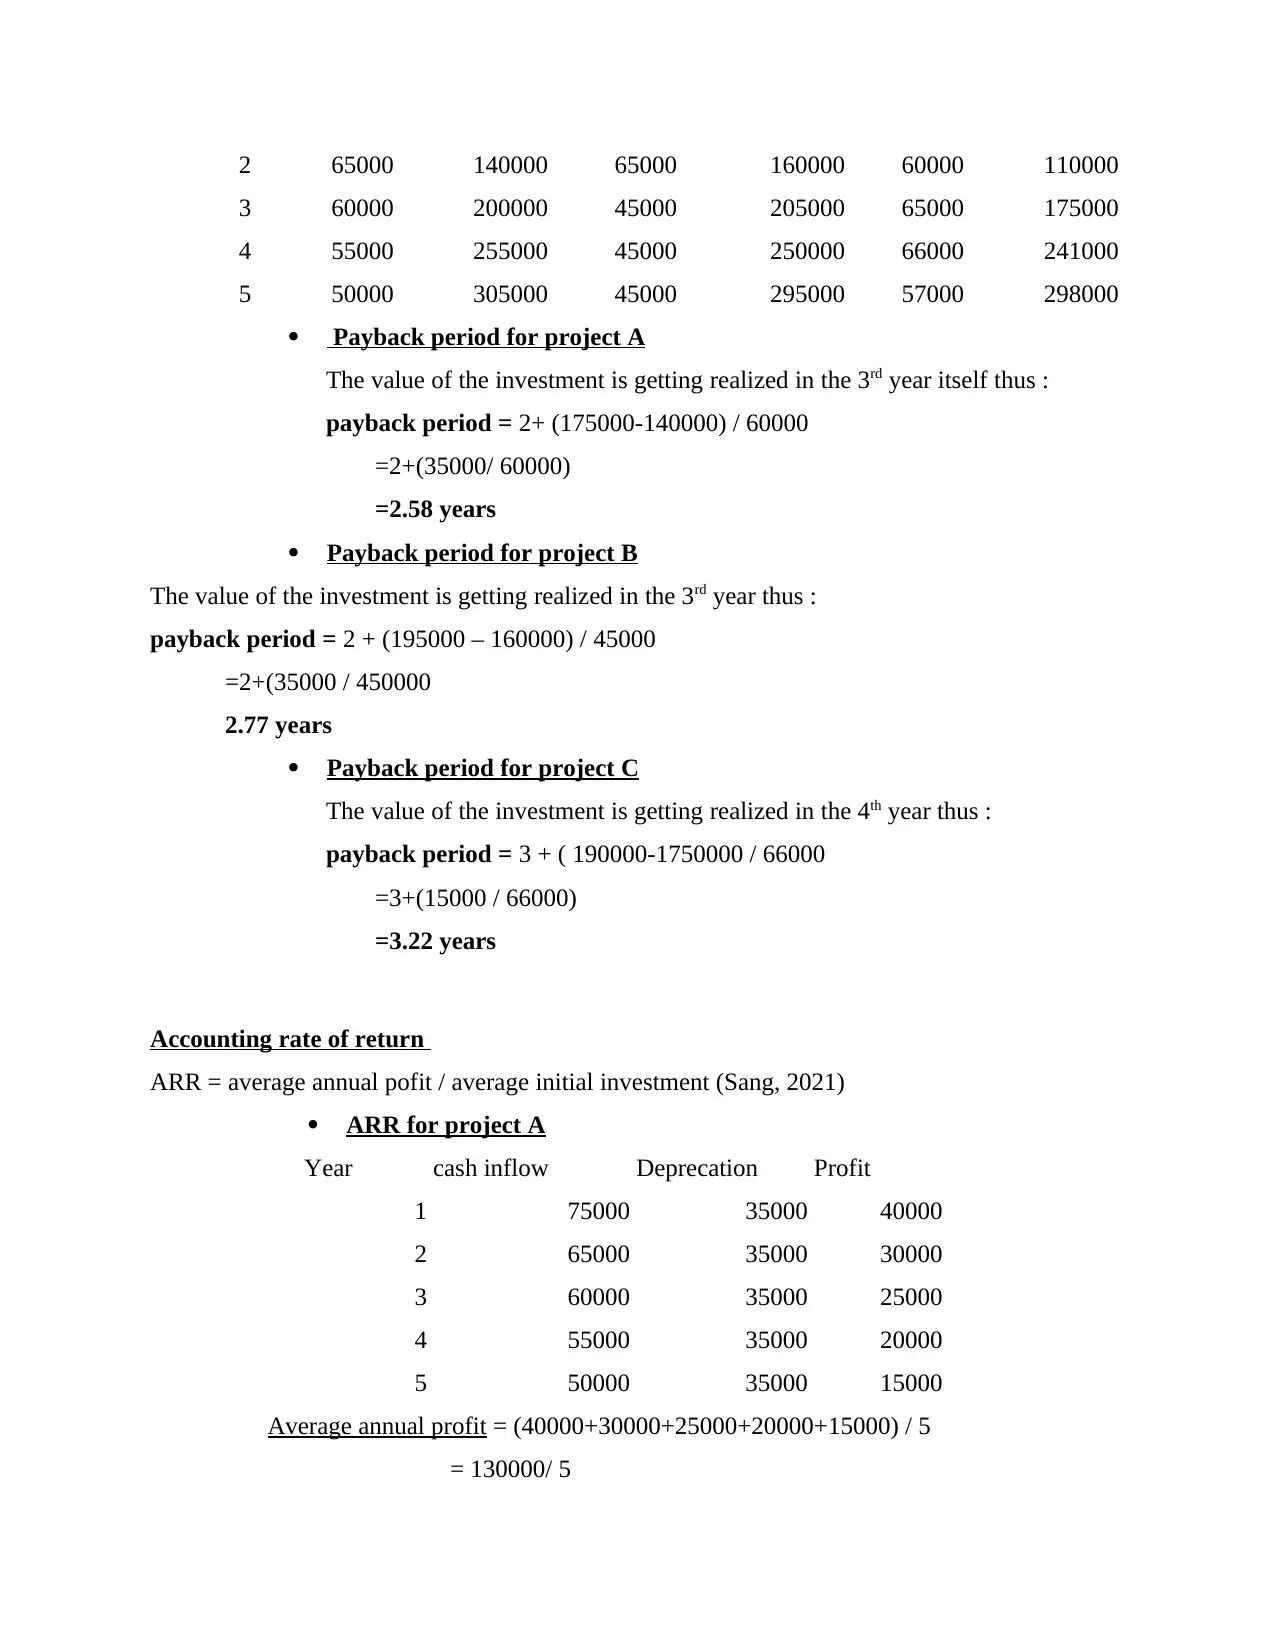
2 65000 140000 65000 160000 60000 110000
3 60000 200000 45000 205000 65000 175000
4 55000 255000 45000 250000 66000 241000
5 50000 305000 45000 295000 57000 298000
Payback period for project A
The value of the investment is getting realized in the 3rd year itself thus :
payback period = 2+ (175000-140000) / 60000
=2+(35000/ 60000)
=2.58 years
Payback period for project B
The value of the investment is getting realized in the 3rd year thus :
payback period = 2 + (195000 – 160000) / 45000
=2+(35000 / 450000
2.77 years
Payback period for project C
The value of the investment is getting realized in the 4th year thus :
payback period = 3 + ( 190000-1750000 / 66000
=3+(15000 / 66000)
=3.22 years
Accounting rate of return
ARR = average annual pofit / average initial investment (Sang, 2021)
ARR for project A
Year cash inflow Deprecation Profit
1 75000 35000 40000
2 65000 35000 30000
3 60000 35000 25000
4 55000 35000 20000
5 50000 35000 15000
Average annual profit = (40000+30000+25000+20000+15000) / 5
= 130000/ 5
⊘ This is a preview!⊘
Do you want full access?
Subscribe today to unlock all pages.
Trusted by 1+ million students worldwide
1 out of 18
Related Documents


Your All-in-One AI-Powered Toolkit for Academic Success.
+13062052269
info@desklib.com
Available 24*7 on WhatsApp / Email
![[object Object]](/_next/static/media/star-bottom.7253800d.svg)
Unlock your academic potential
Copyright © 2020–2026 A2Z Services. All Rights Reserved. Developed and managed by ZUCOL.