Managerial Finance Report: Ratio Analysis of Sainsbury & Tesco
VerifiedAdded on 2022/12/30
|19
|3821
|42
Report
AI Summary
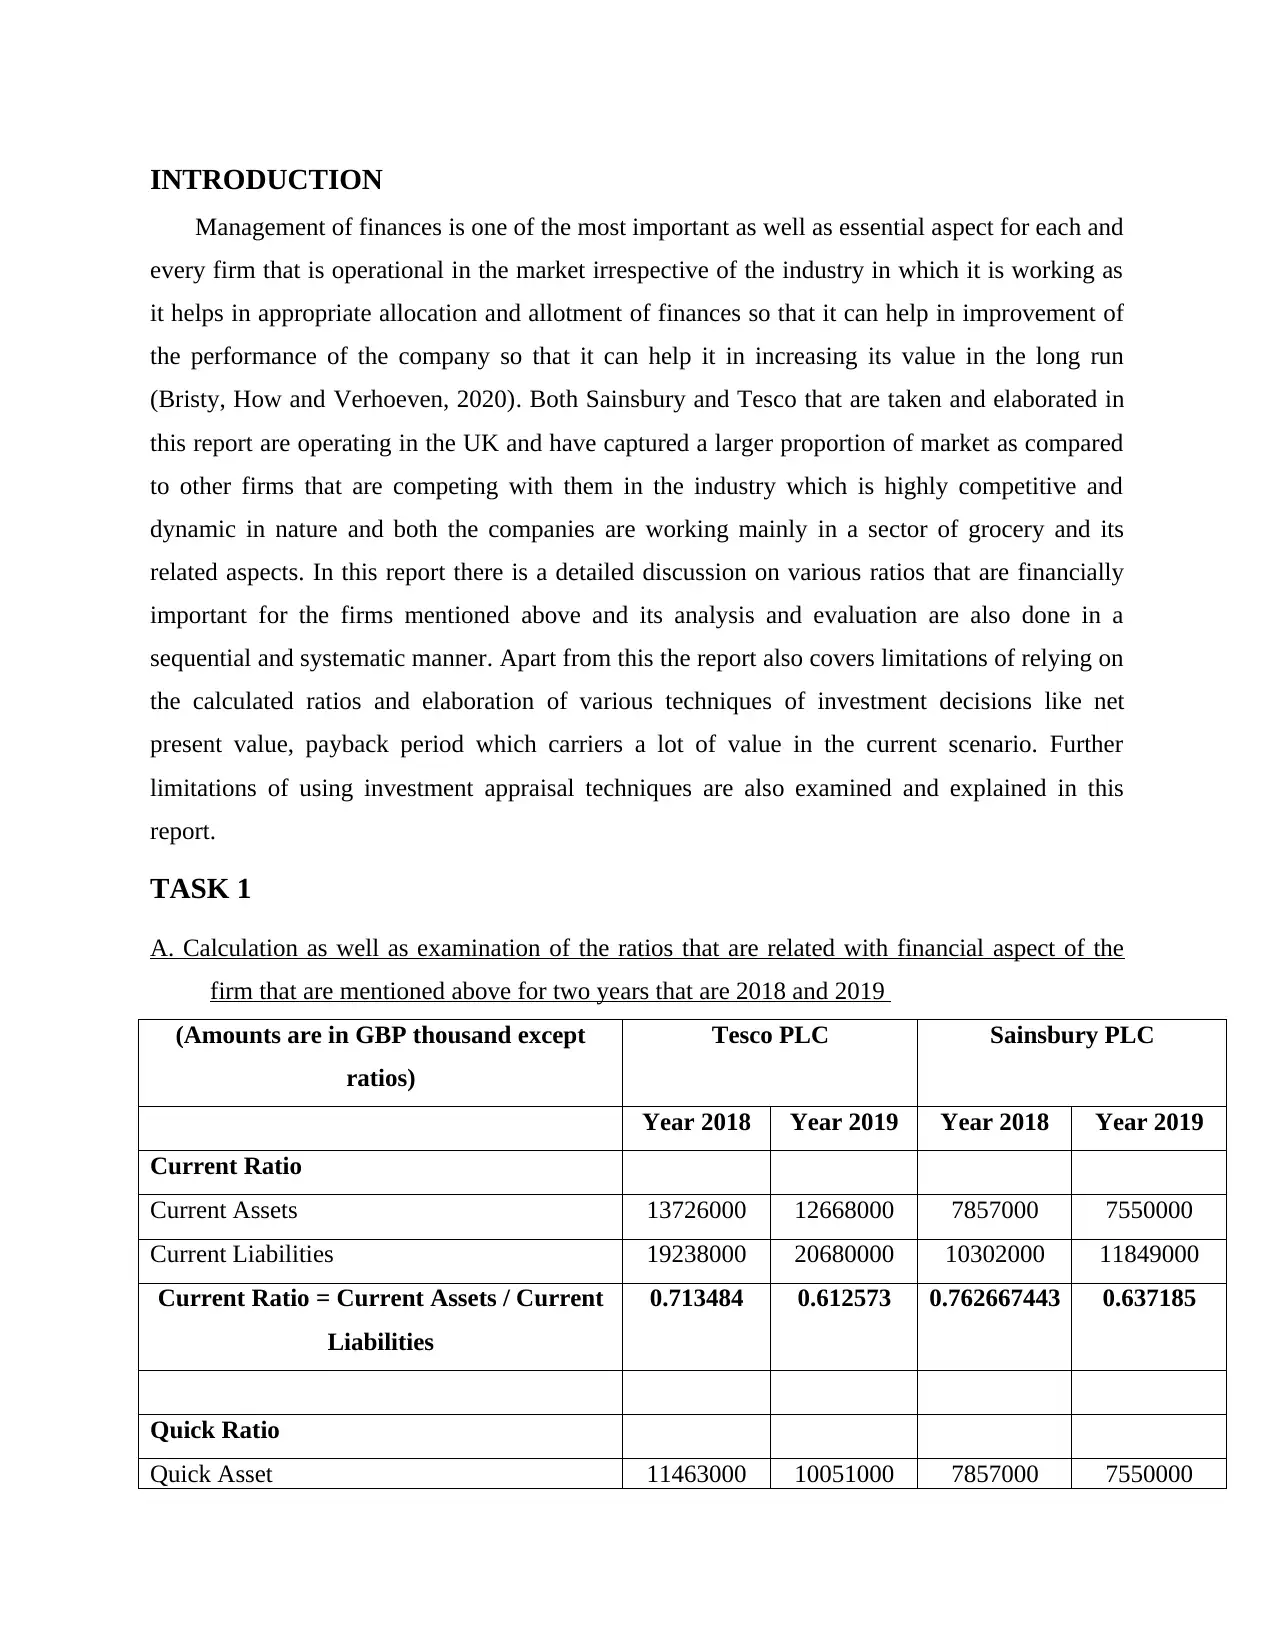
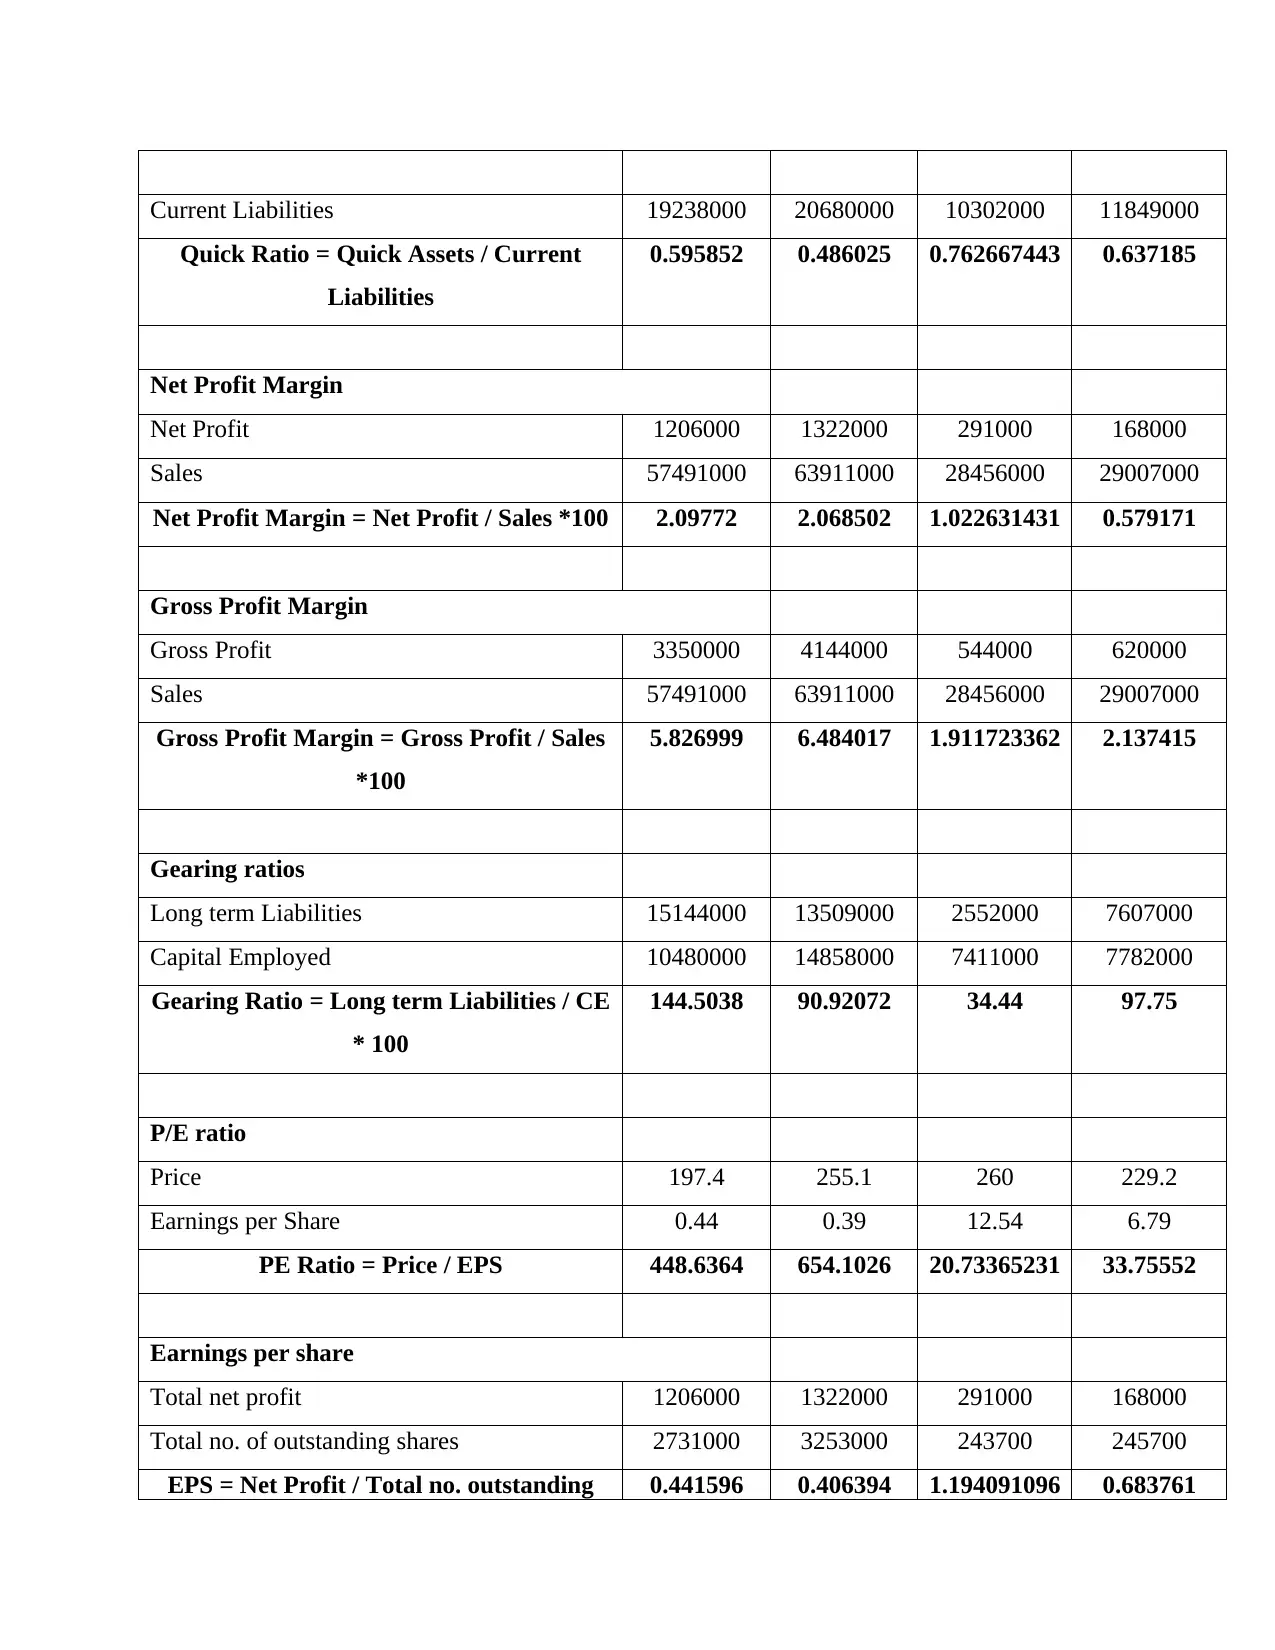
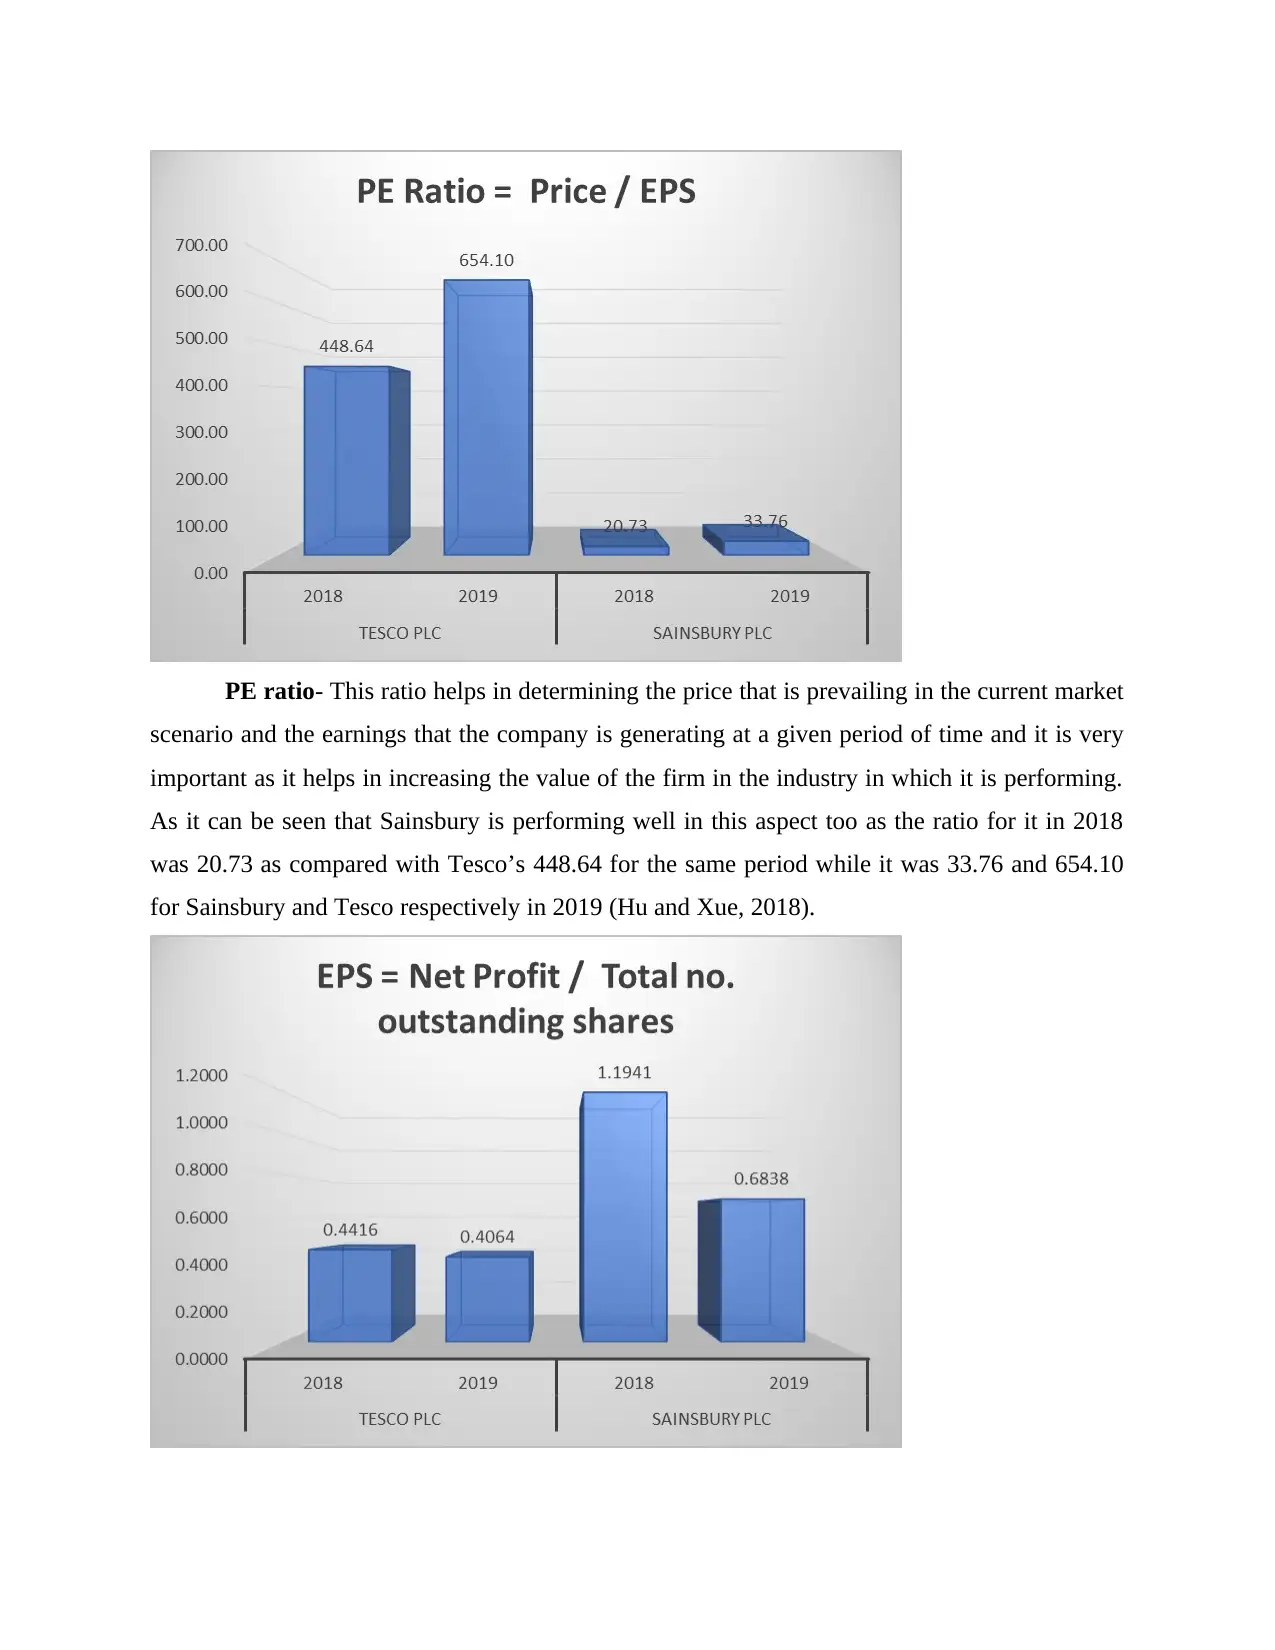
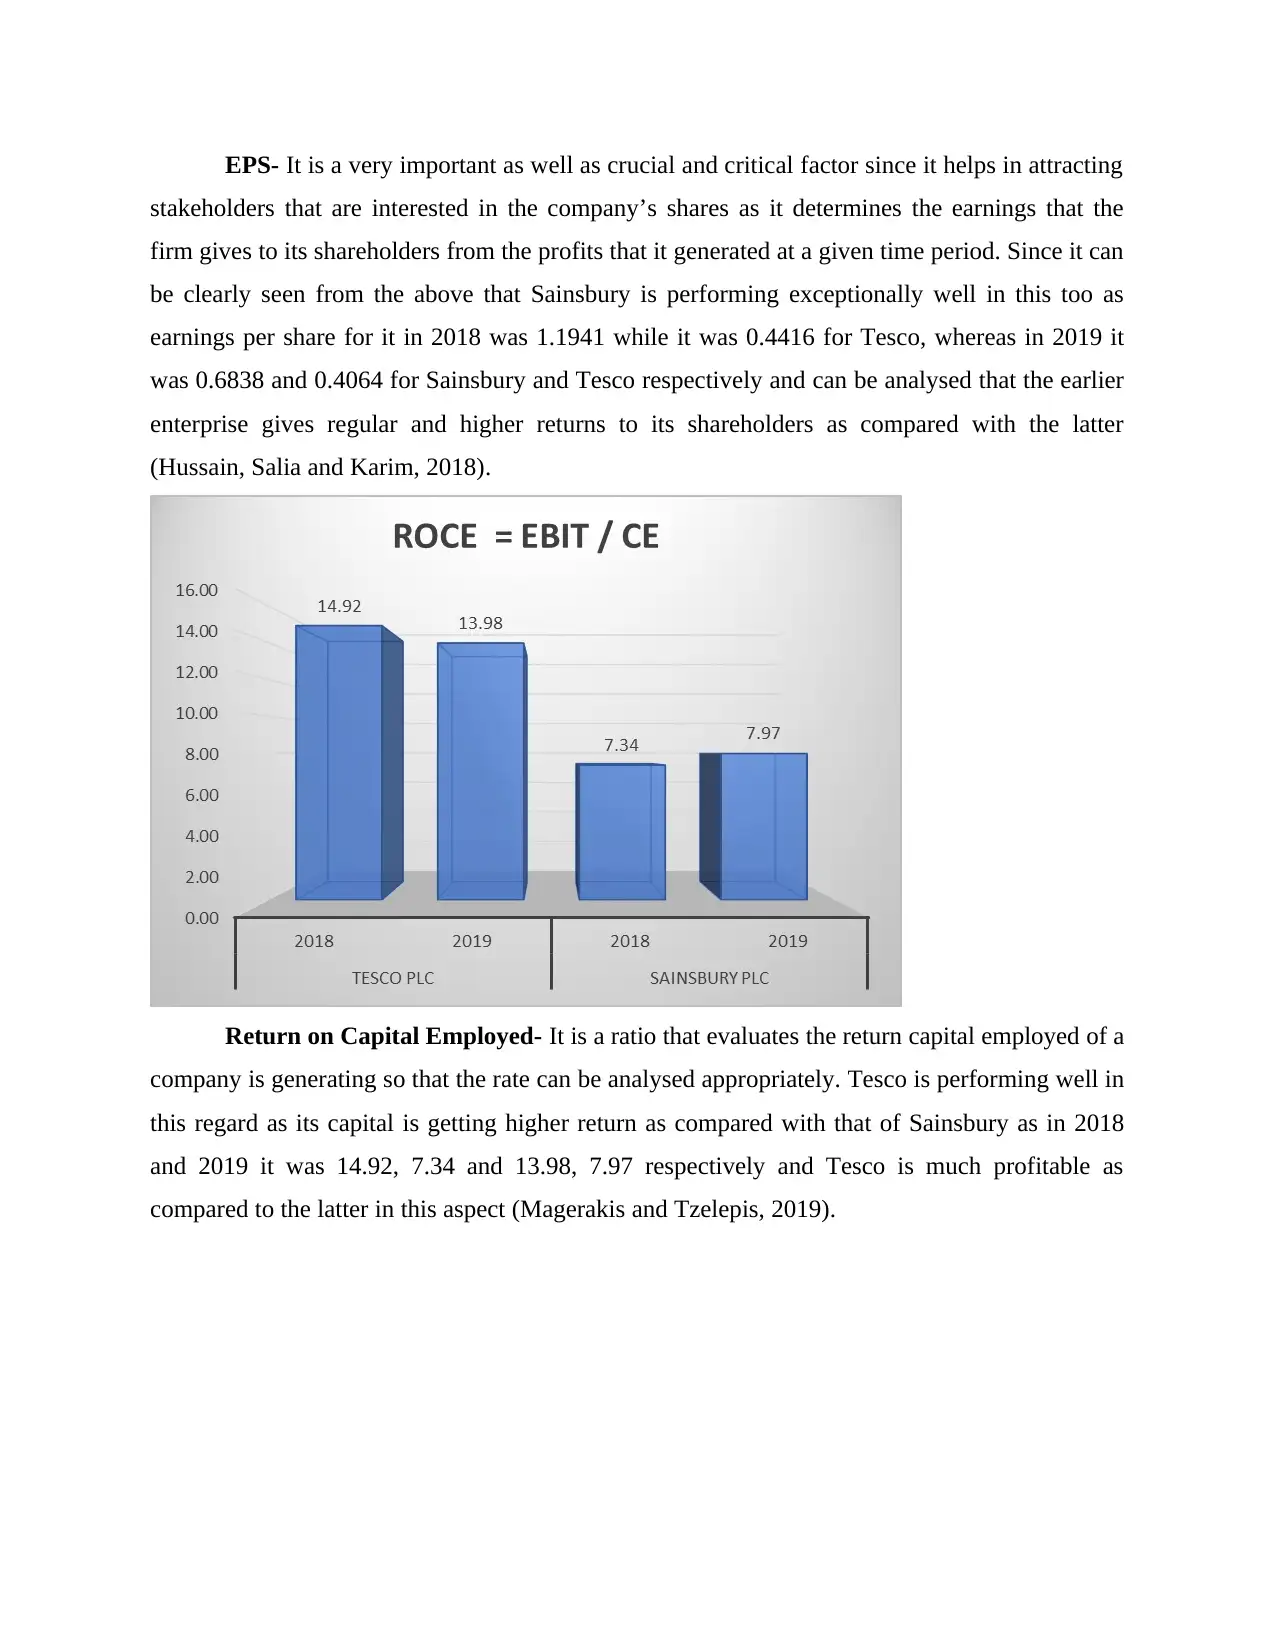
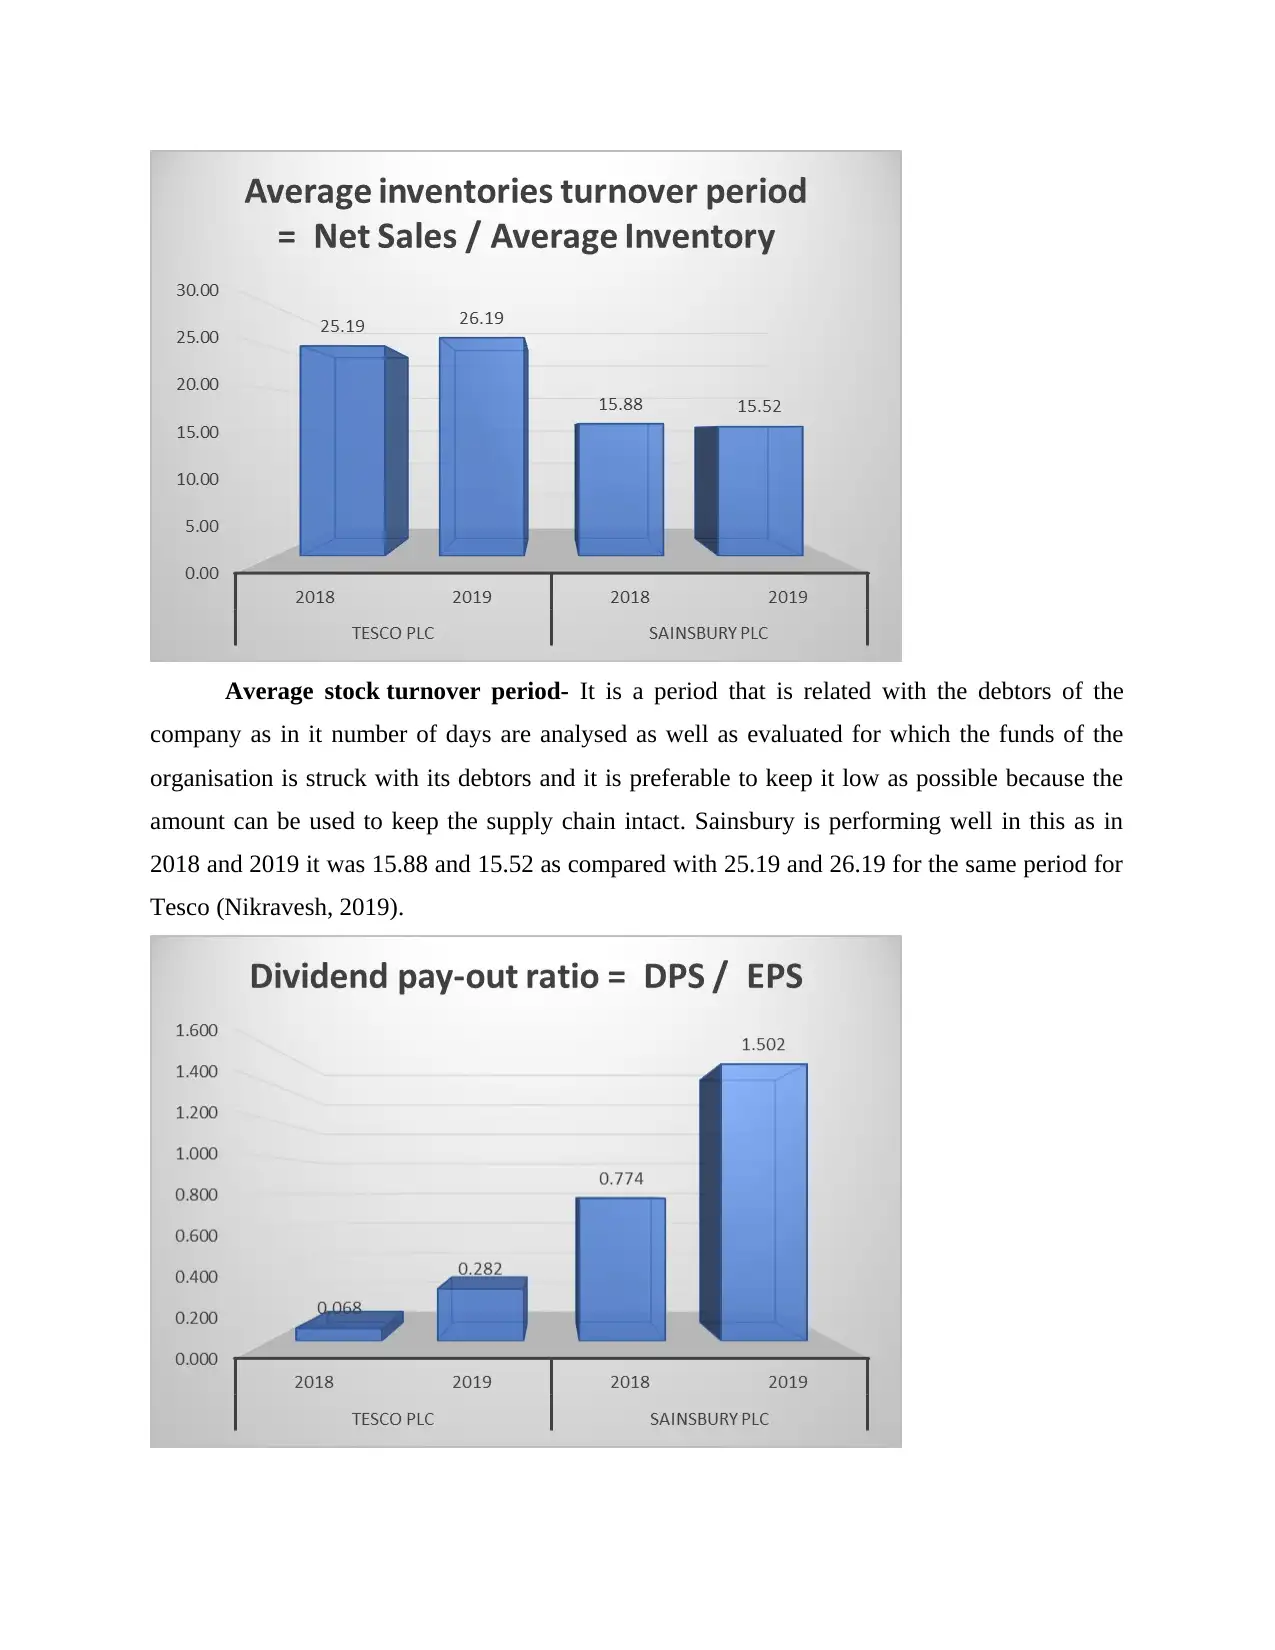
This report provides a comprehensive financial analysis of Sainsbury and Tesco, two major players in the UK grocery market. It begins with a detailed calculation and examination of various financial ratios, including current ratio, quick ratio, net profit margin, gross profit margin, gearing ratio, price-to-earnings ratio, earnings per share, return on capital employed, average inventory turnover period, and dividend payout ratio for the years 2018 and 2019. The report then offers an in-depth analysis and comparison of these ratios, highlighting the strengths and weaknesses of each company. Furthermore, it includes appropriate recommendations based on the calculated facts and figures, along with an evaluation of the limitations of relying solely on these ratios. The report also explores investment appraisal techniques, such as net present value and payback period, and discusses their limitations. Overall, the analysis reveals that Sainsbury generally demonstrates a stronger financial position compared to Tesco, particularly in terms of profitability and shareholder returns, while also acknowledging areas where Tesco excels. The report concludes with recommendations for both companies, emphasizing the importance of continuous improvement and strategic decision-making in a competitive market.

Managerial finance
Paraphrase This Document
Need a fresh take? Get an instant paraphrase of this document with our AI Paraphraser

Contents
Contents...........................................................................................................................................2
INTRODUCTION...........................................................................................................................1
TASK 1............................................................................................................................................1
A. Calculation as well as examination of the ratios that are related with financial aspect of the
firm that are mentioned above for two years that are 2018 and 2019.........................................1
B. Detailed examination and analysis of the ratios that are calculated above so that a clearer
picture of the positioning of both the firms can be analysed in an impactful manner.................3
C. Appropriate recommendations with the help of facts and figures that are calculated above in
a systematic way........................................................................................................................10
D. Detailed examination and evaluation of the limitations of the above calculated ratios........10
TASK 2..........................................................................................................................................11
A. Calculation and examination of investment appraisal techniques........................................11
B. Detailed examination, analysis, and evaluation of the limitations that techniques of
investment appraisal carriers that are long tern in nature as well..............................................13
CONCLUSION..............................................................................................................................14
REFERENCES..............................................................................................................................16

⊘ This is a preview!⊘
Do you want full access?
Subscribe today to unlock all pages.

Trusted by 1+ million students worldwide

INTRODUCTION
Management of finances is one of the most important as well as essential aspect for each and
every firm that is operational in the market irrespective of the industry in which it is working as
it helps in appropriate allocation and allotment of finances so that it can help in improvement of
the performance of the company so that it can help it in increasing its value in the long run
(Bristy, How and Verhoeven, 2020). Both Sainsbury and Tesco that are taken and elaborated in
this report are operating in the UK and have captured a larger proportion of market as compared
to other firms that are competing with them in the industry which is highly competitive and
dynamic in nature and both the companies are working mainly in a sector of grocery and its
related aspects. In this report there is a detailed discussion on various ratios that are financially
important for the firms mentioned above and its analysis and evaluation are also done in a
sequential and systematic manner. Apart from this the report also covers limitations of relying on
the calculated ratios and elaboration of various techniques of investment decisions like net
present value, payback period which carriers a lot of value in the current scenario. Further
limitations of using investment appraisal techniques are also examined and explained in this
report.
TASK 1
A. Calculation as well as examination of the ratios that are related with financial aspect of the
firm that are mentioned above for two years that are 2018 and 2019
(Amounts are in GBP thousand except
ratios)
Tesco PLC Sainsbury PLC
Year 2018 Year 2019 Year 2018 Year 2019
Current Ratio
Current Assets 13726000 12668000 7857000 7550000
Current Liabilities 19238000 20680000 10302000 11849000
Current Ratio = Current Assets / Current
Liabilities
0.713484 0.612573 0.762667443 0.637185
Quick Ratio
Quick Asset 11463000 10051000 7857000 7550000
Paraphrase This Document
Need a fresh take? Get an instant paraphrase of this document with our AI Paraphraser

Current Liabilities 19238000 20680000 10302000 11849000
Quick Ratio = Quick Assets / Current
Liabilities
0.595852 0.486025 0.762667443 0.637185
Net Profit Margin
Net Profit 1206000 1322000 291000 168000
Sales 57491000 63911000 28456000 29007000
Net Profit Margin = Net Profit / Sales *100 2.09772 2.068502 1.022631431 0.579171
Gross Profit Margin
Gross Profit 3350000 4144000 544000 620000
Sales 57491000 63911000 28456000 29007000
Gross Profit Margin = Gross Profit / Sales
*100
5.826999 6.484017 1.911723362 2.137415
Gearing ratios
Long term Liabilities 15144000 13509000 2552000 7607000
Capital Employed 10480000 14858000 7411000 7782000
Gearing Ratio = Long term Liabilities / CE
* 100
144.5038 90.92072 34.44 97.75
P/E ratio
Price 197.4 255.1 260 229.2
Earnings per Share 0.44 0.39 12.54 6.79
PE Ratio = Price / EPS 448.6364 654.1026 20.73365231 33.75552
Earnings per share
Total net profit 1206000 1322000 291000 168000
Total no. of outstanding shares 2731000 3253000 243700 245700
EPS = Net Profit / Total no. outstanding 0.441596 0.406394 1.194091096 0.683761

shares
Return on capital employed
EBIT 1564000 2077000 544000 620000
CE 10480000 14858000 7411000 7782000
ROCE = EBIT / CE 14.92366 13.979 7.340439887 7.967104
Average inventories turnover period
Net Sales 57491000 63911000 28456000 29007000
Average inventories 2282000 2440000 1792500 1869500
Average inventories turnover period = Net
Sales / Average Inventory
25.19325 26.19303 15.87503487 15.51591
Dividend pay-out ratio
DPS 0.03 0.11 9.7 10.2
EPS 0.44 0.39 12.54 6.79
Dividend pay-out ratio = DPS / EPS 0.068182 0.282051 0.773524721 1.502209
B. Detailed examination and analysis of the ratios that are calculated above so that a clearer
picture of the positioning of both the firms can be analysed in an impactful manner
⊘ This is a preview!⊘
Do you want full access?
Subscribe today to unlock all pages.

Trusted by 1+ million students worldwide

Current Ratio- It is a ratio that is very useful and important for every company that is
operating in the market as it helps in determining the liquidity of the company that is the short
term paying capacity of the organisation so as to analyse that it is able to pay off its liabilities
that are of current nature in an appropriate manner or not. From the above it can be seen that both
the enterprises are operating on almost a similar scale but it can be said that Sainsbury is an edge
ahead over Tesco as in both the years the ratio of the earlier is more as in 2018 it was 0.76 as
compared to 0.71 and in 2019 it was 0.64 as compared with 0.61 (Cabello, Gaio and Watrin,
2019).
Quick Ratio- It is a ratio in which short term repaying capacity of the firm is analysed
and evaluated so that it can help the company to take necessary decisions which can help it to
grow and prosper in the long run. As it can be seen from the above that Tesco is performing a
little better than Sainsbury in this aspect as this ratio of it is little more than that of the latter firm
as in 2018 it was 0.60 as compared to that of 0.59 of Sainsbury and in 2019 it was 0.49 as
compared with 0.47 of Sainsbury and thus Tesco is well placed in the market (Cardoso, Peixoto
and Barboza, 2019).
Paraphrase This Document
Need a fresh take? Get an instant paraphrase of this document with our AI Paraphraser

Net Profit Margin- This ratio helps to measure the profit margin of the firm so as to
evaluate that the firm is operating in profitability or not so that appropriate measures can be
further taken in this respect. From the above it can be clearly seen that Tesco is performing
exceptionally well in this aspect as compared with Sainsbury as the profit margin of Tesco was
2.10 and 2.07 for 2018 and 2019 while it was 1.02 and 0.58 for Sainsbury in 2018 and 2019
respectively (Chaiyo and SUKSONGHONG, 2019).

Gross Profit Ratio- In this ratio gross profit margins are evaluated so that overall
performance of the company can be analysed in an impactful way so as to cater the needs,
requirements, and demands of all the prospective stakeholder of the enterprise. In this aspect too
Tesco is performing brilliantly as it has substantially increased its gross profit for the year 2018
in 2019 as compared to Sainsbury as it was 5.83 and 6.48 in 2018 and 2019 for Tesco whereas it
was 1.91 and 2.14 in 2018 and 2019 for Sainsbury (Chen and Lin, 2018).
Gearing ratio- It is a ratio that evaluated the liabilities of the company taking capital that
has been employed in the business as its base so as to analyse the true picture regarding the
performance of the capital of the company. Tesco has done commendably well in 2018 as its
gearing ratio was 144.50 as compared with 34.44 of Sainsbury for the similar year but in 2019
Sainsbury overtook Tesco and managed to perform much better than that while Tesco was not
performed well as the ratio was 97.75 and 90.92 of Sainsbury and Tesco respectively and thus
the latter has to do a detailed study so that all the loop holes in the business can be find out and
rectified as soon as possible (Gupta, Mahakud and Verma, 2020).
⊘ This is a preview!⊘
Do you want full access?
Subscribe today to unlock all pages.

Trusted by 1+ million students worldwide

PE ratio- This ratio helps in determining the price that is prevailing in the current market
scenario and the earnings that the company is generating at a given period of time and it is very
important as it helps in increasing the value of the firm in the industry in which it is performing.
As it can be seen that Sainsbury is performing well in this aspect too as the ratio for it in 2018
was 20.73 as compared with Tesco’s 448.64 for the same period while it was 33.76 and 654.10
for Sainsbury and Tesco respectively in 2019 (Hu and Xue, 2018).
Paraphrase This Document
Need a fresh take? Get an instant paraphrase of this document with our AI Paraphraser

EPS- It is a very important as well as crucial and critical factor since it helps in attracting
stakeholders that are interested in the company’s shares as it determines the earnings that the
firm gives to its shareholders from the profits that it generated at a given time period. Since it can
be clearly seen from the above that Sainsbury is performing exceptionally well in this too as
earnings per share for it in 2018 was 1.1941 while it was 0.4416 for Tesco, whereas in 2019 it
was 0.6838 and 0.4064 for Sainsbury and Tesco respectively and can be analysed that the earlier
enterprise gives regular and higher returns to its shareholders as compared with the latter
(Hussain, Salia and Karim, 2018).
Return on Capital Employed- It is a ratio that evaluates the return capital employed of a
company is generating so that the rate can be analysed appropriately. Tesco is performing well in
this regard as its capital is getting higher return as compared with that of Sainsbury as in 2018
and 2019 it was 14.92, 7.34 and 13.98, 7.97 respectively and Tesco is much profitable as
compared to the latter in this aspect (Magerakis and Tzelepis, 2019).

Average stock turnover period- It is a period that is related with the debtors of the
company as in it number of days are analysed as well as evaluated for which the funds of the
organisation is struck with its debtors and it is preferable to keep it low as possible because the
amount can be used to keep the supply chain intact. Sainsbury is performing well in this as in
2018 and 2019 it was 15.88 and 15.52 as compared with 25.19 and 26.19 for the same period for
Tesco (Nikravesh, 2019).
⊘ This is a preview!⊘
Do you want full access?
Subscribe today to unlock all pages.

Trusted by 1+ million students worldwide
1 out of 19
Related Documents

Your All-in-One AI-Powered Toolkit for Academic Success.
+13062052269
info@desklib.com
Available 24*7 on WhatsApp / Email
Unlock your academic potential
Copyright © 2020–2025 A2Z Services. All Rights Reserved. Developed and managed by ZUCOL.