Finance Report: Ratio Analysis, Investment Appraisal Techniques
VerifiedAdded on 2023/01/06
|19
|4048
|39
Report
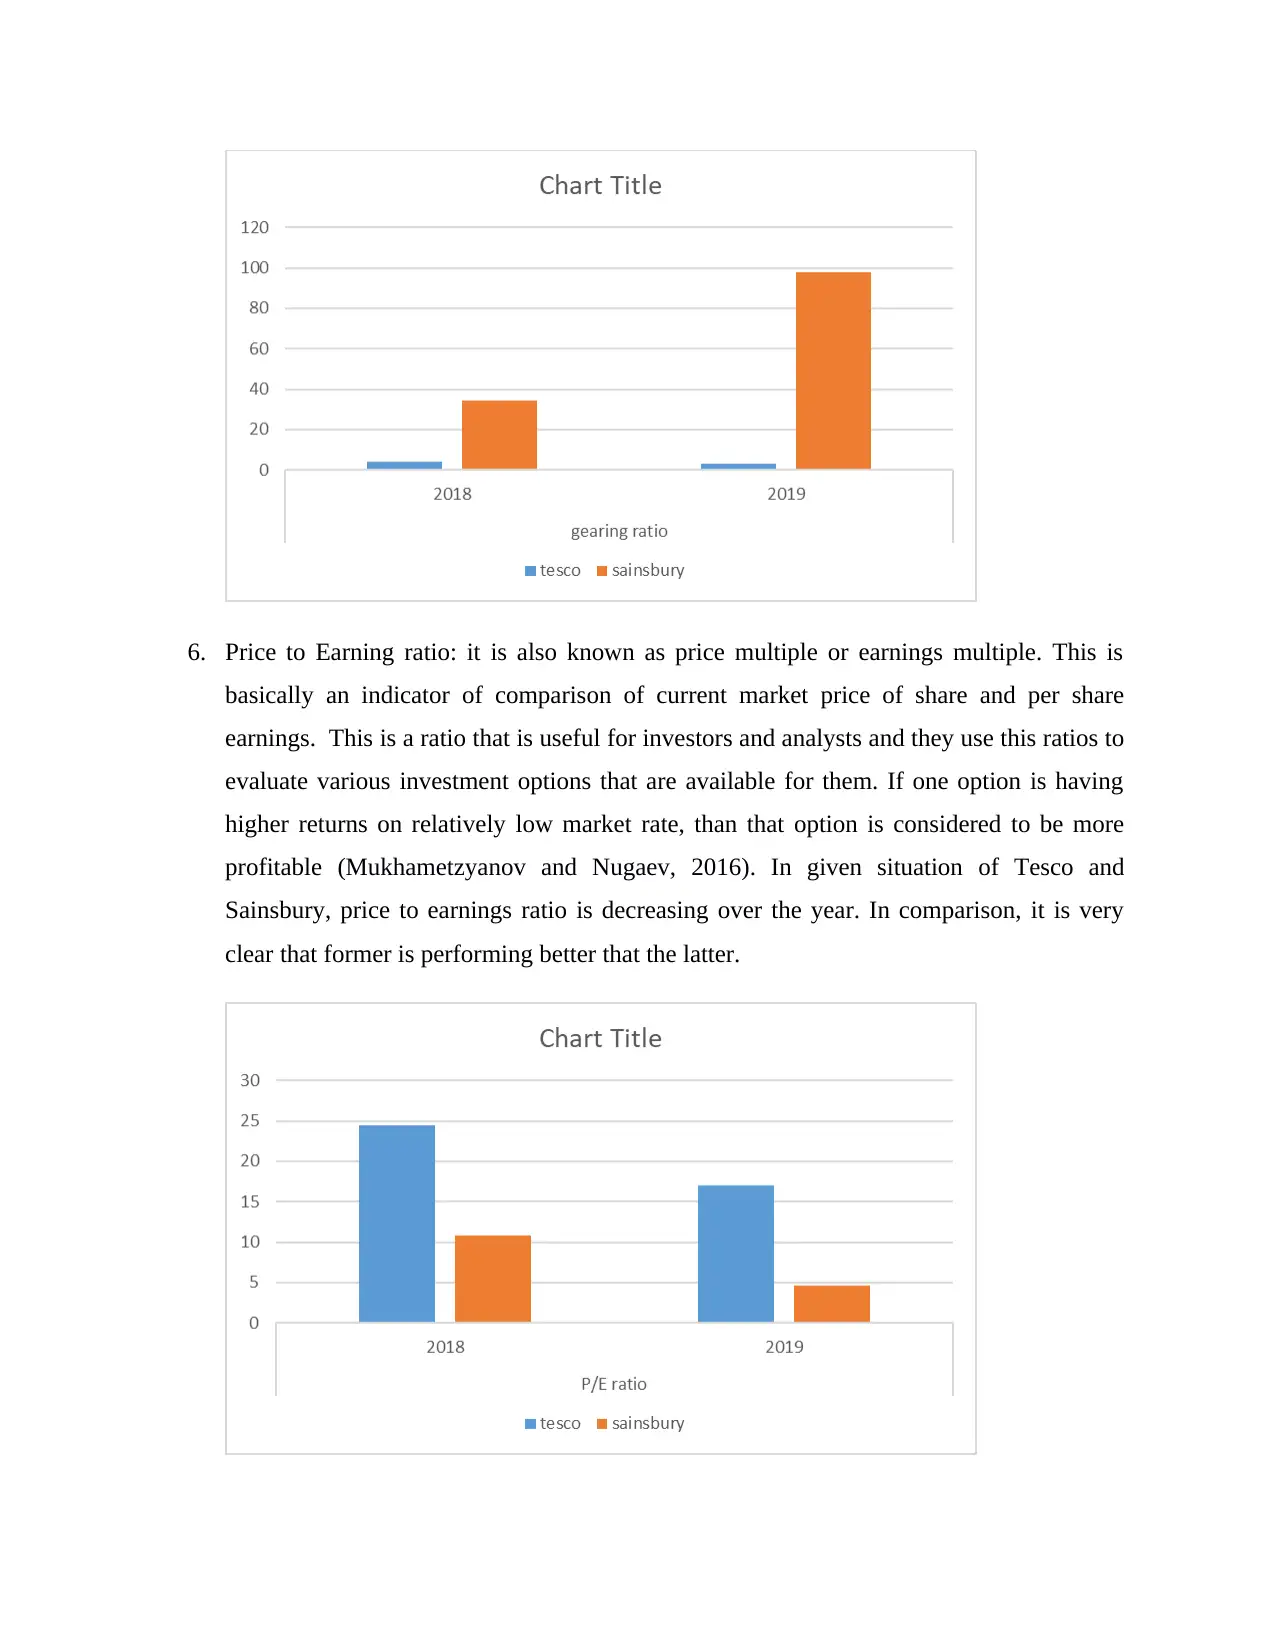
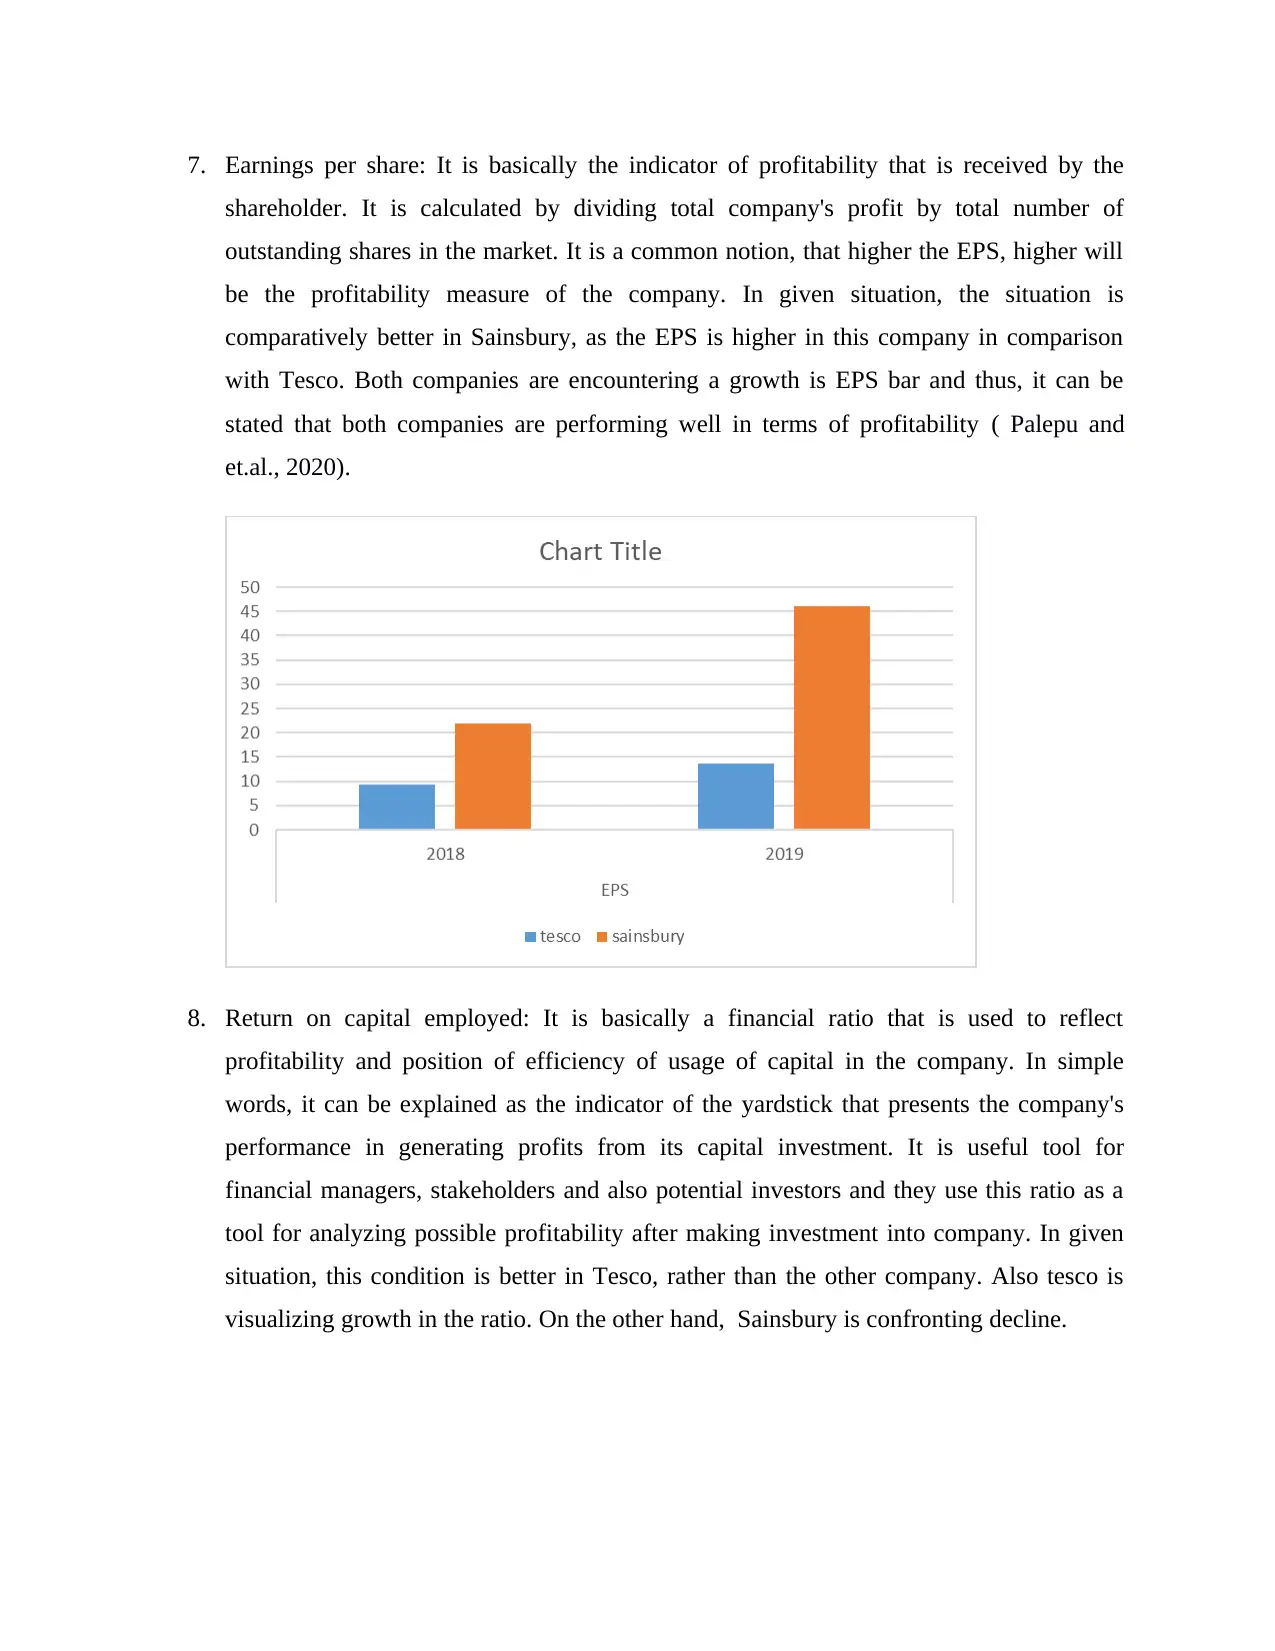
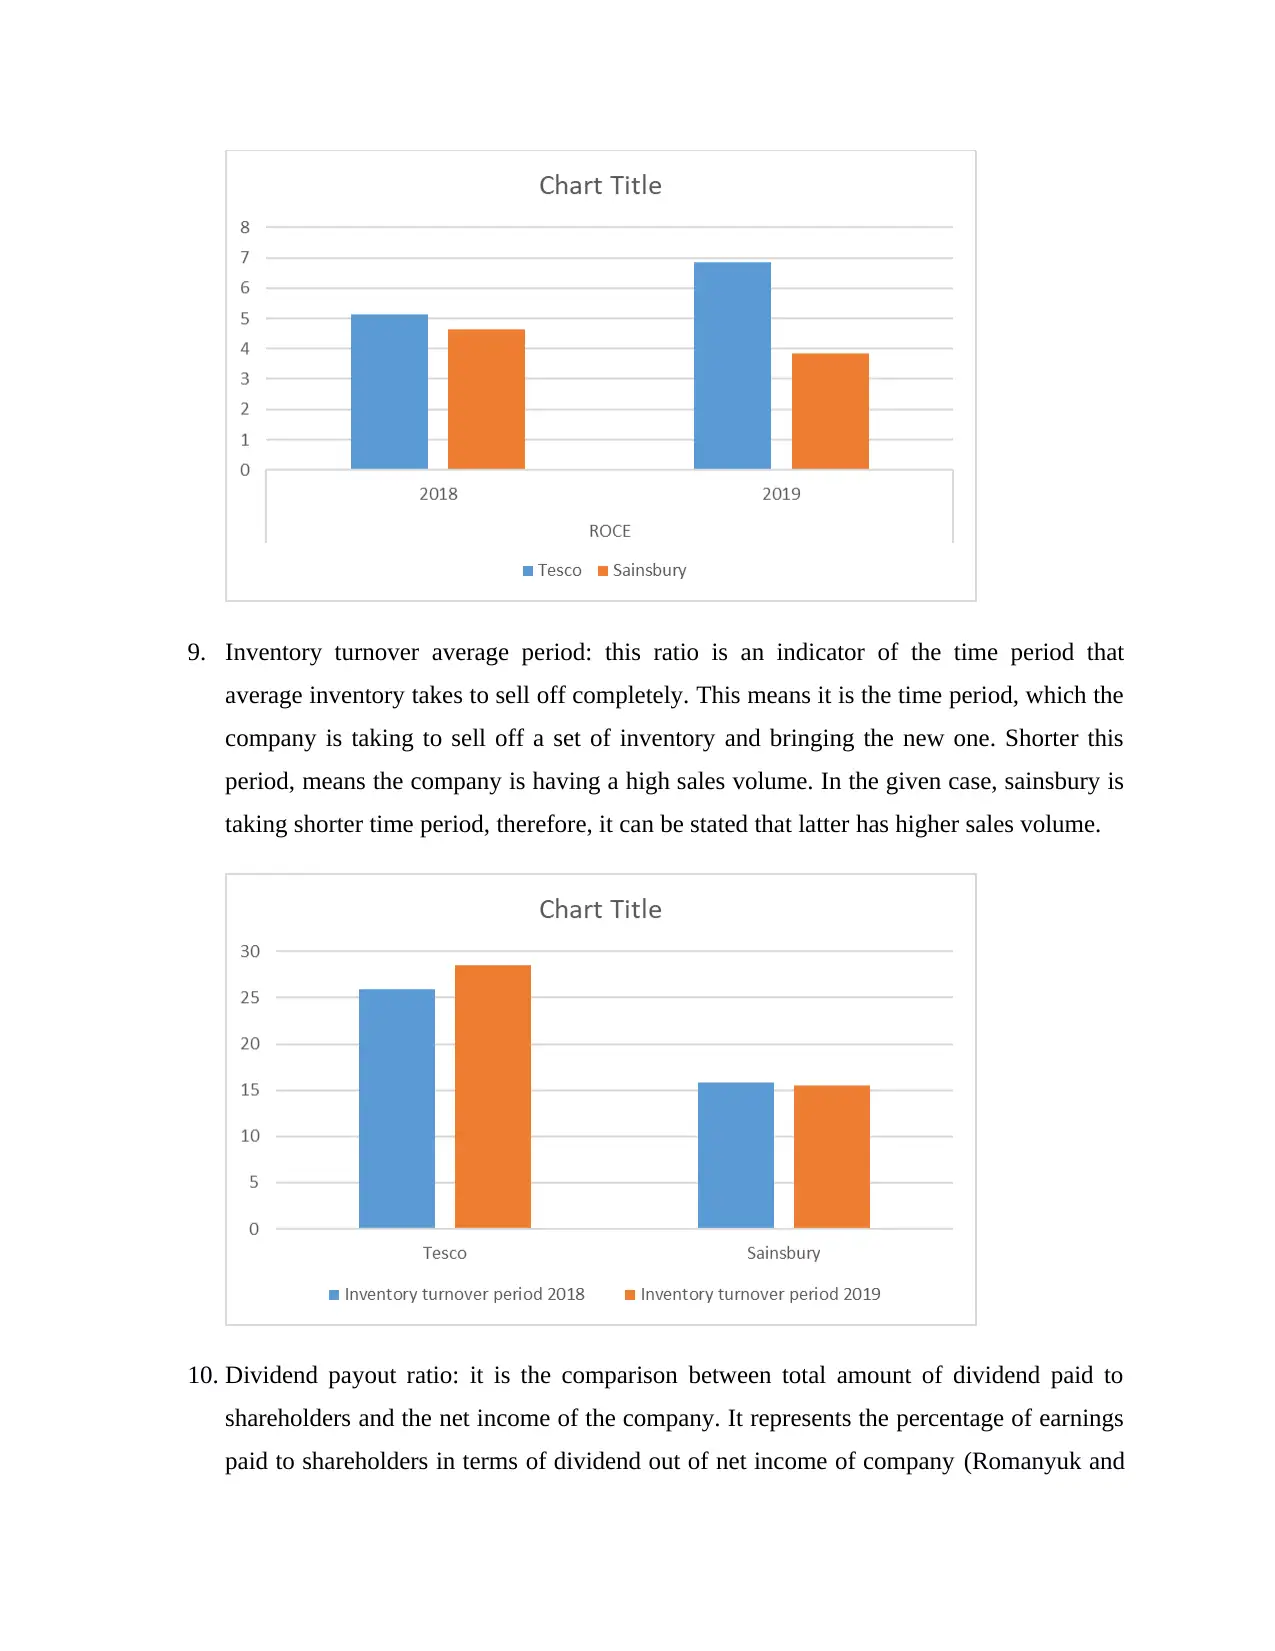
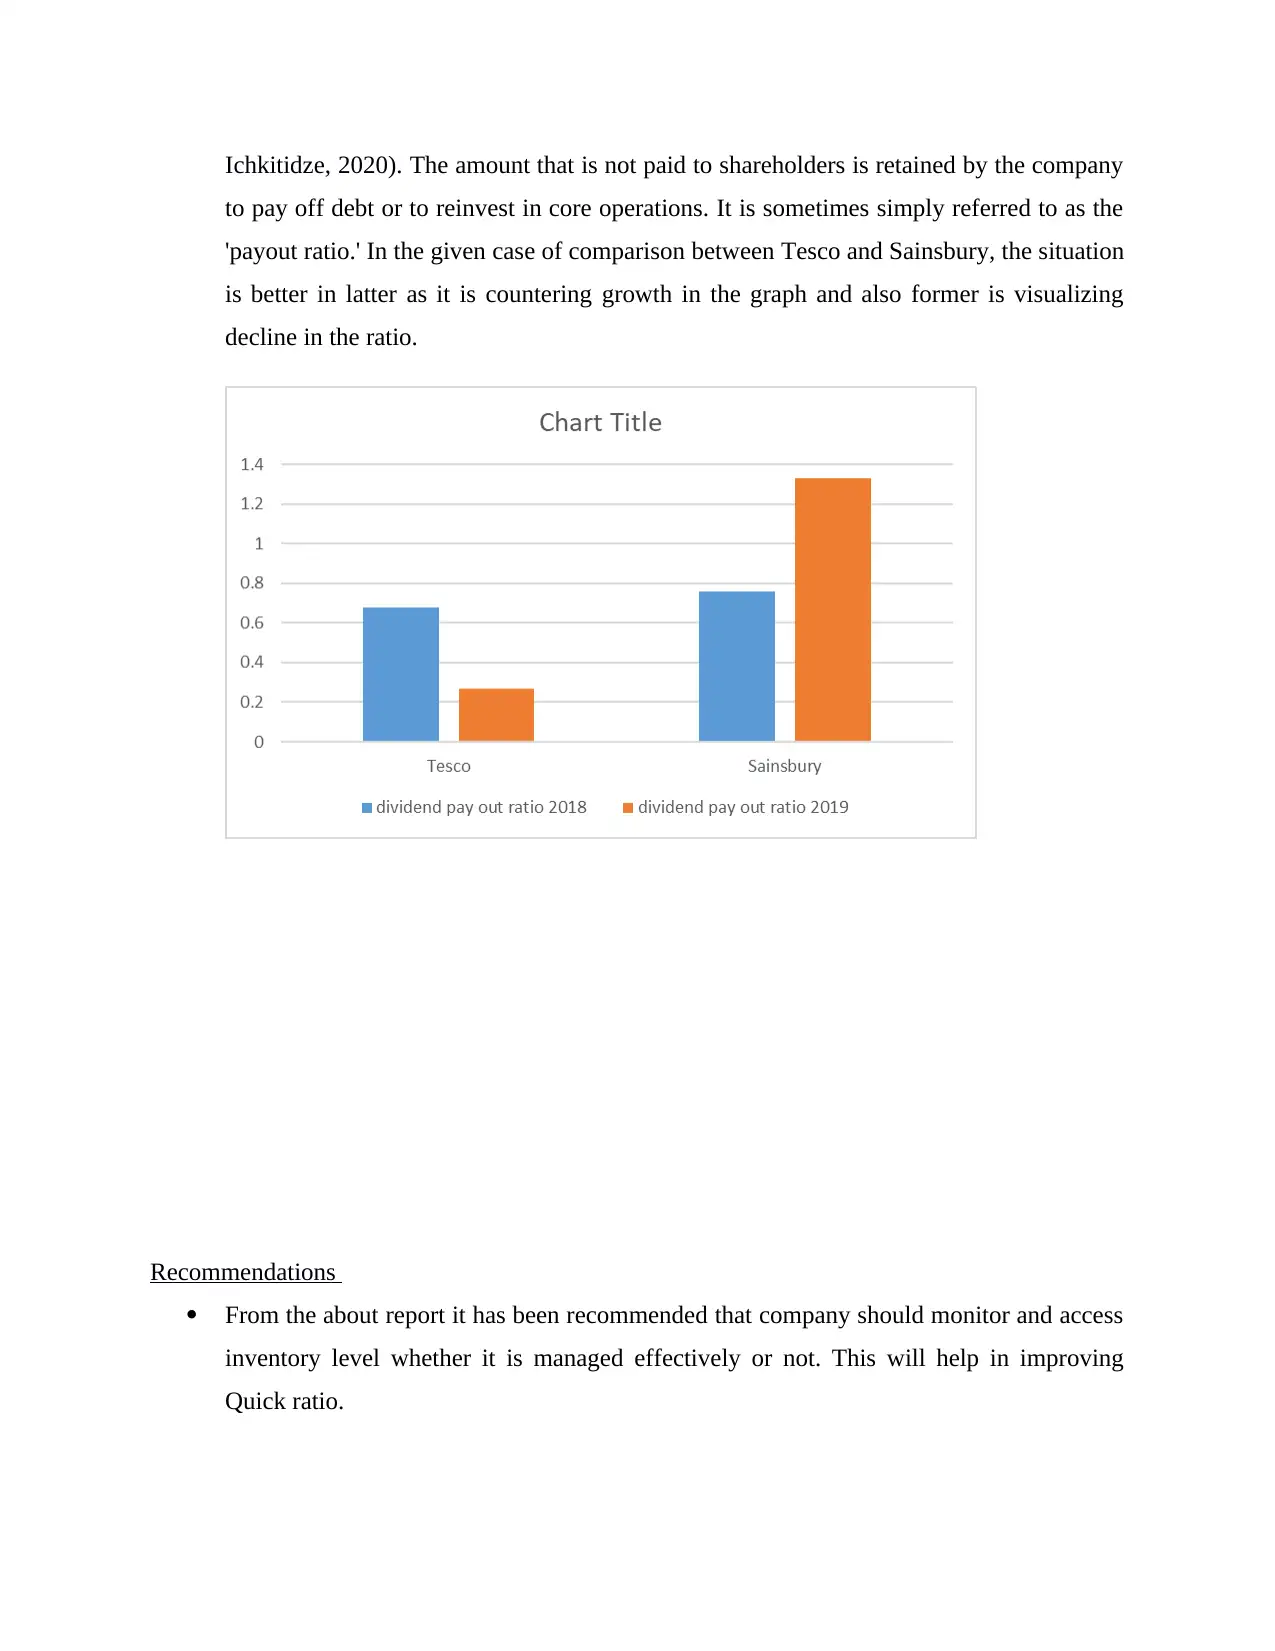
AI Summary
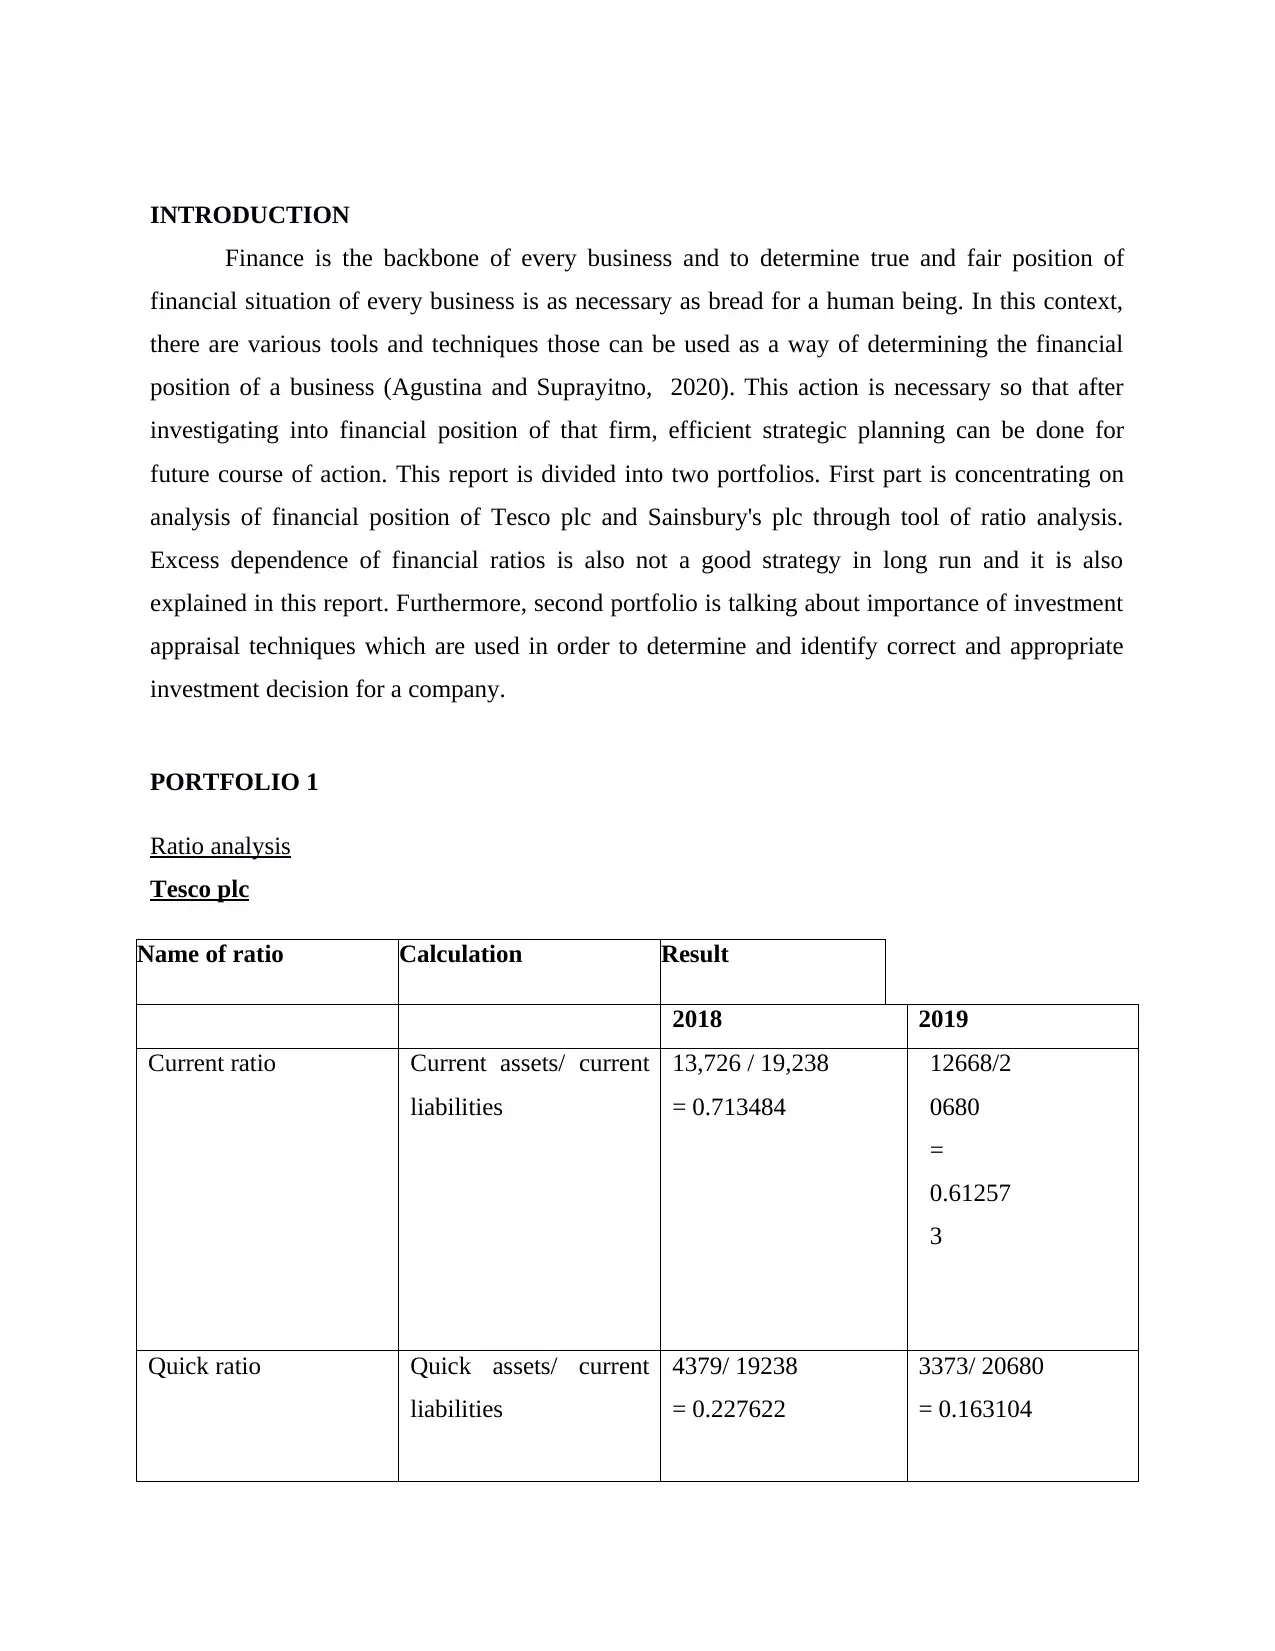
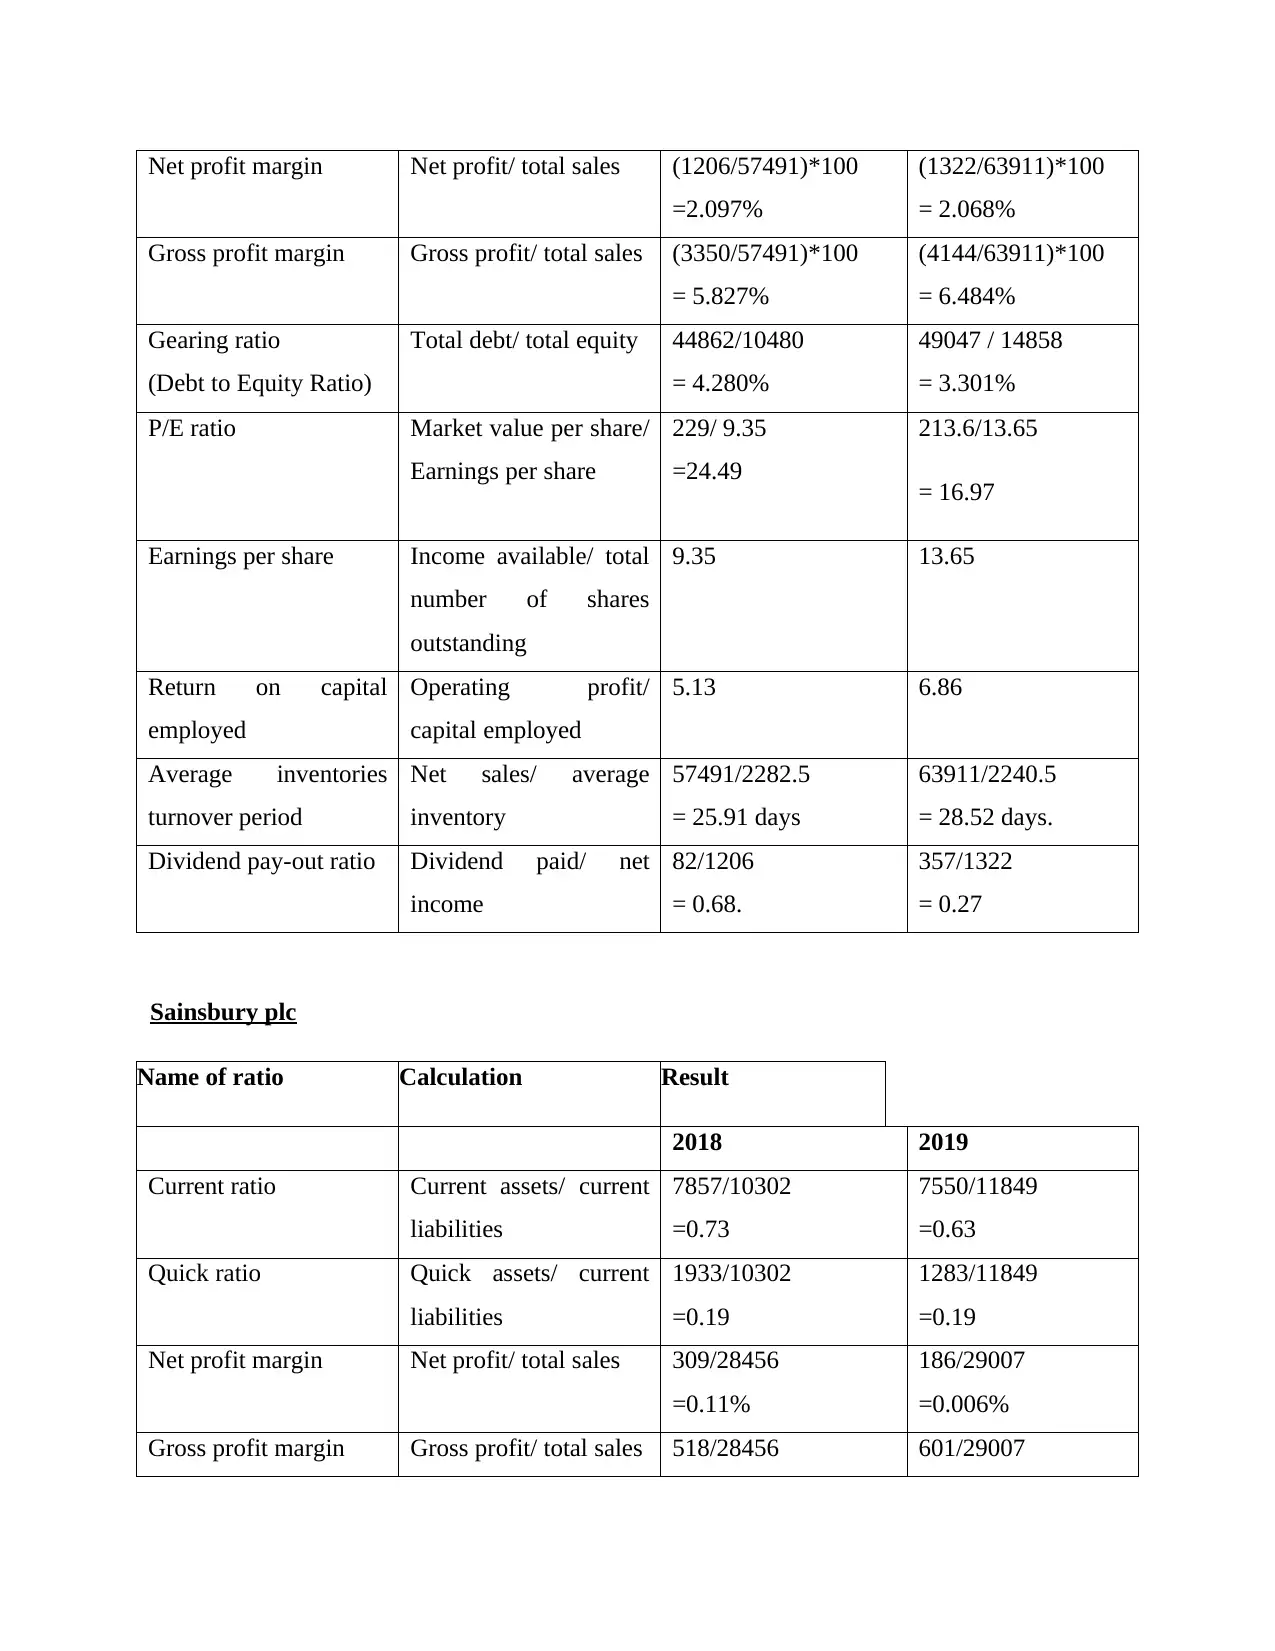
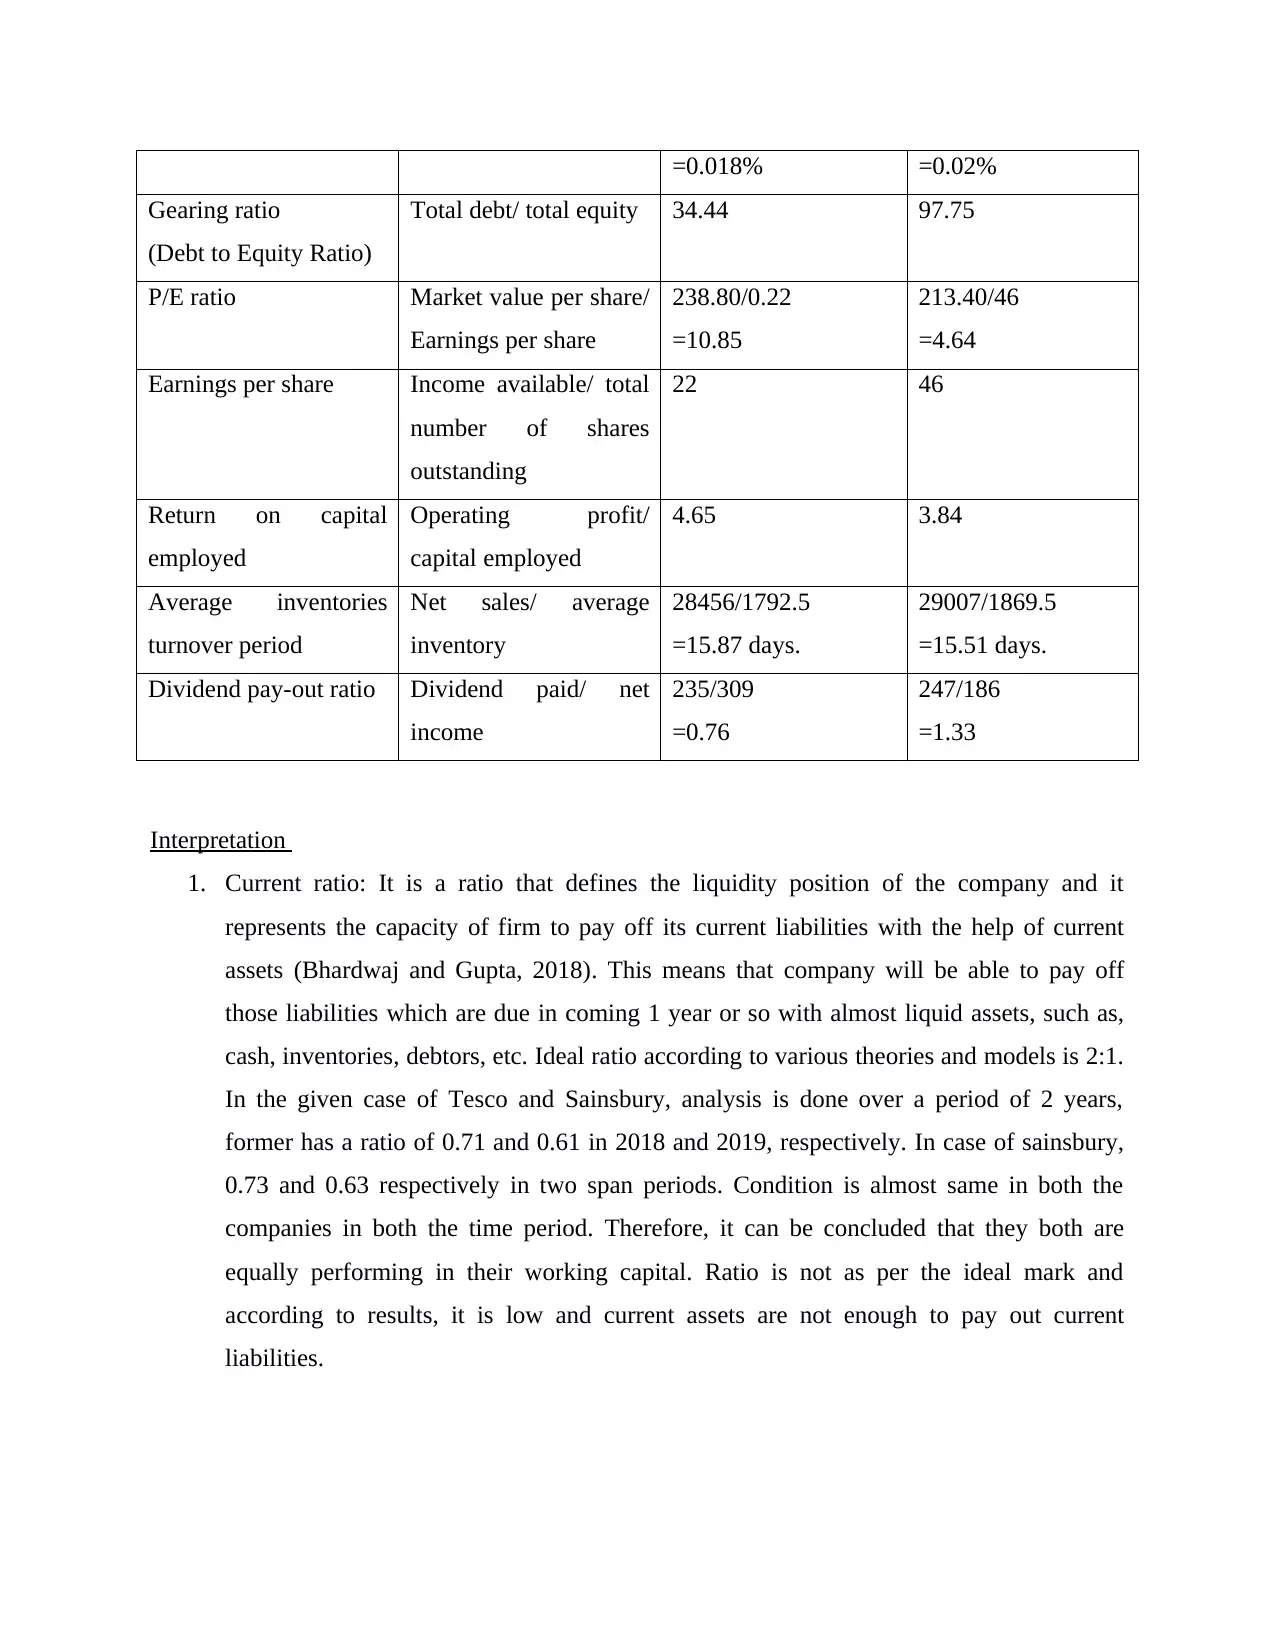
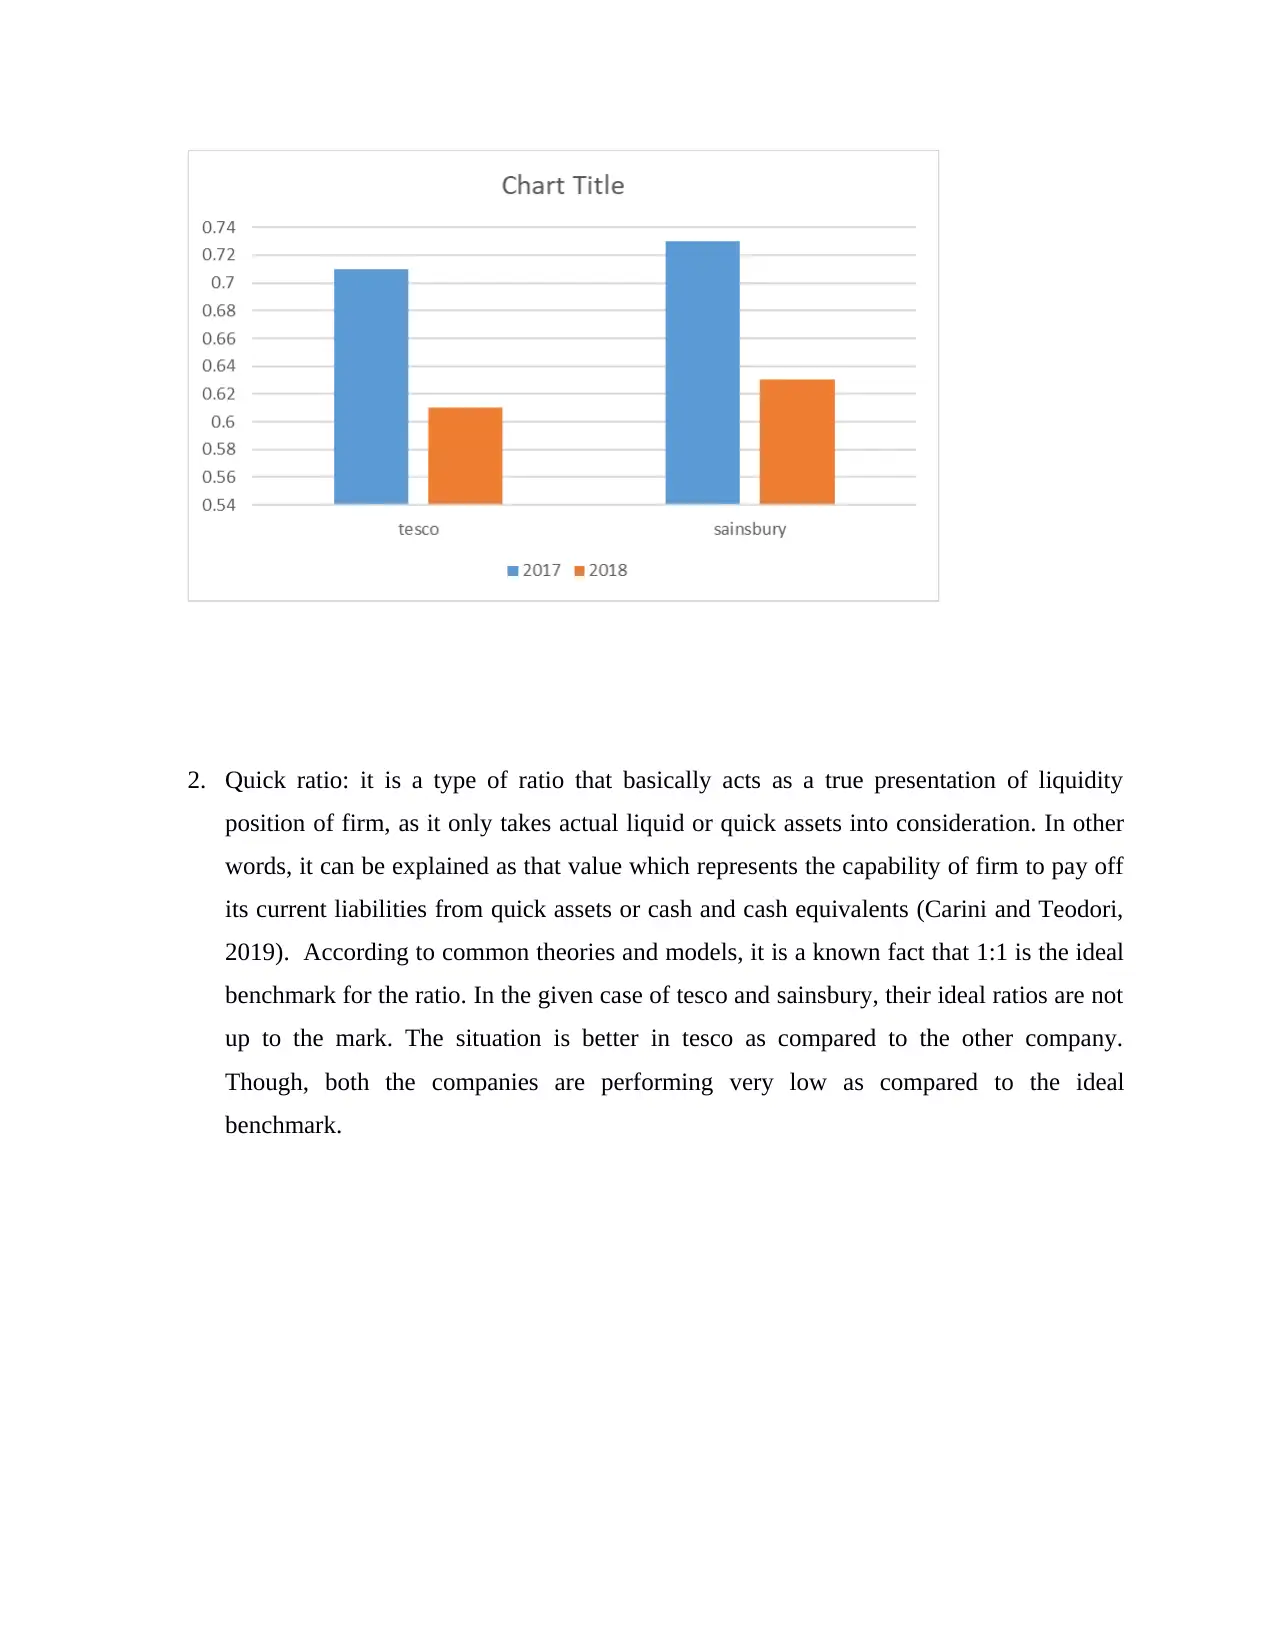
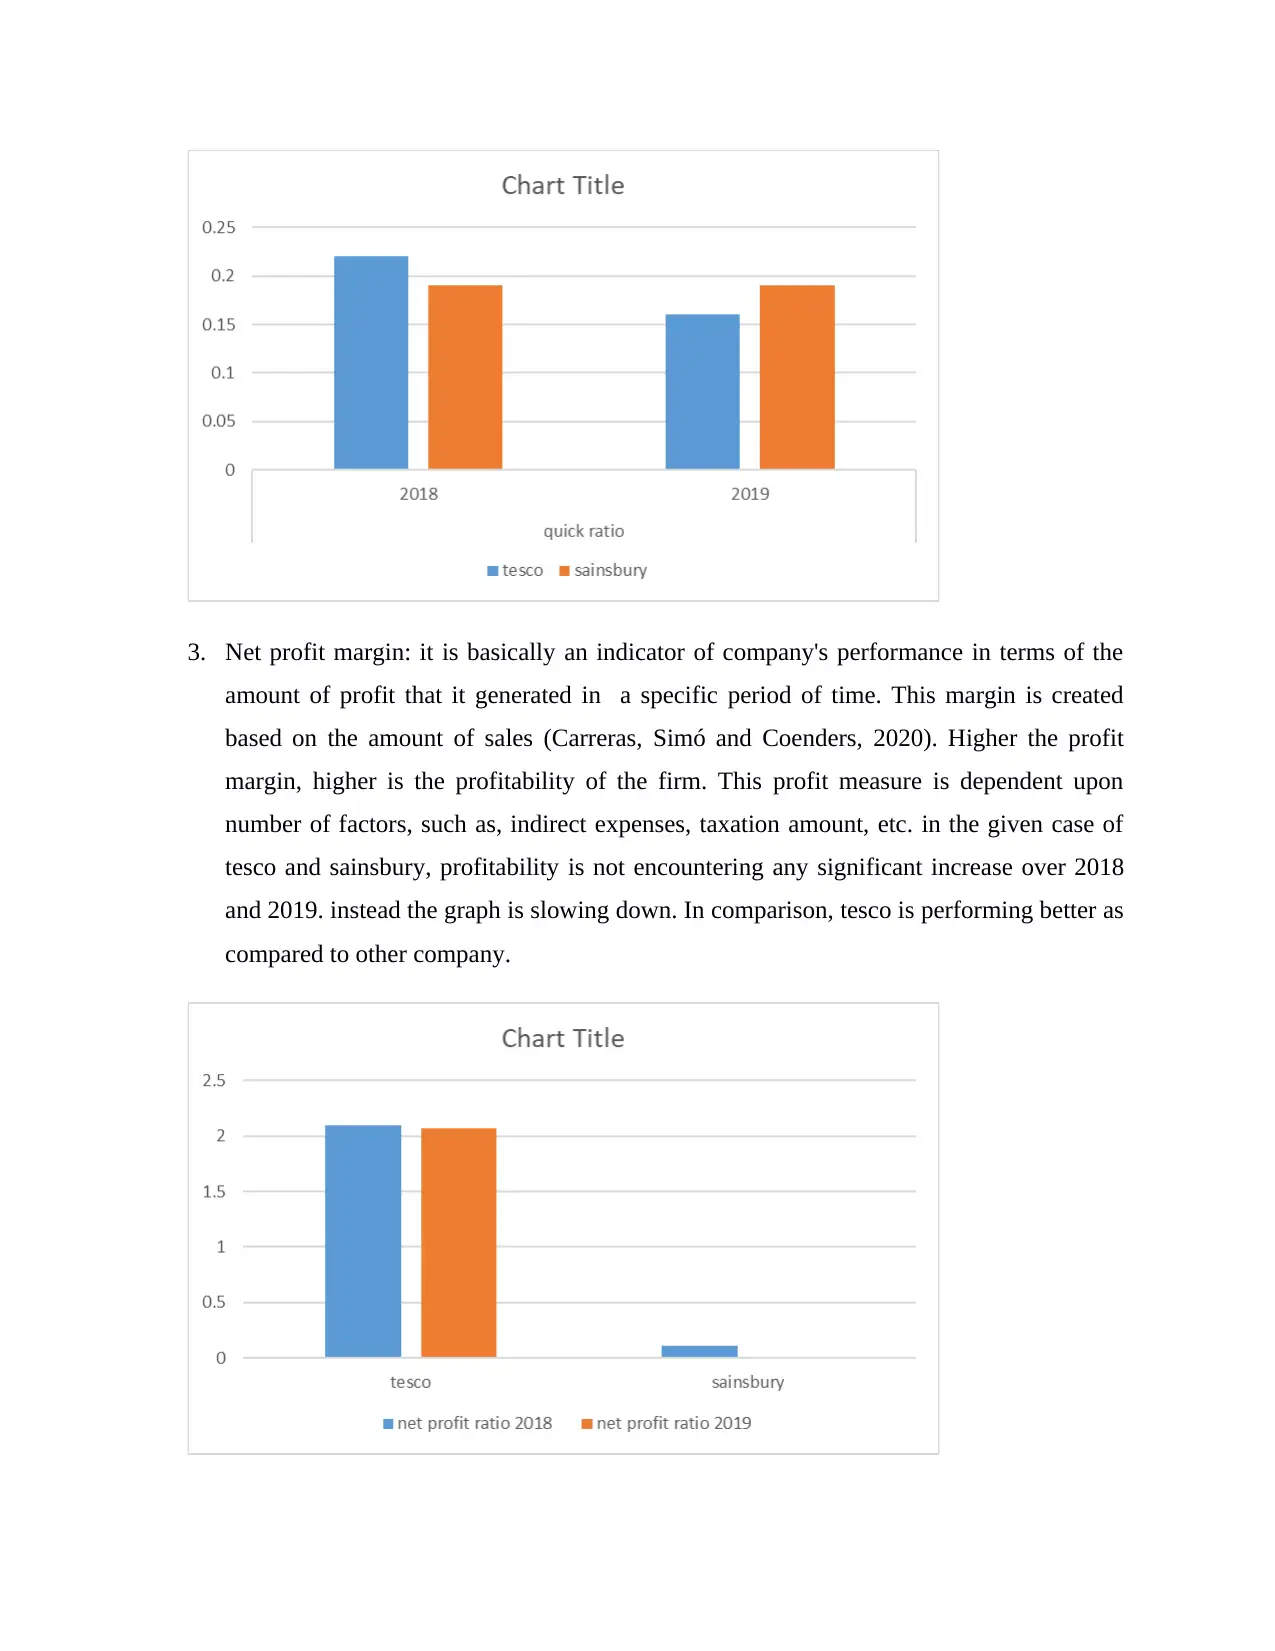
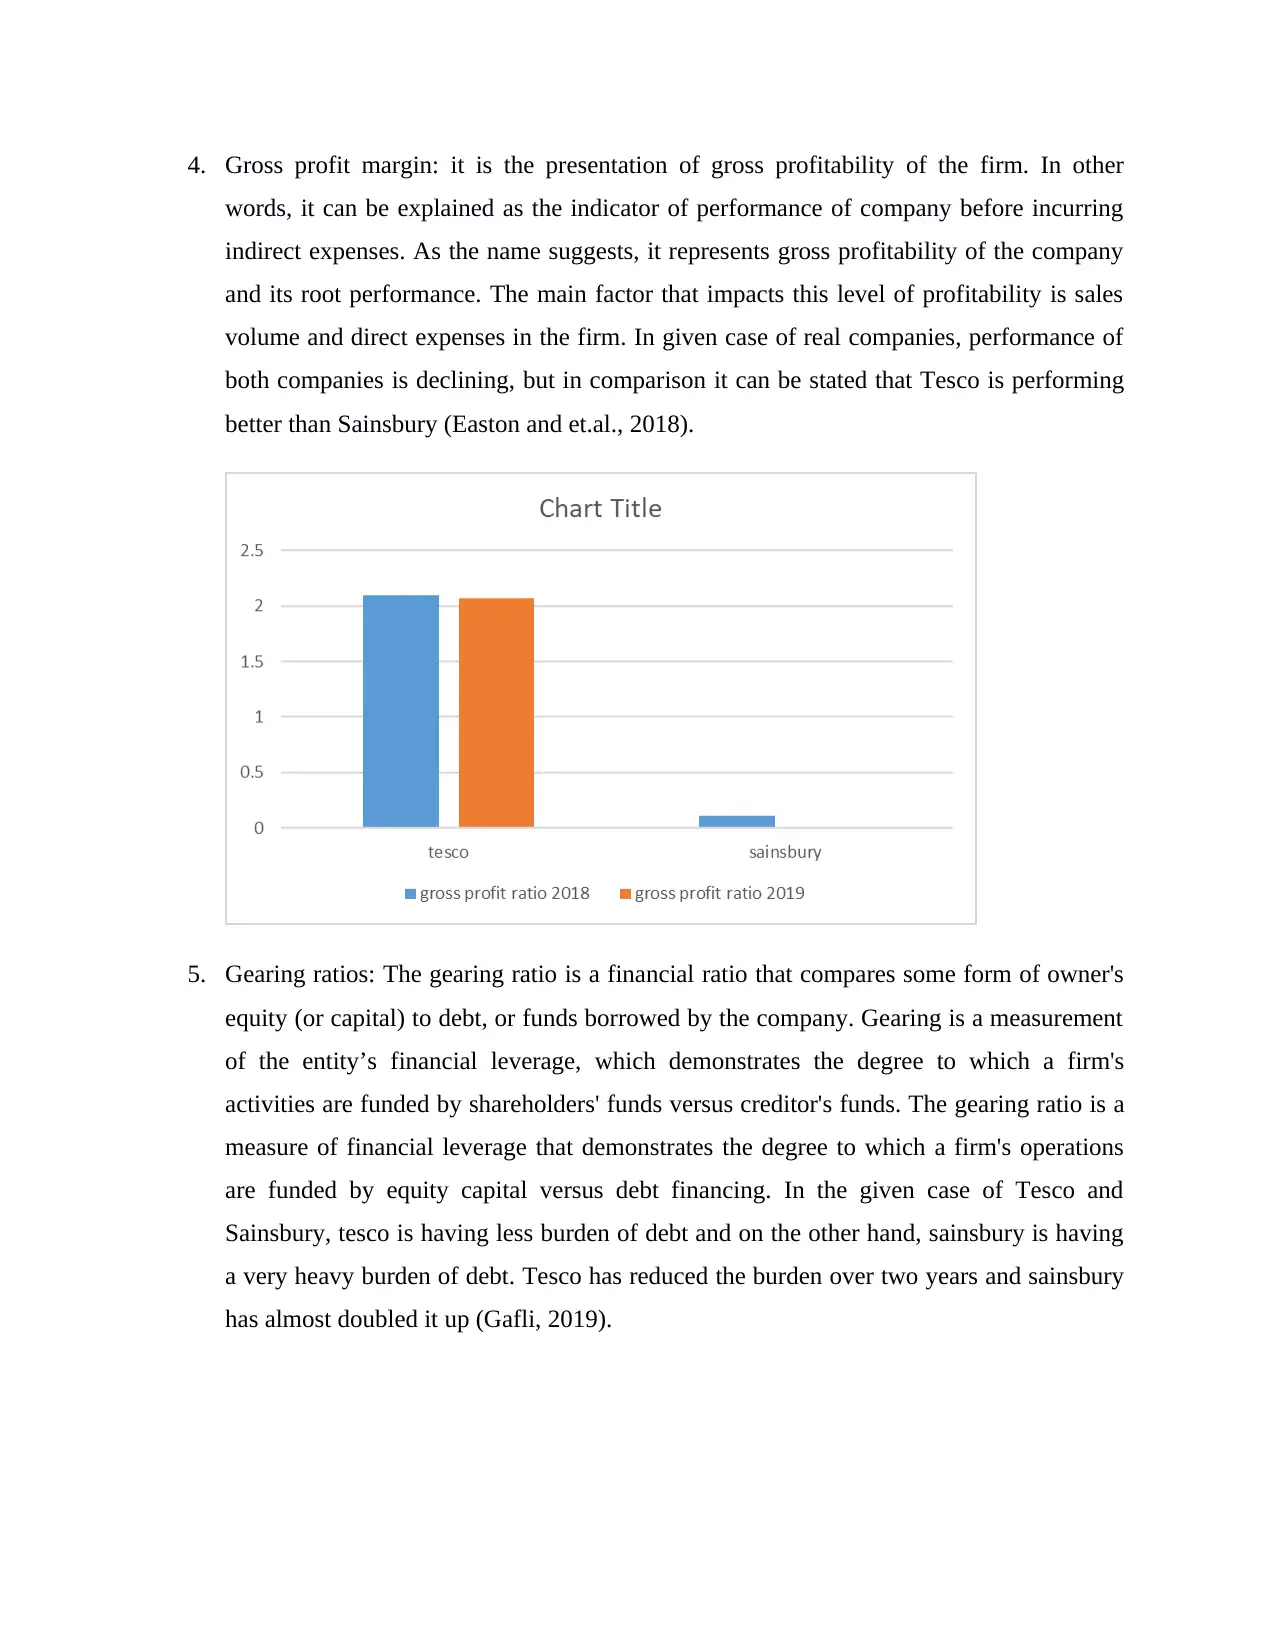
This finance report delves into the financial performance of Tesco plc and Sainsbury's plc through comprehensive ratio analysis. The report examines key financial ratios, including current ratio, quick ratio, net profit margin, gross profit margin, gearing ratio, price-to-earnings ratio, earnings per share, return on capital employed, inventory turnover, and dividend payout ratio, providing detailed interpretations and comparisons between the two companies over a two-year period. The report also discusses the limitations of ratio analysis and the importance of investment appraisal techniques in making informed investment decisions. Furthermore, the report offers recommendations for improving financial performance based on the ratio analysis findings. The second part of the report also covers investment appraisal techniques and their limitations in long-term decision making. The report concludes with a summary of the key findings and recommendations.
1 out of 19
Related Documents


Your All-in-One AI-Powered Toolkit for Academic Success.
+13062052269
info@desklib.com
Available 24*7 on WhatsApp / Email
![[object Object]](/_next/static/media/star-bottom.7253800d.svg)
Copyright © 2020–2026 A2Z Services. All Rights Reserved. Developed and managed by ZUCOL.