Financial Ratio Analysis and Investment Appraisal Techniques Report

Verified

Added on  2022/12/30

|19
|3889
|55
Report
AI Summary
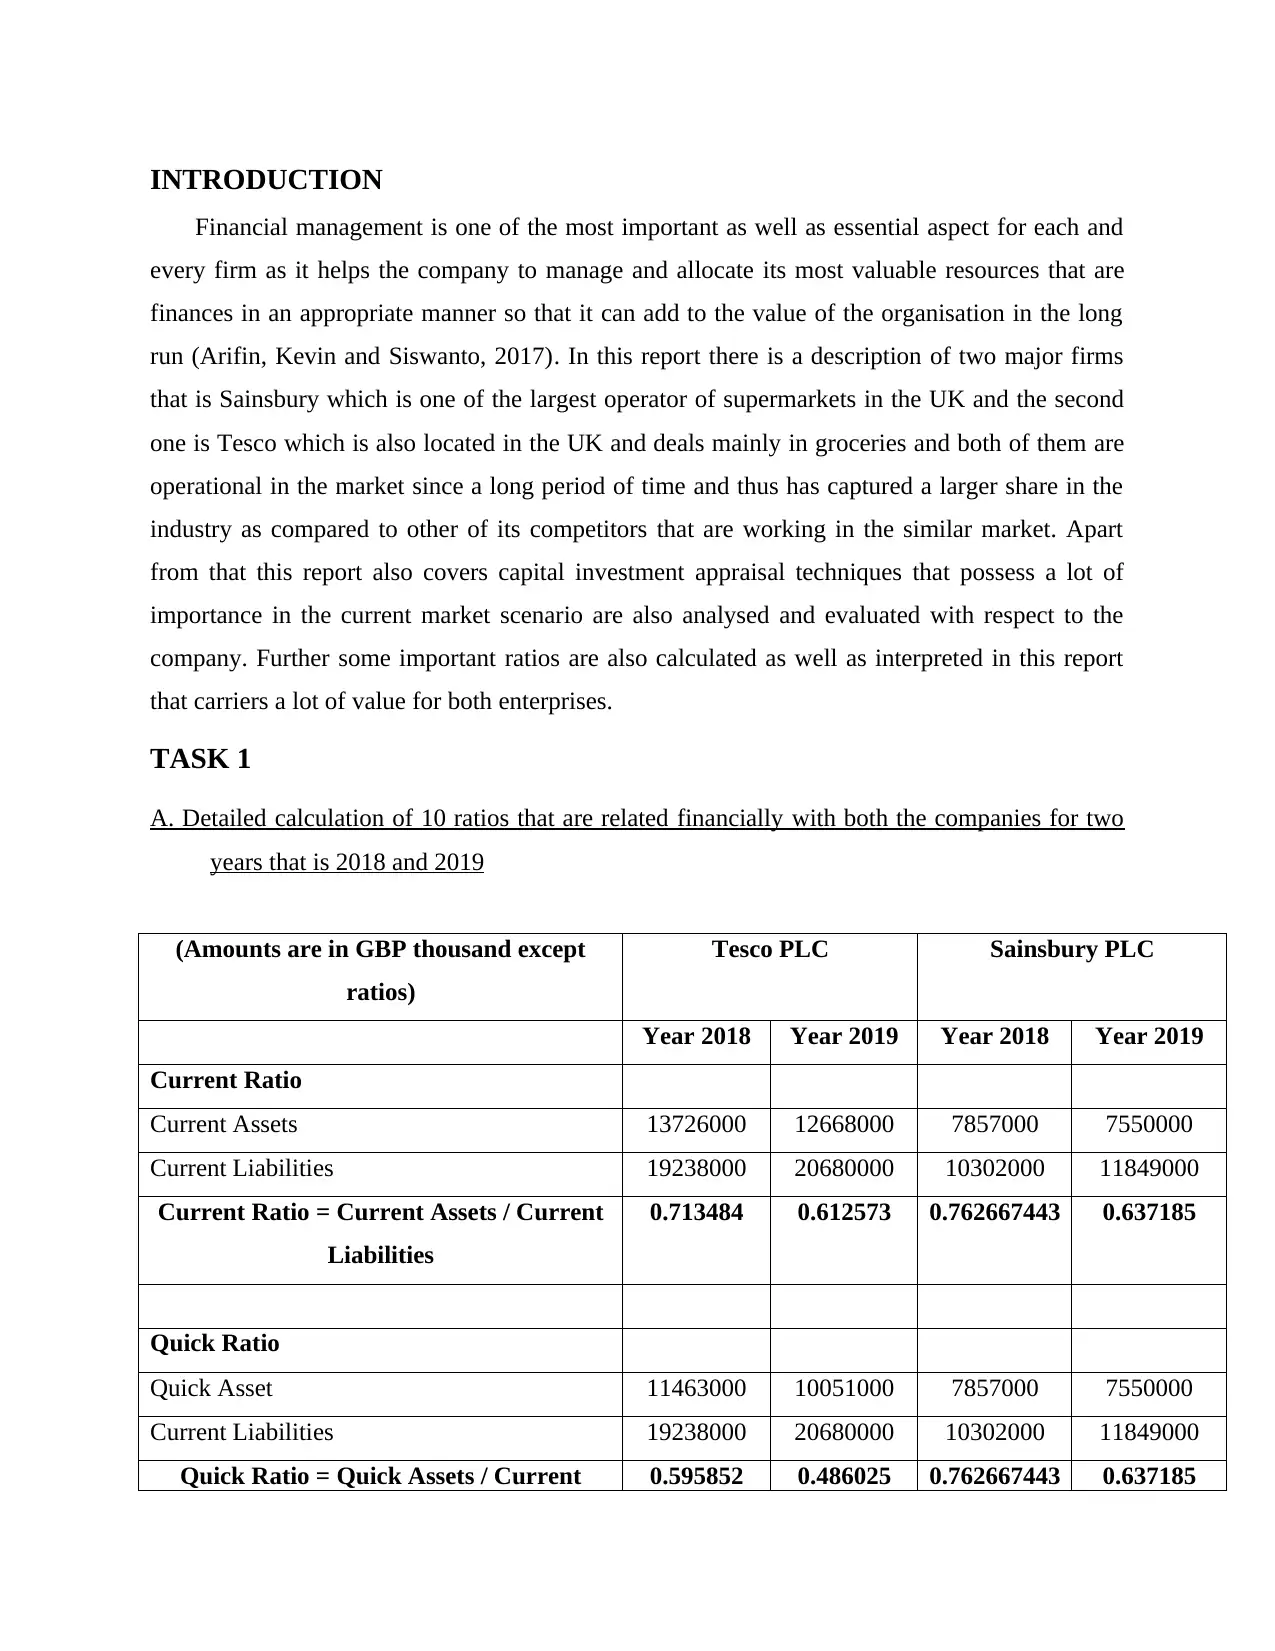
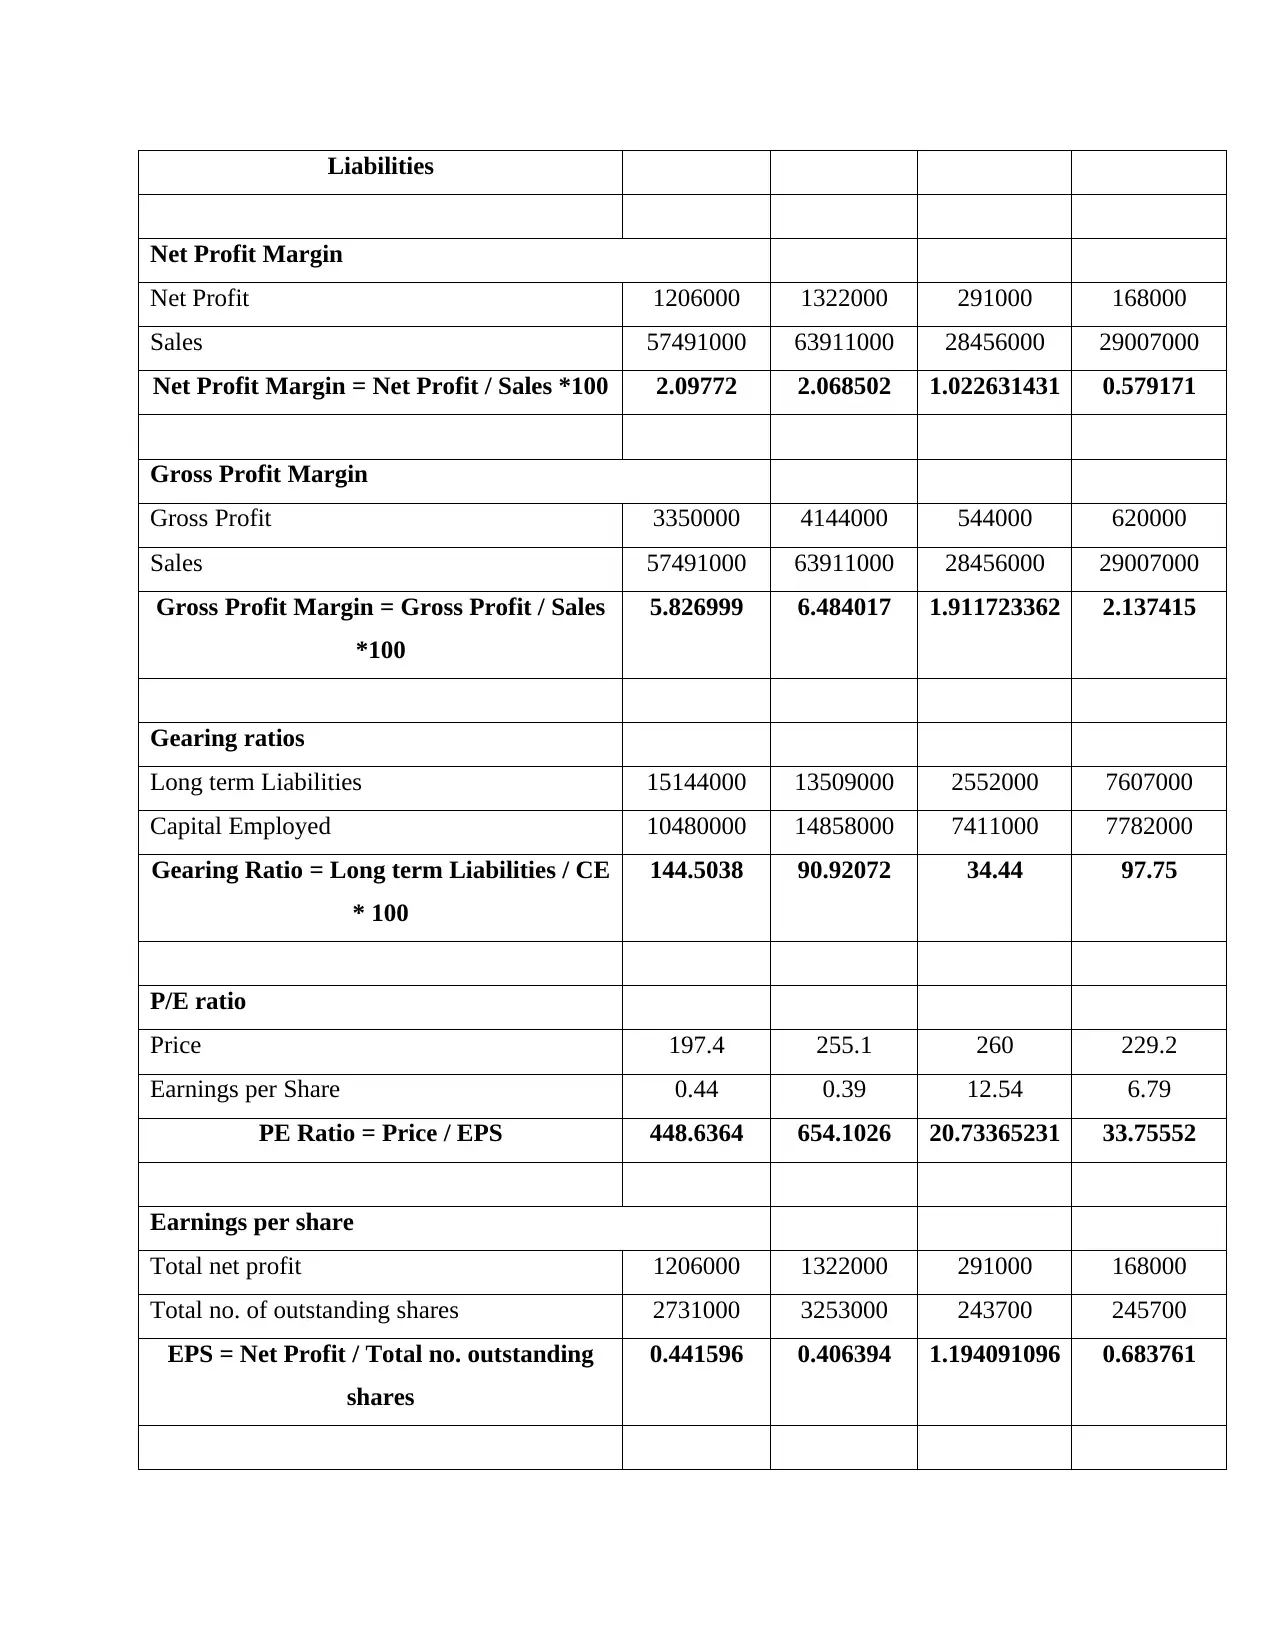
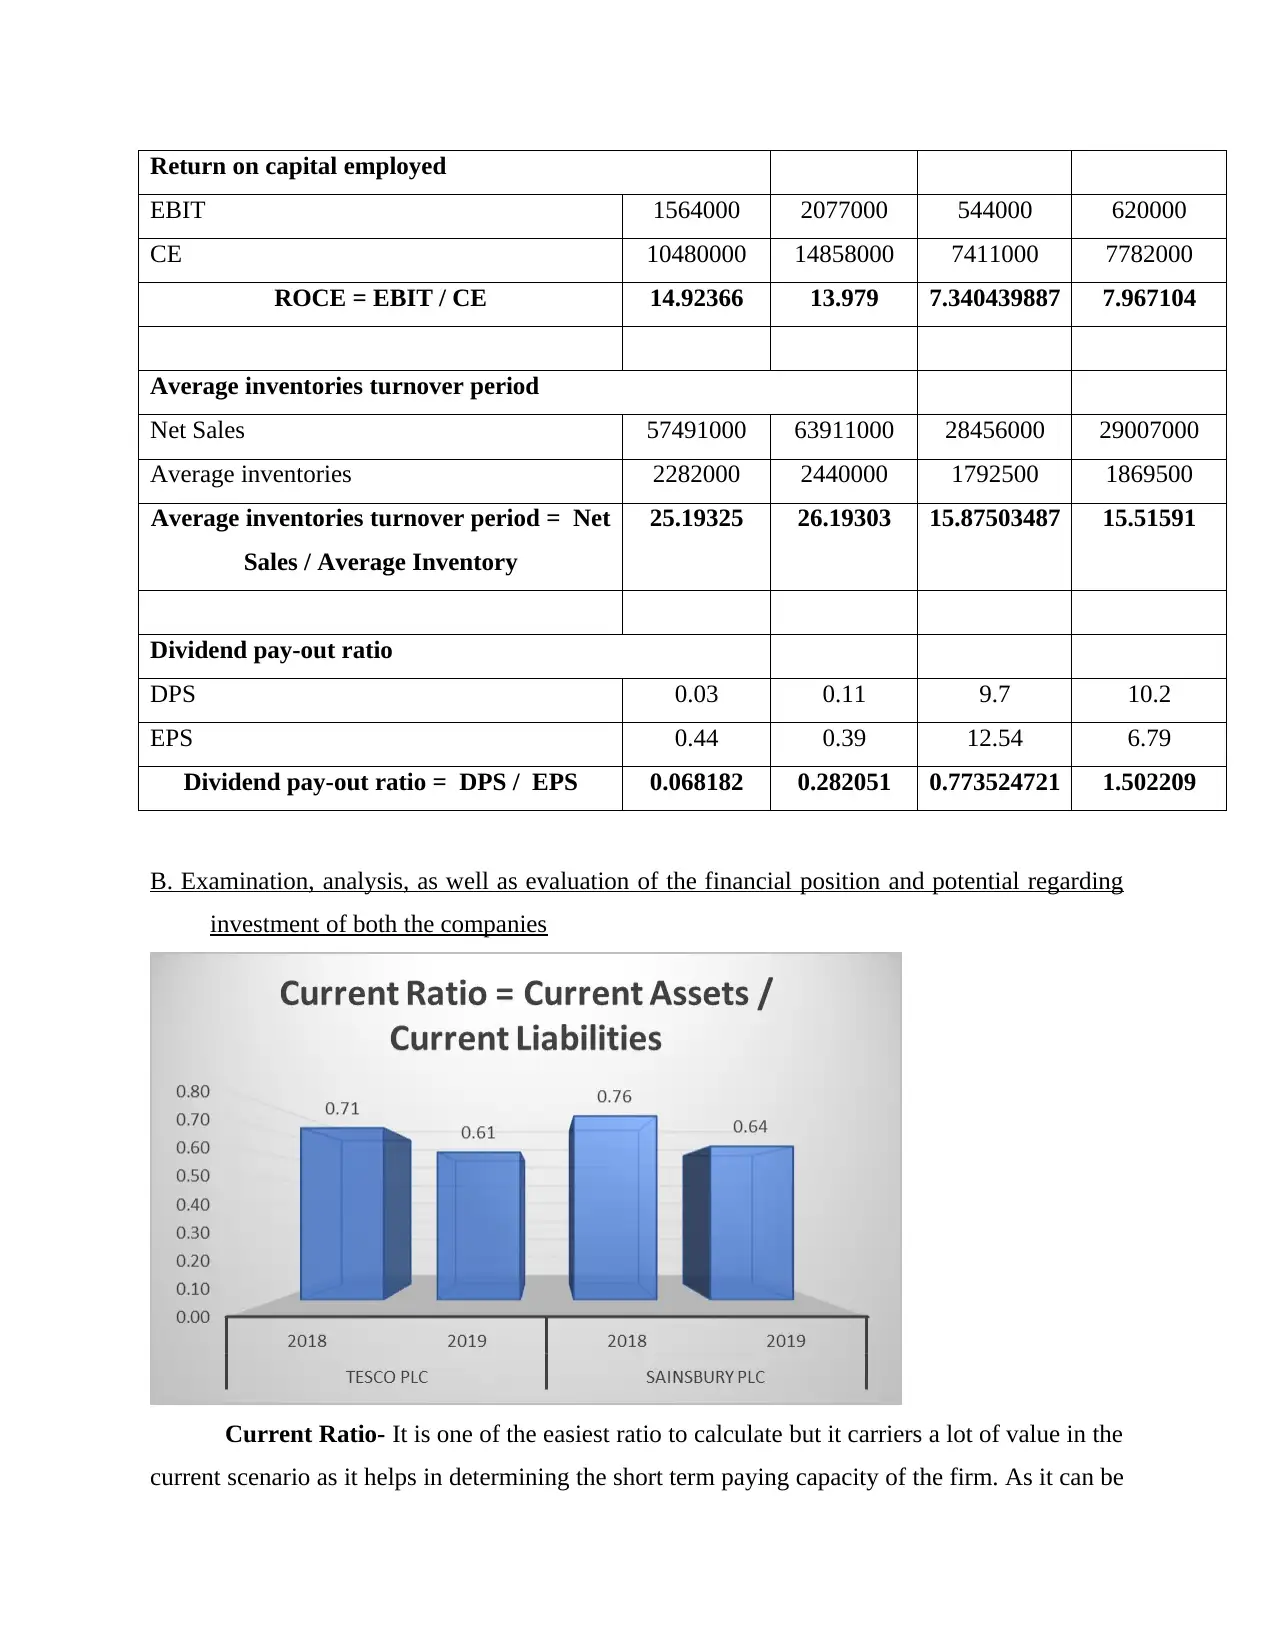
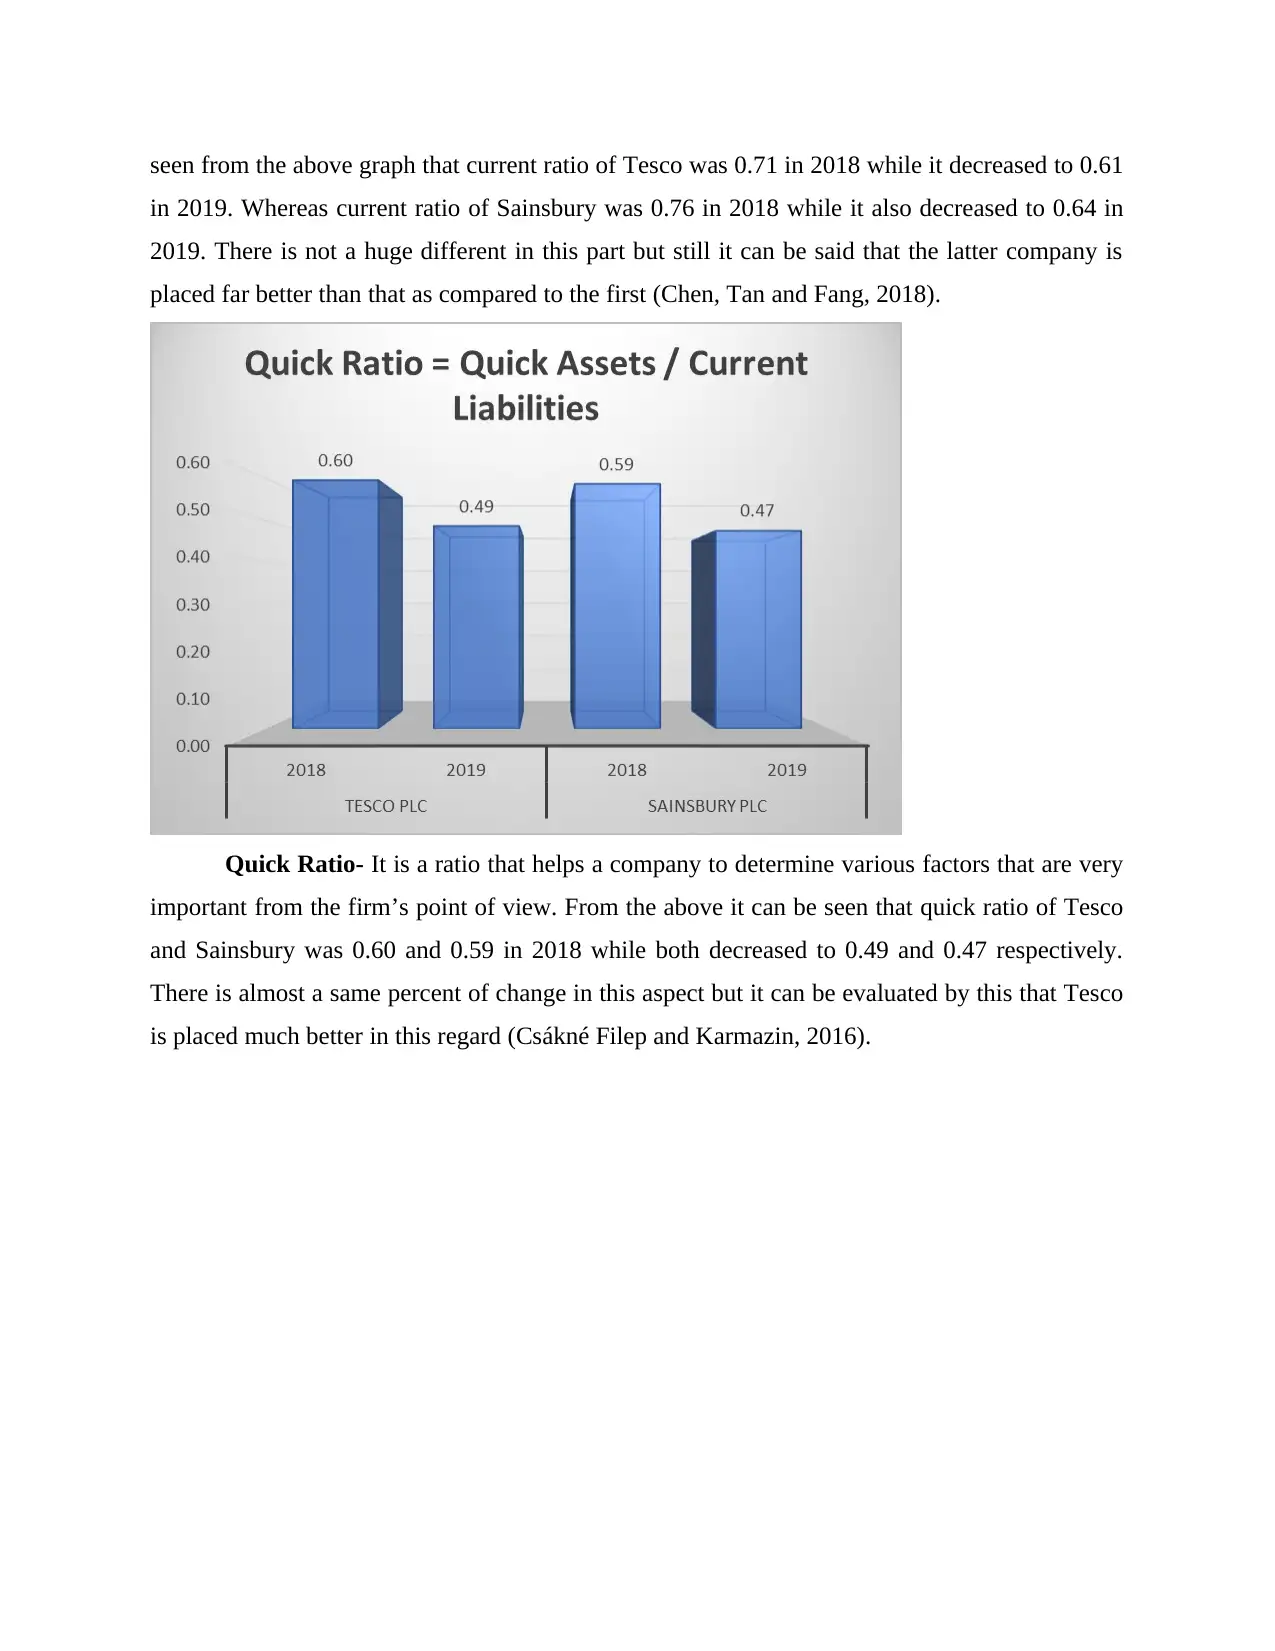
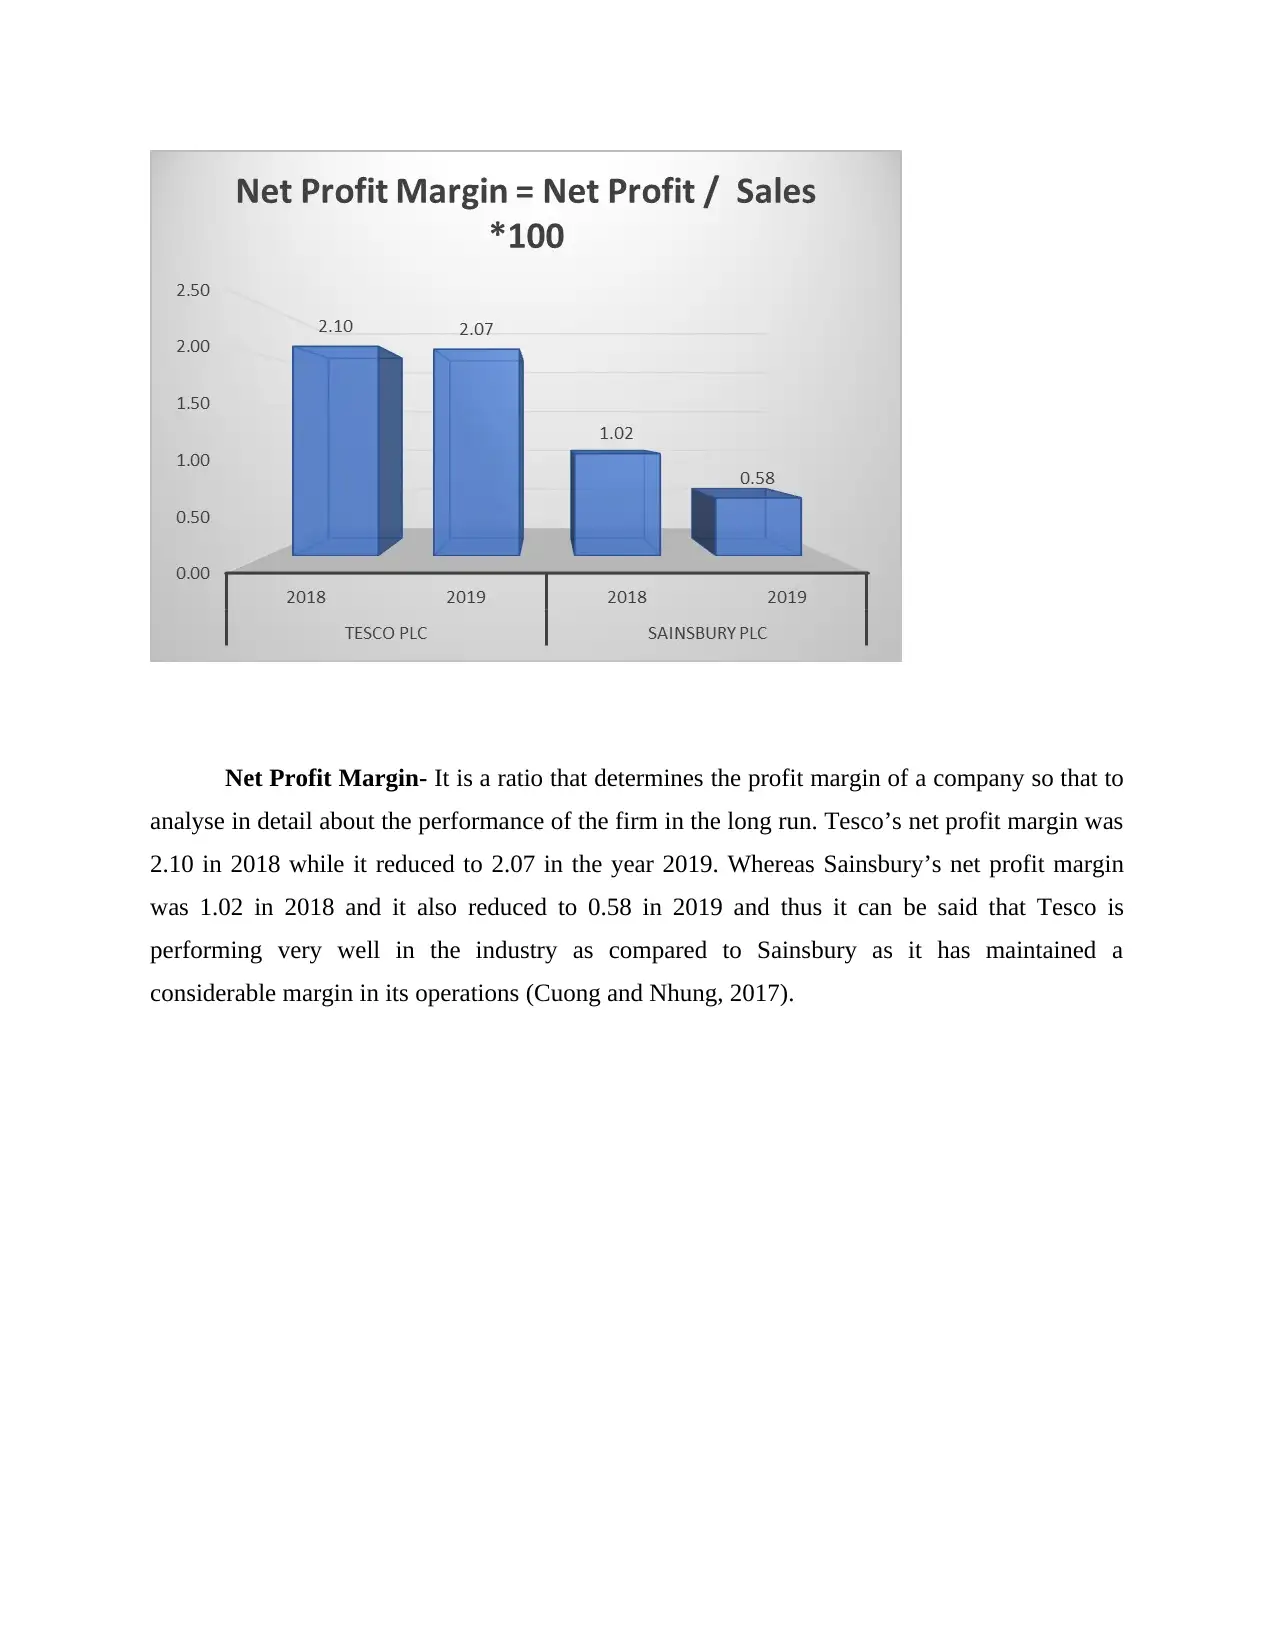
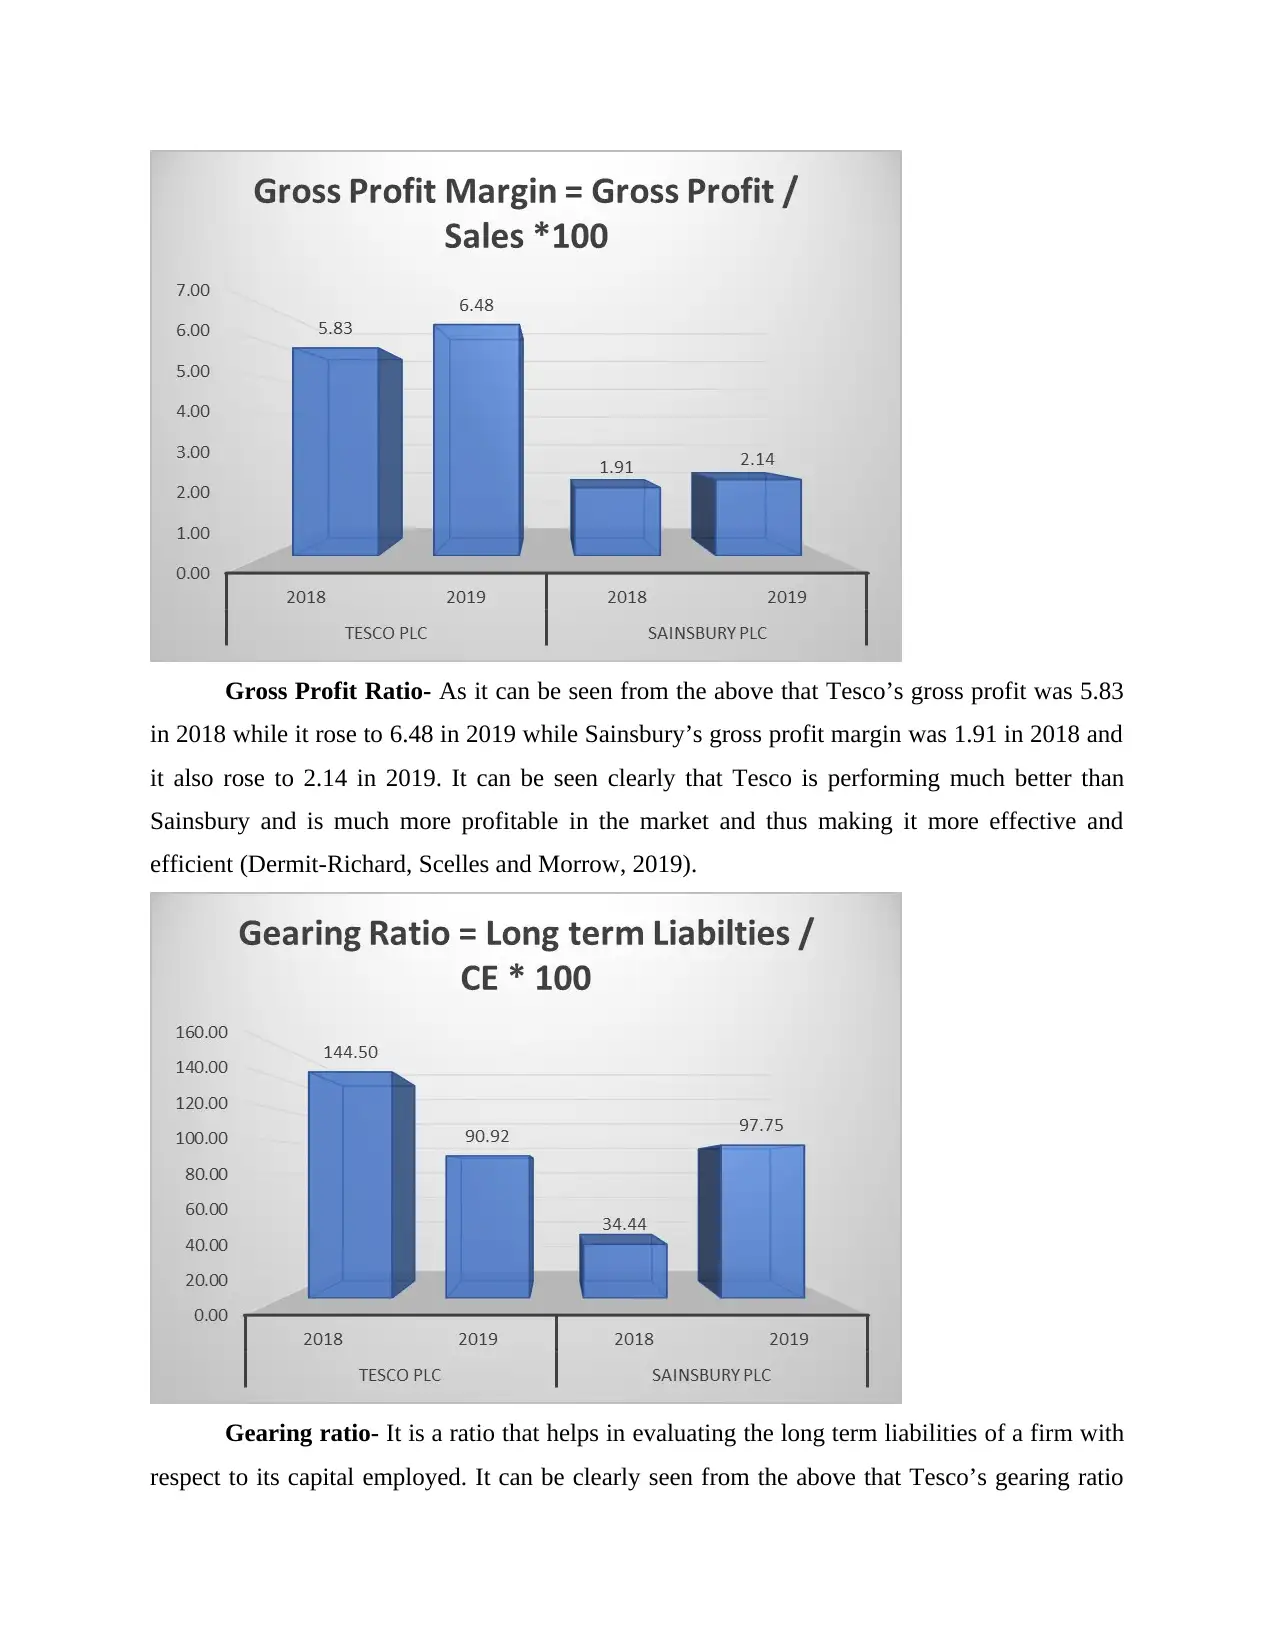
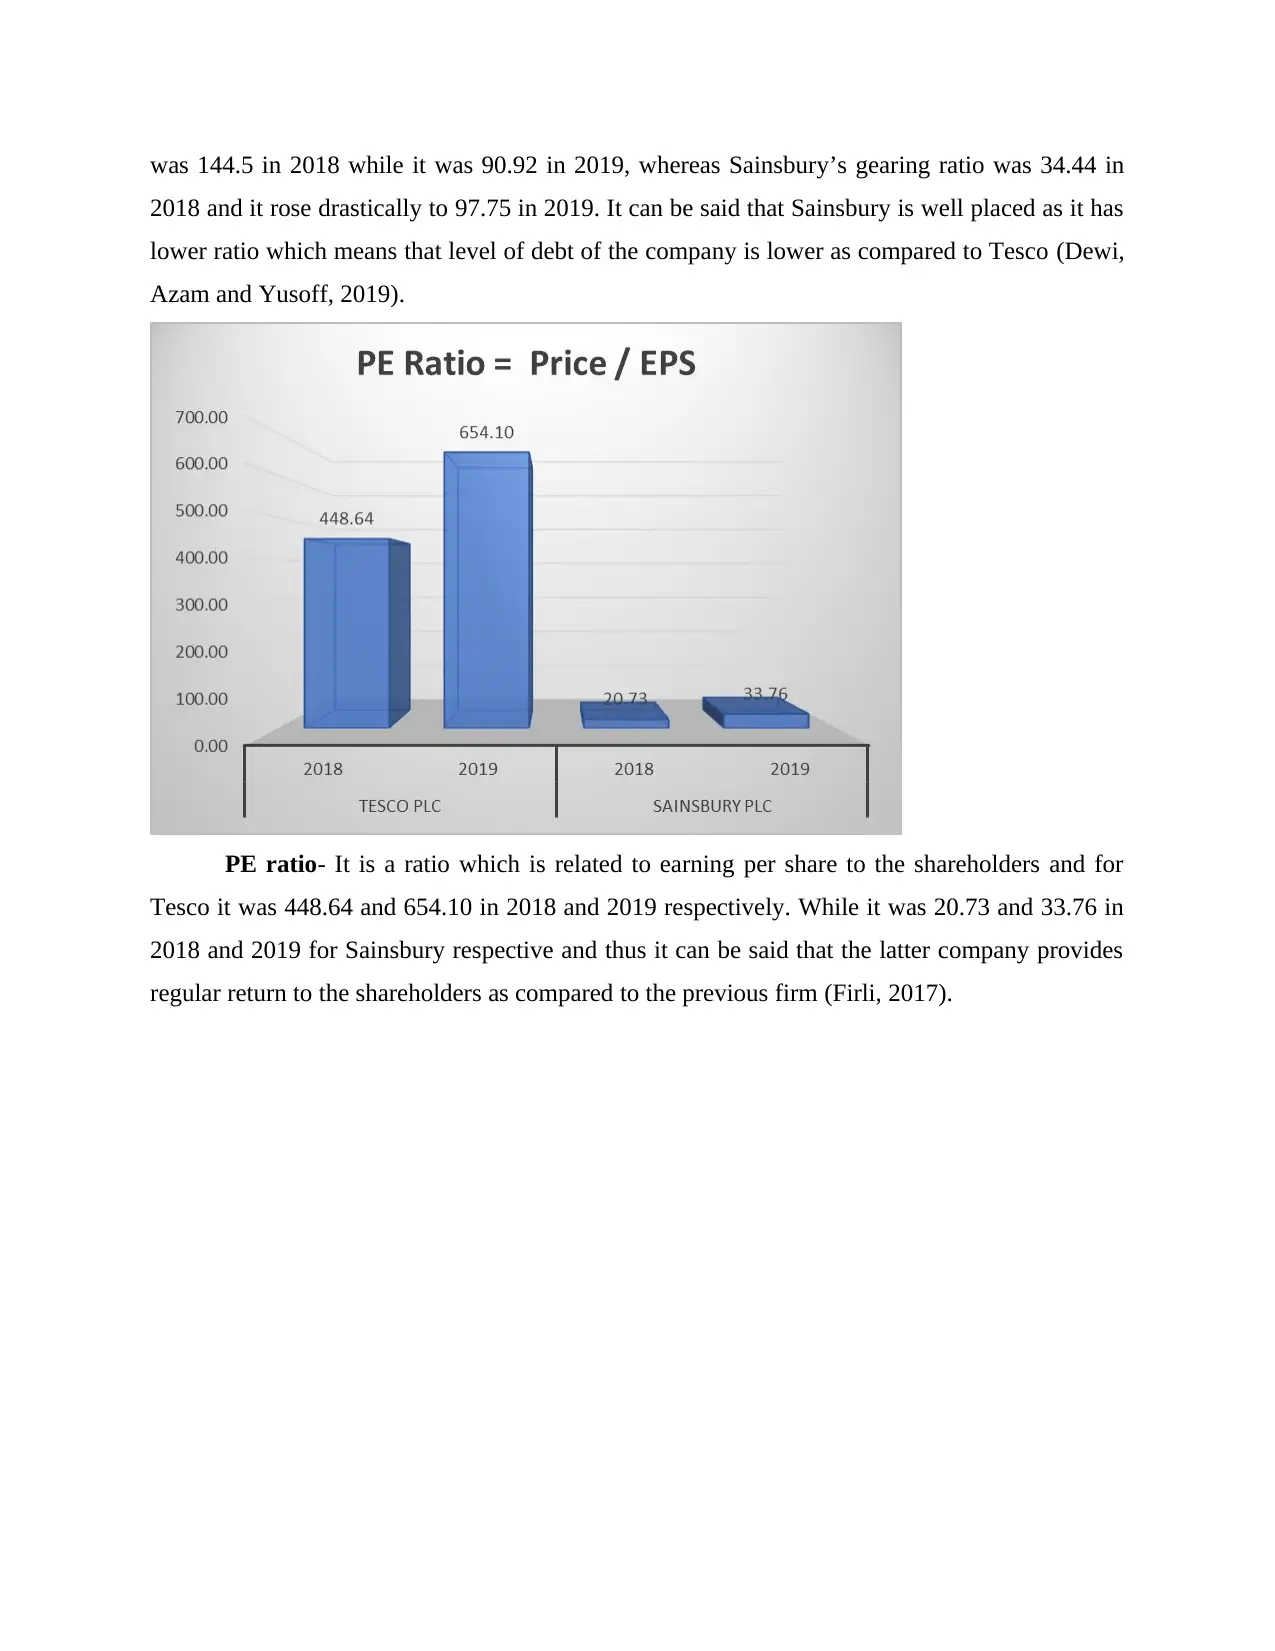
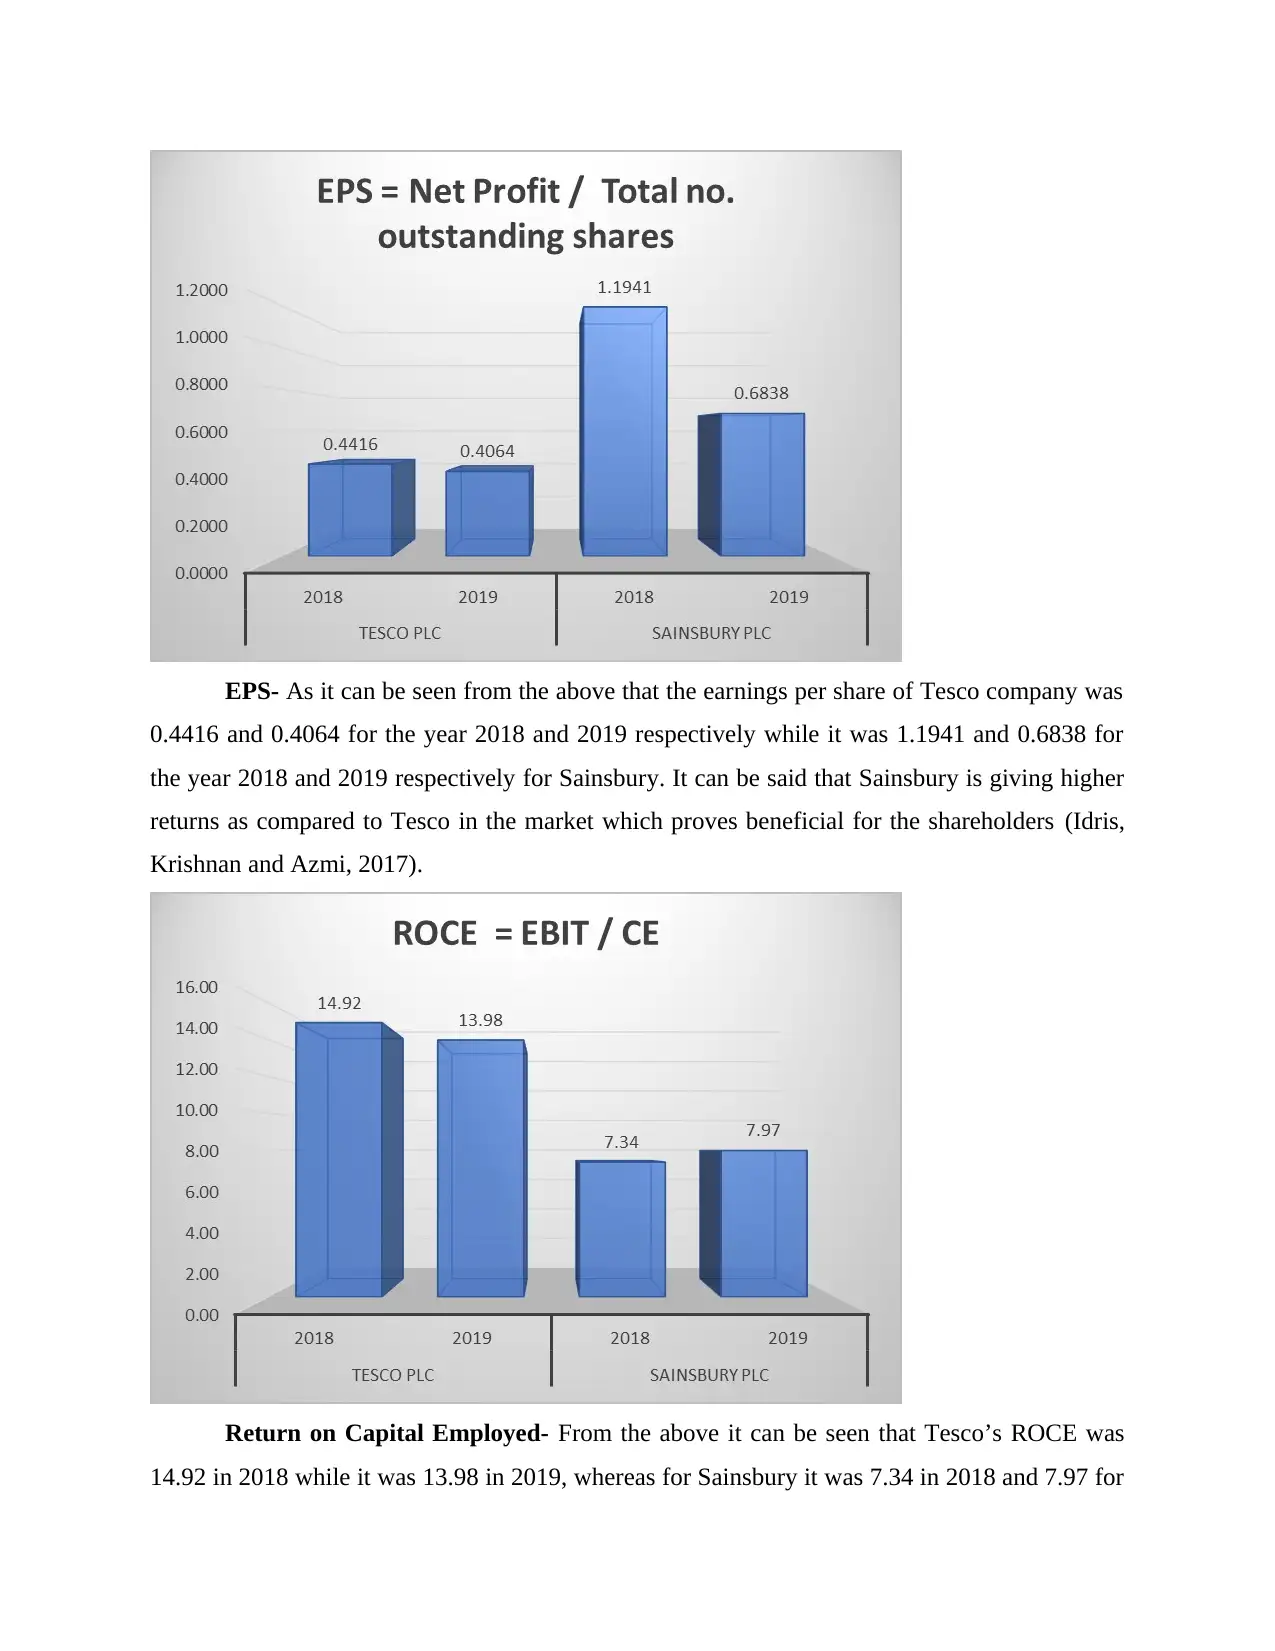
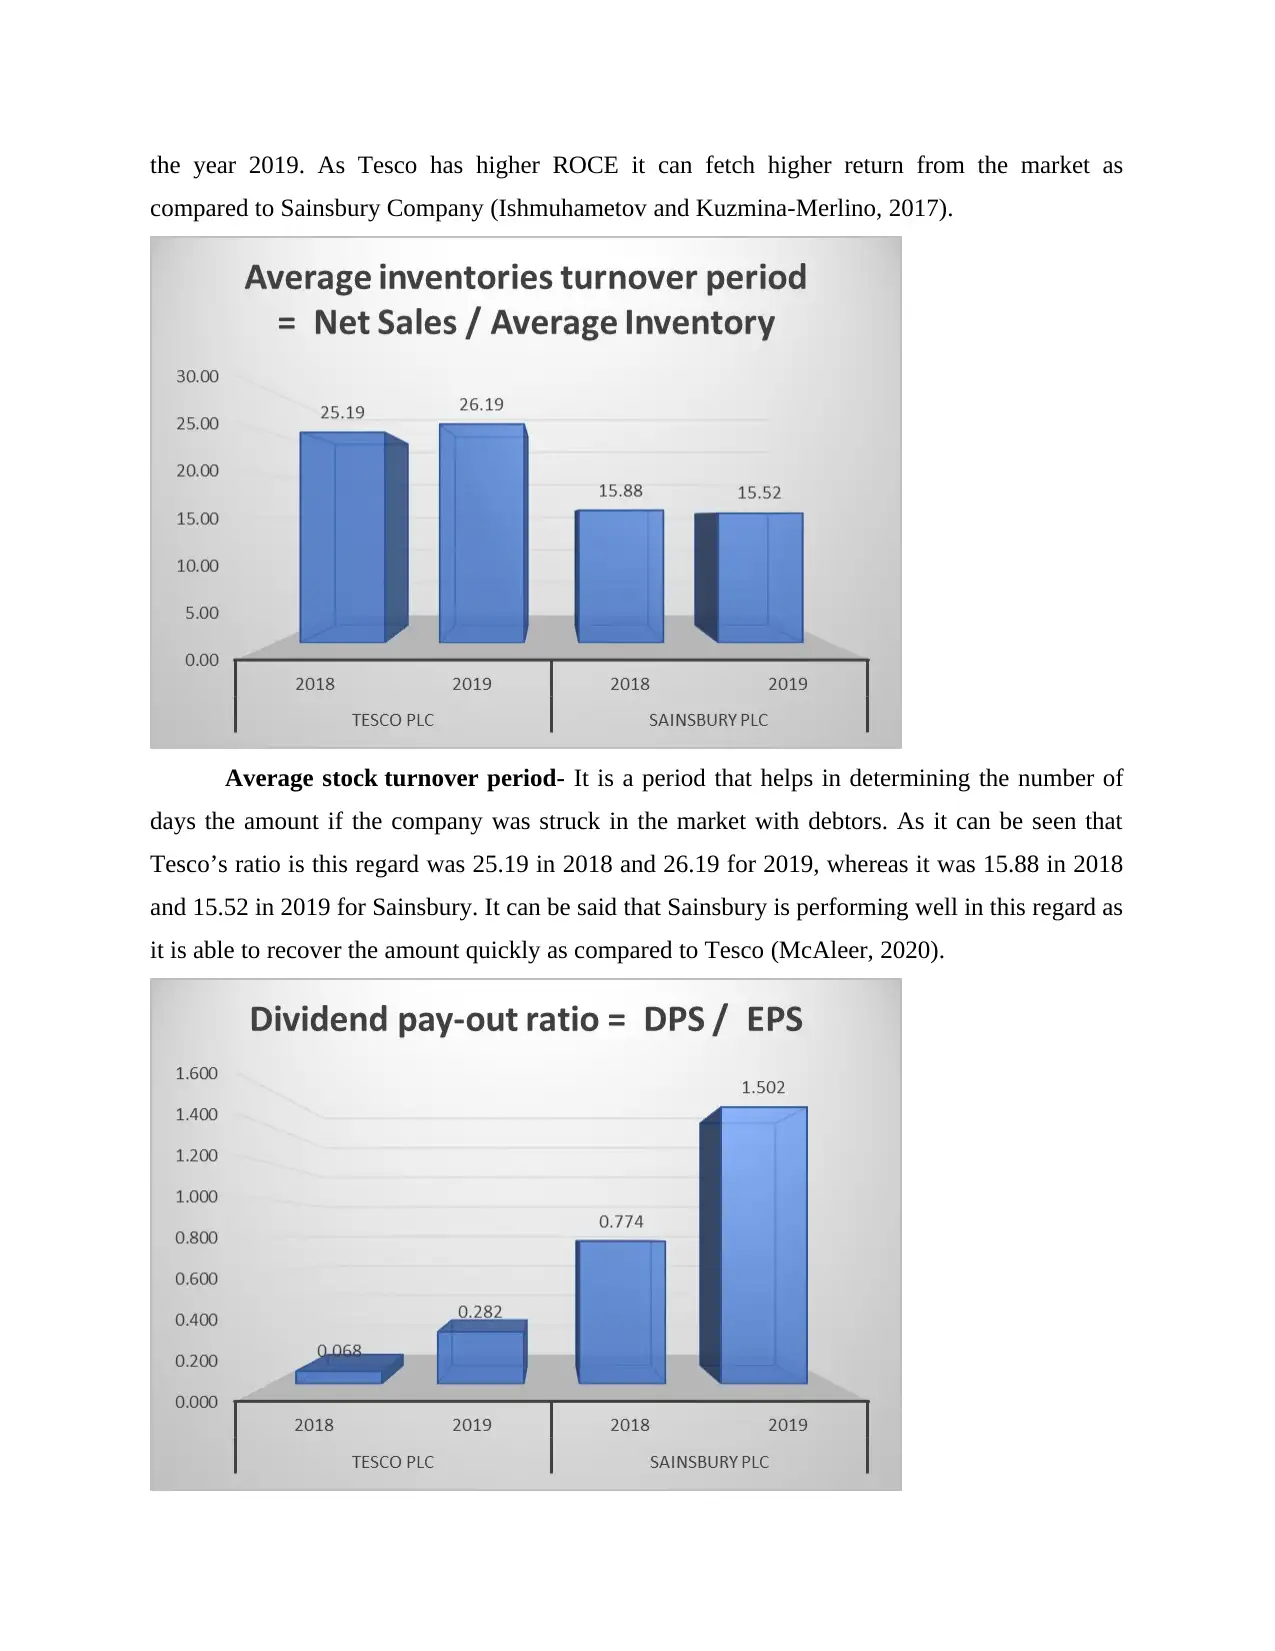
This report provides a comprehensive analysis of financial management, focusing on financial ratio analysis and investment appraisal techniques. It begins with an introduction to financial management and its importance for organizations. The core of the report involves a detailed calculation of ten key financial ratios for two major UK companies, Tesco and Sainsbury, for the years 2018 and 2019. These ratios include current ratio, quick ratio, net profit margin, gross profit margin, gearing ratio, P/E ratio, EPS, return on capital employed, average inventory turnover period, and dividend payout ratio. The report then examines, analyzes, and evaluates the financial positions and investment potential of both companies based on the calculated ratios, offering specific recommendations for each. Furthermore, the report calculates investment appraisal techniques, analyzes their limitations, and concludes with an overview of the findings. The report also discusses the limitations of relying on financial ratios.
Document Page
Financial management
tabler-icon-diamond-filled.svg

Paraphrase This Document

Need a fresh take? Get an instant paraphrase of this document with our AI Paraphraser
Document Page
Contents
Contents...........................................................................................................................................2
INTRODUCTION...........................................................................................................................1
TASK 1............................................................................................................................................1
A. Detailed calculation of 10 ratios that are related financially with both the companies for two
years that is 2018 and 2019.........................................................................................................1
B. Examination, analysis, as well as evaluation of the financial position and potential
regarding investment of both the companies...............................................................................3
C. Appropriate recommendations on the basis of above calculations and interpretation............9
D. Detailed analysis and evaluation of the limitations on relying on ratios that are related to
the finances of the company......................................................................................................10
TASK 2..........................................................................................................................................10
A. Detailed calculation of the techniques of investment appraisal that are prevailing in the
current market scenario..............................................................................................................10
B. Analysis and evaluation of the limitations of using the techniques of investment appraisal
while taking long term decision.................................................................................................13
CONCLUSION..............................................................................................................................14
REFERENCES..............................................................................................................................16
Document Page
Document Page
INTRODUCTION
Financial management is one of the most important as well as essential aspect for each and
every firm as it helps the company to manage and allocate its most valuable resources that are
finances in an appropriate manner so that it can add to the value of the organisation in the long
run (Arifin, Kevin and Siswanto, 2017). In this report there is a description of two major firms
that is Sainsbury which is one of the largest operator of supermarkets in the UK and the second
one is Tesco which is also located in the UK and deals mainly in groceries and both of them are
operational in the market since a long period of time and thus has captured a larger share in the
industry as compared to other of its competitors that are working in the similar market. Apart
from that this report also covers capital investment appraisal techniques that possess a lot of
importance in the current market scenario are also analysed and evaluated with respect to the
company. Further some important ratios are also calculated as well as interpreted in this report
that carriers a lot of value for both enterprises.
TASK 1
A. Detailed calculation of 10 ratios that are related financially with both the companies for two
years that is 2018 and 2019
(Amounts are in GBP thousand except
ratios)
Tesco PLC Sainsbury PLC
Year 2018 Year 2019 Year 2018 Year 2019
Current Ratio
Current Assets 13726000 12668000 7857000 7550000
Current Liabilities 19238000 20680000 10302000 11849000
Current Ratio = Current Assets / Current
Liabilities
0.713484 0.612573 0.762667443 0.637185
Quick Ratio
Quick Asset 11463000 10051000 7857000 7550000
Current Liabilities 19238000 20680000 10302000 11849000
Quick Ratio = Quick Assets / Current 0.595852 0.486025 0.762667443 0.637185
tabler-icon-diamond-filled.svg

Paraphrase This Document

Need a fresh take? Get an instant paraphrase of this document with our AI Paraphraser
Document Page
Liabilities
Net Profit Margin
Net Profit 1206000 1322000 291000 168000
Sales 57491000 63911000 28456000 29007000
Net Profit Margin = Net Profit / Sales *100 2.09772 2.068502 1.022631431 0.579171
Gross Profit Margin
Gross Profit 3350000 4144000 544000 620000
Sales 57491000 63911000 28456000 29007000
Gross Profit Margin = Gross Profit / Sales
*100
5.826999 6.484017 1.911723362 2.137415
Gearing ratios
Long term Liabilities 15144000 13509000 2552000 7607000
Capital Employed 10480000 14858000 7411000 7782000
Gearing Ratio = Long term Liabilities / CE
* 100
144.5038 90.92072 34.44 97.75
P/E ratio
Price 197.4 255.1 260 229.2
Earnings per Share 0.44 0.39 12.54 6.79
PE Ratio = Price / EPS 448.6364 654.1026 20.73365231 33.75552
Earnings per share
Total net profit 1206000 1322000 291000 168000
Total no. of outstanding shares 2731000 3253000 243700 245700
EPS = Net Profit / Total no. outstanding
shares
0.441596 0.406394 1.194091096 0.683761
Document Page
Return on capital employed
EBIT 1564000 2077000 544000 620000
CE 10480000 14858000 7411000 7782000
ROCE = EBIT / CE 14.92366 13.979 7.340439887 7.967104
Average inventories turnover period
Net Sales 57491000 63911000 28456000 29007000
Average inventories 2282000 2440000 1792500 1869500
Average inventories turnover period = Net
Sales / Average Inventory
25.19325 26.19303 15.87503487 15.51591
Dividend pay-out ratio
DPS 0.03 0.11 9.7 10.2
EPS 0.44 0.39 12.54 6.79
Dividend pay-out ratio = DPS / EPS 0.068182 0.282051 0.773524721 1.502209
B. Examination, analysis, as well as evaluation of the financial position and potential regarding
investment of both the companies
Current Ratio- It is one of the easiest ratio to calculate but it carriers a lot of value in the
current scenario as it helps in determining the short term paying capacity of the firm. As it can be
Document Page
seen from the above graph that current ratio of Tesco was 0.71 in 2018 while it decreased to 0.61
in 2019. Whereas current ratio of Sainsbury was 0.76 in 2018 while it also decreased to 0.64 in
2019. There is not a huge different in this part but still it can be said that the latter company is
placed far better than that as compared to the first (Chen, Tan and Fang, 2018).
Quick Ratio- It is a ratio that helps a company to determine various factors that are very
important from the firm’s point of view. From the above it can be seen that quick ratio of Tesco
and Sainsbury was 0.60 and 0.59 in 2018 while both decreased to 0.49 and 0.47 respectively.
There is almost a same percent of change in this aspect but it can be evaluated by this that Tesco
is placed much better in this regard (Csákné Filep and Karmazin, 2016).
tabler-icon-diamond-filled.svg

Paraphrase This Document

Need a fresh take? Get an instant paraphrase of this document with our AI Paraphraser
Document Page
Net Profit Margin- It is a ratio that determines the profit margin of a company so that to
analyse in detail about the performance of the firm in the long run. Tesco’s net profit margin was
2.10 in 2018 while it reduced to 2.07 in the year 2019. Whereas Sainsbury’s net profit margin
was 1.02 in 2018 and it also reduced to 0.58 in 2019 and thus it can be said that Tesco is
performing very well in the industry as compared to Sainsbury as it has maintained a
considerable margin in its operations (Cuong and Nhung, 2017).
Document Page
Gross Profit Ratio- As it can be seen from the above that Tesco’s gross profit was 5.83
in 2018 while it rose to 6.48 in 2019 while Sainsbury’s gross profit margin was 1.91 in 2018 and
it also rose to 2.14 in 2019. It can be seen clearly that Tesco is performing much better than
Sainsbury and is much more profitable in the market and thus making it more effective and
efficient (Dermit-Richard, Scelles and Morrow, 2019).
Gearing ratio- It is a ratio that helps in evaluating the long term liabilities of a firm with
respect to its capital employed. It can be clearly seen from the above that Tesco’s gearing ratio
Document Page
was 144.5 in 2018 while it was 90.92 in 2019, whereas Sainsbury’s gearing ratio was 34.44 in
2018 and it rose drastically to 97.75 in 2019. It can be said that Sainsbury is well placed as it has
lower ratio which means that level of debt of the company is lower as compared to Tesco (Dewi,
Azam and Yusoff, 2019).
PE ratio- It is a ratio which is related to earning per share to the shareholders and for
Tesco it was 448.64 and 654.10 in 2018 and 2019 respectively. While it was 20.73 and 33.76 in
2018 and 2019 for Sainsbury respective and thus it can be said that the latter company provides
regular return to the shareholders as compared to the previous firm (Firli, 2017).
tabler-icon-diamond-filled.svg

Paraphrase This Document

Need a fresh take? Get an instant paraphrase of this document with our AI Paraphraser
Document Page
EPS- As it can be seen from the above that the earnings per share of Tesco company was
0.4416 and 0.4064 for the year 2018 and 2019 respectively while it was 1.1941 and 0.6838 for
the year 2018 and 2019 respectively for Sainsbury. It can be said that Sainsbury is giving higher
returns as compared to Tesco in the market which proves beneficial for the shareholders (Idris,
Krishnan and Azmi, 2017).
Return on Capital Employed- From the above it can be seen that Tesco’s ROCE was
14.92 in 2018 while it was 13.98 in 2019, whereas for Sainsbury it was 7.34 in 2018 and 7.97 for
Document Page
the year 2019. As Tesco has higher ROCE it can fetch higher return from the market as
compared to Sainsbury Company (Ishmuhametov and Kuzmina-Merlino, 2017).
Average stock turnover period- It is a period that helps in determining the number of
days the amount if the company was struck in the market with debtors. As it can be seen that
Tesco’s ratio is this regard was 25.19 in 2018 and 26.19 for 2019, whereas it was 15.88 in 2018
and 15.52 in 2019 for Sainsbury. It can be said that Sainsbury is performing well in this regard as
it is able to recover the amount quickly as compared to Tesco (McAleer, 2020).
chevron_up_icon
1 out of 19
circle_padding
hide_on_mobile
zoom_out_icon
[object Object]