Financial Performance Comparison: BHP Billiton vs Rio Tinto (HI5002)
VerifiedAdded on 2023/06/08
|20
|4555
|361
Report
AI Summary
This report provides a detailed financial analysis comparing BHP Billiton and Rio Tinto, two major players in the mining industry. It begins with an introduction to both companies, outlining their operating models and comparative advantages. The core of the report focuses on a comprehensive ratio analysis, including liquidity, profitability, and solvency ratios, to assess their financial health and performance over a period of time. The analysis extends to share price movements, factors influencing these movements, and the calculation of beta values. Furthermore, the report examines the dividend policies of both companies, offering insights into their investment strategies and shareholder returns. The objective is to provide a clear understanding of each company's financial position, ultimately offering recommendations for investment based on the conducted analysis. The report utilizes financial data, ratios, and market indicators to support its findings and conclusions.

qwertyuiopasdfghjklzxcvbnmqw
ertyuiopasdfghjklzxcvbnmqwert
yuiopasdfghjklzxcvbnmqwertyui
opasdfghjklzxcvbnmqwertyuiopa
sdfghjklzxcvbnmqwertyuiopasdf
ghjklzxcvbnmqwertyuiopasdfghj
klzxcvbnmqwertyuiopasdfghjklz
xcvbnmqwertyuiopasdfghjklzxcv
bnmqwertyuiopasdfghjklzxcvbn
mqwertyuiopasdfghjklzxcvbnmq
wertyuiopasdfghjklzxcvbnmqwer
tyuiopasdfghjklzxcvbnmqwertyui
opasdfghjklzxcvbnmqwertyuiopa
sdfghjklzxcvbnmqwertyuiopasdf
ghjklzxcvbnmqwertyuiopasdfghj
klzxcvbnmqwertyuiopasdfghjklz
xcvbnmrtyuiopasdfghjklzxcvbnm
qwertyuiopasdfghjklzxcvbnmqw
FINANCE
Paraphrase This Document
Need a fresh take? Get an instant paraphrase of this document with our AI Paraphraser
BHP vs Rio
Executive Summary
Investment in a company or a rival company is a difficult task however with the aid of
financial analysis it can be done with ease. Ratio analysis and other parameters help in
providing a strong answer to the fact that whether the company is feasible to be invested in.
In this report, two giants in the field of minerals and mining that is Rio and BHP is selected.
The report initiates with the introduction and the operating model. It is then followed by the
ratios comparison of both the companies. The beta values of both the companies are
computed and the dividend policy has been highlighted so as to make the appropriate
decision.
2
BHP vs Rio
Contents
Introduction...........................................................................................................................................2
1. Comparative advantage and operation model..............................................................................3
2. Computation of performance ratios..............................................................................................5
• Liquidity ratios...............................................................................................................................5
Profitability ratios..........................................................................................................................7
Solvency ratio................................................................................................................................8
3. Share price movements.................................................................................................................9
4. Factors that influenced the share price.......................................................................................11
5. Calculation of beta and value......................................................................................................12
6. Dividend policy of the companies................................................................................................12
Recommendation................................................................................................................................13
Conclusion...........................................................................................................................................13
References...........................................................................................................................................14
Appendix.............................................................................................................................................16
3
⊘ This is a preview!⊘
Do you want full access?
Subscribe today to unlock all pages.
Trusted by 1+ million students worldwide
BHP vs Rio
Introduction
Rio Tinto is the largest mining organizations in the world and it has been established in the
year 1962. Furthermore, the company intends to provide its users with effective returns
through an appropriate portfolio. Moreover, it is made of several segments such as aluminum,
iron ore, diamond, minerals, and copper that assists it to exert its affairs globally across
various countries. This has been possible with the prevalence of sixty thousand people
operating in the organization. Nevertheless, accounting for the initial stages, Rio Tinto firstly
entered the industry as a single entity but thereafter, it changed its perspectives and theories
to become a company dually listed in nature (Rio Tinto, 2017). Moreover, the significant
areas of company’s functioning are primarily concentrated upon Canada and Australia.
Lastly, the entire business affairs of the company are operated through partly or wholly-
owned subsidiaries. Nonetheless, Rio has also been listed on the ASX and London Stock
Exchange that assists it in the fulfillment of prime objectives.
On the other hand, BHP Billiton is a pioneer in the field of metal, mining, and petroleum. The
company is dually listed with two parent companies that run on its own. The major advantage
that the business carries is the management and the Board function. Further, BHP strives to
enhance the value of the shareholder through the process of marketing, discovery and
increasing the natural resources (BHP Billiton, 2017). The formidable strategies help the
business to flourish and ensure the protection of the environment.
1. Comparative advantage and operation model
It is beneficial for the Australian government to keep charging taxes to the operations which
are of a global standard because this will increase the stakes for the same. BHP Billiton has
been seen to work on the same standards which are like exploring, mining, drilling,
extracting, processing, shipping as also marketing. It is seen that the company has been
paying the taxes from the profits division which have been generated due to the trade in
Australia. The company has also been making amounts from Singapore due to a 400-strong
marketing team which is gathered there for an operation like customer sales, freight, credit
risk and forecasting which are related to iron ore (BHP Billiton, 2017). Cleverly the team has
been set up in Asia which makes its closer to the main marketing customers like China,
Japan, and South Korea. Application of the taxes is a very important topic and has been seen
to always fall in Australia’s favor. BHP Billiton has been seen to play it fair and honest for
4
Paraphrase This Document
Need a fresh take? Get an instant paraphrase of this document with our AI Paraphraser
BHP vs Rio
the last 15 years by presenting all the tax payments publicly and this has resulted in it to be
selected as the company which has been the most transparent company in terms of legal talks.
When it comes to Rio, the major advantage can be witnessed is the competitiveness in terms
of industry and condition. The strategy of the company is clear and enables to perform in a
formidable manner in the industry environment. The goal is to provide maximum benefits
and hence it follows four Ps that is the portfolio, performance, people, and partners. Further,
the company is strongly positioned to address the increment in the environment and cost
pressure (Rio Tinto, 2017). The marketing function is centralized and works in tandem with
the operations to enhance the value from the activities and keep the resources management in
tune to the overall market.
Operating model
The four foundations of the BHBP associated with their business field work areas - Iron Ore,
Petroleum, Copper and Coal. All these priorities are held strong by maintained centers
(Group functions) and the marketing system (marketing division). all the above centers have
their own sets of administrative and executive departments and the CEO of each of the center
is the one who sits in the final meeting of the Group Management Committee which consists
of all the senior members (BHP Billiton, 2017).
All the above-mentioned centers are structured in such a way so that they keep their priorities
like the member’s safety, maximum production and minimum costs at the top of the list. All
the centers are independent and believe in the instantaneous decision. All the centers have
different working associated with the sales, marketing, corporate support and this is why all
the centers are free to take advantages of the policies set up in the company which will help
to avoid the macroeconomics hindrance. This also helps the company to execute things in a
more systematic way with association with the portfolio which will increase the reputation of
the company. The type of business that has been stated above, it should be noted that the
income from the product is never in the hand of the company. The international market
decides the mark of profits as per the supply and demand rate. BHP is clever enough to select
only Tier-1 projects so that their standards are set up globally.
Perceiving long-term view is the key to mining operations and the lower costs plan cannot be
achieved only by strategic developments and portfolios. Tier-1 is the main area that decides
5

BHP vs Rio
that the workings will be of lower cost or not. It should be noted that the time lapse between
production and the starting of the business ranges from 10 to 20 years.
Rio Tinto has an effective plan by which it can guarantee such values which it will be able to
achieve easily in the future without increasing its overall costs. The operating model of Rio
rests on the investment of people and partnership with the stakeholder who is external. The
company invests in huge in the development of technical, as well as commercial capabilities
that enables to unleash the maximum value from the assets (Rio Tinto, 2017). The
fundamentals of operations dwell on the value chain, trusted relationship and reputation.
6
⊘ This is a preview!⊘
Do you want full access?
Subscribe today to unlock all pages.
Trusted by 1+ million students worldwide
BHP vs Rio
2. Computation of performance ratios
• Liquidity ratios
This ratio assists in highlighting the company’s ability to repay its short-term debt
obligations. Further, this ratio also determines the funds that are associated with short-term
tenure and how it can allow in a smoother flow of operations. Therefore, if a company does
not have a proper liquidity ratio, it signifies failure or ineffectiveness on the part of the
company to repay their short-term debt obligations (Leo, 2011). Nevertheless, on the other
side, efficiency ratios play an important part in highlighting the fact whether it can manage its
resources or assets in an efficient way or not. Moreover, efficiency ratios are almost like that
of liquidity ratios and the reason behind this can be attributed to the fact that it assists in
measuring the processes by which an organization can generate revenues from its present
available funds. Further, it the management of the company is not capable of subduing its
resources, it signifies that the generated profits will be declined (Marsh, 2009).
Current ratio can play a key role in depicting the rotation of resources through the business
affairs so that both stock and debtors can be easily converted into cash for the payment to
creditors (Petersen & Plenborg, 2012). This can be undertaken by dividing a company’s
current assets with their current liabilities. Nevertheless, in relation to the company, it can be
observed that its current ratio has been very efficient in nature, thereby reflecting that it has
been able to maximize its current assets when compared to the current liabilities (Laux,
2014). Therefore, the company can easily cater to all its future short-term debt obligations in
an efficient way and its current ratio is the prime witness of this fact. However, in contrast to
this, when it comes to quick ratio, the same plays a key role in highlighting the fact that the
company can repay its short-term debt obligations. Besides, it can facilitate serving as an
effective reflection of current ratio as stocks are not incorporated in this ratio. Moreover, the
organization’s quick ratio is greater than the usual rate of 1:1, thereby shedding light on its
liquidity strength to address the future obligations (Merchant, 2012). Furthermore, in relation
to fixed assets ratio, the company’s ratio has been stagnant that depicts utilization of assets in
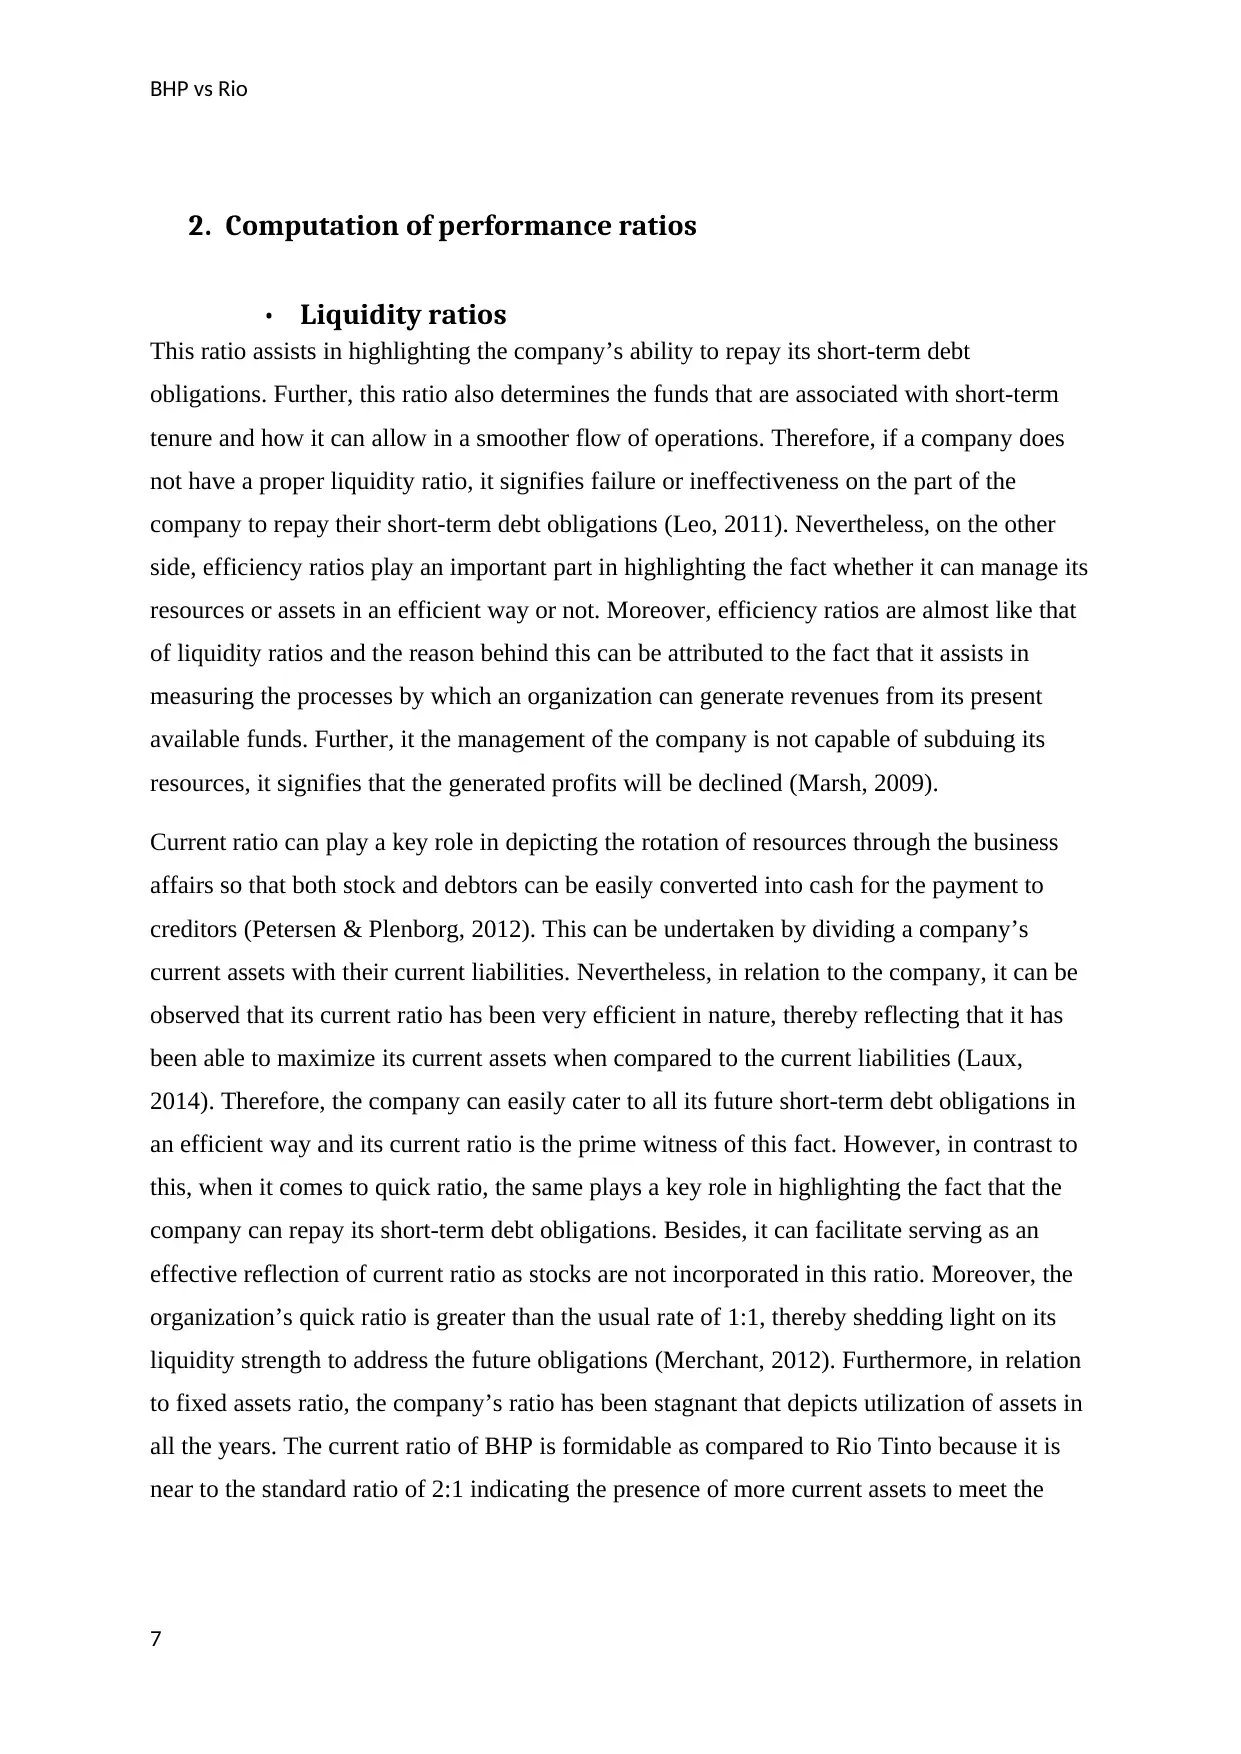
all the years. The current ratio of BHP is formidable as compared to Rio Tinto because it is
near to the standard ratio of 2:1 indicating the presence of more current assets to meet the
7
2. Computation of performance ratios
• Liquidity ratios
This ratio assists in highlighting the company’s ability to repay its short-term debt
obligations. Further, this ratio also determines the funds that are associated with short-term
tenure and how it can allow in a smoother flow of operations. Therefore, if a company does
not have a proper liquidity ratio, it signifies failure or ineffectiveness on the part of the
company to repay their short-term debt obligations (Leo, 2011). Nevertheless, on the other
side, efficiency ratios play an important part in highlighting the fact whether it can manage its
resources or assets in an efficient way or not. Moreover, efficiency ratios are almost like that
of liquidity ratios and the reason behind this can be attributed to the fact that it assists in
measuring the processes by which an organization can generate revenues from its present
available funds. Further, it the management of the company is not capable of subduing its
resources, it signifies that the generated profits will be declined (Marsh, 2009).
Current ratio can play a key role in depicting the rotation of resources through the business
affairs so that both stock and debtors can be easily converted into cash for the payment to
creditors (Petersen & Plenborg, 2012). This can be undertaken by dividing a company’s
current assets with their current liabilities. Nevertheless, in relation to the company, it can be
observed that its current ratio has been very efficient in nature, thereby reflecting that it has
been able to maximize its current assets when compared to the current liabilities (Laux,
2014). Therefore, the company can easily cater to all its future short-term debt obligations in
an efficient way and its current ratio is the prime witness of this fact. However, in contrast to
this, when it comes to quick ratio, the same plays a key role in highlighting the fact that the
company can repay its short-term debt obligations. Besides, it can facilitate serving as an
effective reflection of current ratio as stocks are not incorporated in this ratio. Moreover, the
organization’s quick ratio is greater than the usual rate of 1:1, thereby shedding light on its
liquidity strength to address the future obligations (Merchant, 2012). Furthermore, in relation
to fixed assets ratio, the company’s ratio has been stagnant that depicts utilization of assets in
all the years. The current ratio of BHP is formidable as compared to Rio Tinto because it is
near to the standard ratio of 2:1 indicating the presence of more current assets to meet the
7
Paraphrase This Document
Need a fresh take? Get an instant paraphrase of this document with our AI Paraphraser
BHP vs Rio
obligations. Rio is above the ratio of 1:1, however, stands low in comparison to BHP.
2015 2016 2017
0
0.2
0.4
0.6
0.8
1
1.2
1.4
1.6
1.8
2
Rio Current Ratio (Current
Assets/Current Liabilities)
Current Ratio (Current
Assets/Current Liabilities)
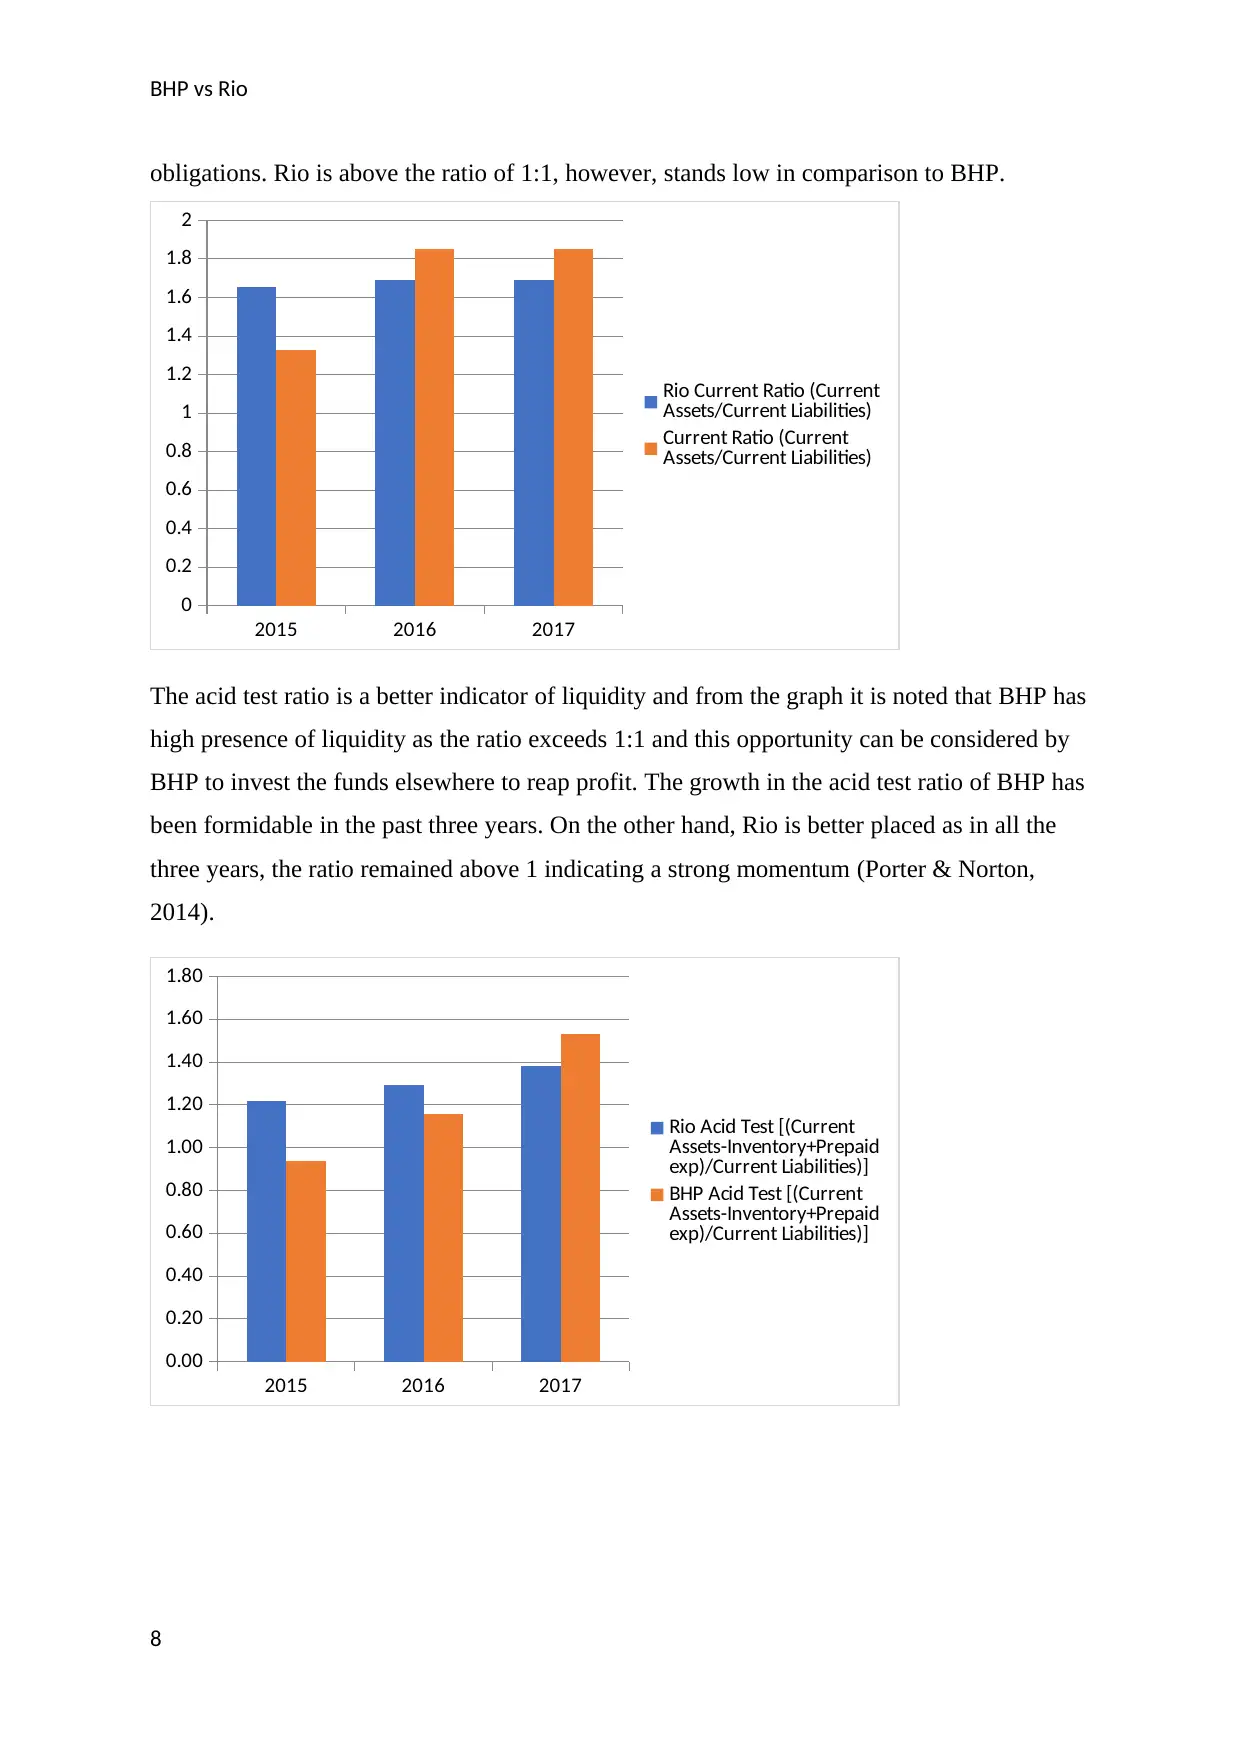
The acid test ratio is a better indicator of liquidity and from the graph it is noted that BHP has
high presence of liquidity as the ratio exceeds 1:1 and this opportunity can be considered by
BHP to invest the funds elsewhere to reap profit. The growth in the acid test ratio of BHP has
been formidable in the past three years. On the other hand, Rio is better placed as in all the
three years, the ratio remained above 1 indicating a strong momentum (Porter & Norton,
2014).
2015 2016 2017
0.00
0.20
0.40
0.60
0.80
1.00
1.20
1.40
1.60
1.80
Rio Acid Test [(Current
Assets-Inventory+Prepaid
exp)/Current Liabilities)]
BHP Acid Test [(Current
Assets-Inventory+Prepaid
exp)/Current Liabilities)]
8
obligations. Rio is above the ratio of 1:1, however, stands low in comparison to BHP.
2015 2016 2017
0
0.2
0.4
0.6
0.8
1
1.2
1.4
1.6
1.8
2
Rio Current Ratio (Current
Assets/Current Liabilities)
Current Ratio (Current
Assets/Current Liabilities)
The acid test ratio is a better indicator of liquidity and from the graph it is noted that BHP has
high presence of liquidity as the ratio exceeds 1:1 and this opportunity can be considered by
BHP to invest the funds elsewhere to reap profit. The growth in the acid test ratio of BHP has
been formidable in the past three years. On the other hand, Rio is better placed as in all the
three years, the ratio remained above 1 indicating a strong momentum (Porter & Norton,
2014).
2015 2016 2017
0.00
0.20
0.40
0.60
0.80
1.00
1.20
1.40
1.60
1.80
Rio Acid Test [(Current
Assets-Inventory+Prepaid
exp)/Current Liabilities)]
BHP Acid Test [(Current
Assets-Inventory+Prepaid
exp)/Current Liabilities)]
8
BHP vs Rio
Profitability ratios
Profitability ratios can be used to assess how an organization can generate revenues when
compared to other costs that incur in the general scenarios. In addition, it must be taken into
consideration that the profitability ratios must be extreme in nature as it reflects a company’s
significance when compared to the competitors. However, when the profitability ratio of an
organization in relation to the present tenure is compared to the past year, the ratio must be
greater in nature (Parrino et. al, 2012). The reason behind this can be attributed to the fact that
it reflects a positive working scenario on the company’s profit. Furthermore, in relation to the
company, its profitability ratios that have been calculated are gross profit margin, net profit
margin, return on assets, and return on equity respectively (Douma & Hein, 2013).
In association with the net profit margin of the company, the same is called as a profitability
ratio that can be utilized to reflect how efficiently an organization is able to manage its
expenses. Besides, the board or management calculates such a ratio to determine how
efficiently the organization has been performing to convert its costs into revenues (Davies &
Crawford, 2012). In addition, the return on equity and return on assets of the organization
have also experienced a positive trend, thereby reflecting that the organization has used its
resources or assets in an appropriate way.
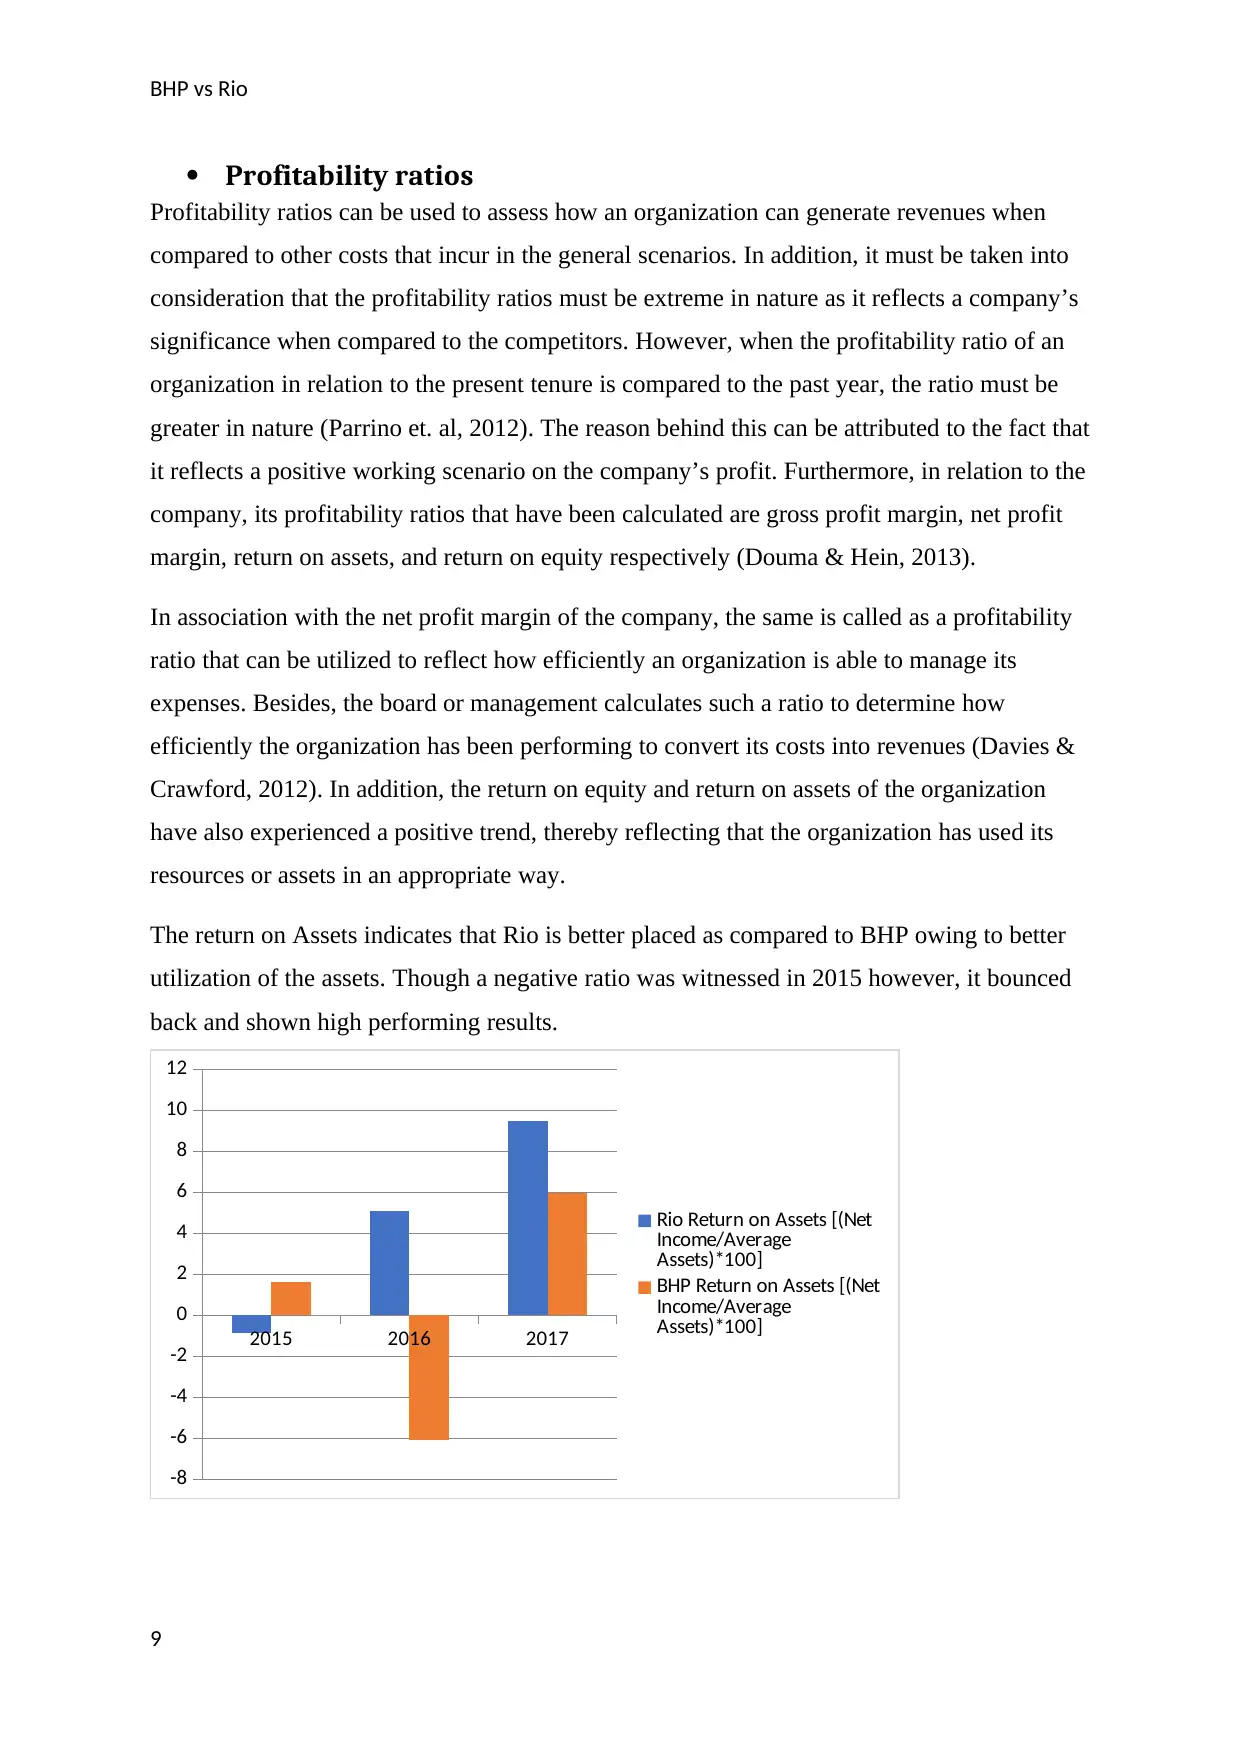
The return on Assets indicates that Rio is better placed as compared to BHP owing to better
utilization of the assets. Though a negative ratio was witnessed in 2015 however, it bounced
back and shown high performing results.
2015 2016 2017
-8
-6
-4
-2
0
2
4
6
8
10
12
Rio Return on Assets [(Net
Income/Average
Assets)*100]
BHP Return on Assets [(Net
Income/Average
Assets)*100]
9
Profitability ratios
Profitability ratios can be used to assess how an organization can generate revenues when
compared to other costs that incur in the general scenarios. In addition, it must be taken into
consideration that the profitability ratios must be extreme in nature as it reflects a company’s
significance when compared to the competitors. However, when the profitability ratio of an
organization in relation to the present tenure is compared to the past year, the ratio must be
greater in nature (Parrino et. al, 2012). The reason behind this can be attributed to the fact that
it reflects a positive working scenario on the company’s profit. Furthermore, in relation to the
company, its profitability ratios that have been calculated are gross profit margin, net profit
margin, return on assets, and return on equity respectively (Douma & Hein, 2013).
In association with the net profit margin of the company, the same is called as a profitability
ratio that can be utilized to reflect how efficiently an organization is able to manage its
expenses. Besides, the board or management calculates such a ratio to determine how
efficiently the organization has been performing to convert its costs into revenues (Davies &
Crawford, 2012). In addition, the return on equity and return on assets of the organization
have also experienced a positive trend, thereby reflecting that the organization has used its
resources or assets in an appropriate way.
The return on Assets indicates that Rio is better placed as compared to BHP owing to better
utilization of the assets. Though a negative ratio was witnessed in 2015 however, it bounced
back and shown high performing results.
2015 2016 2017
-8
-6
-4
-2
0
2
4
6
8
10
12
Rio Return on Assets [(Net
Income/Average
Assets)*100]
BHP Return on Assets [(Net
Income/Average
Assets)*100]
9
⊘ This is a preview!⊘
Do you want full access?
Subscribe today to unlock all pages.
Trusted by 1+ million students worldwide
BHP vs Rio
2015 2016 2017
-25.00
-20.00
-15.00
-10.00
-5.00
0.00
5.00
10.00
15.00
20.00
25.00
Rio Net Profit Margin [(Net
Profit after tax/Sales
Revenue)*100]
BHP Net Profit Margin
[(Net Profit after tax/Sales
Revenue)*100]
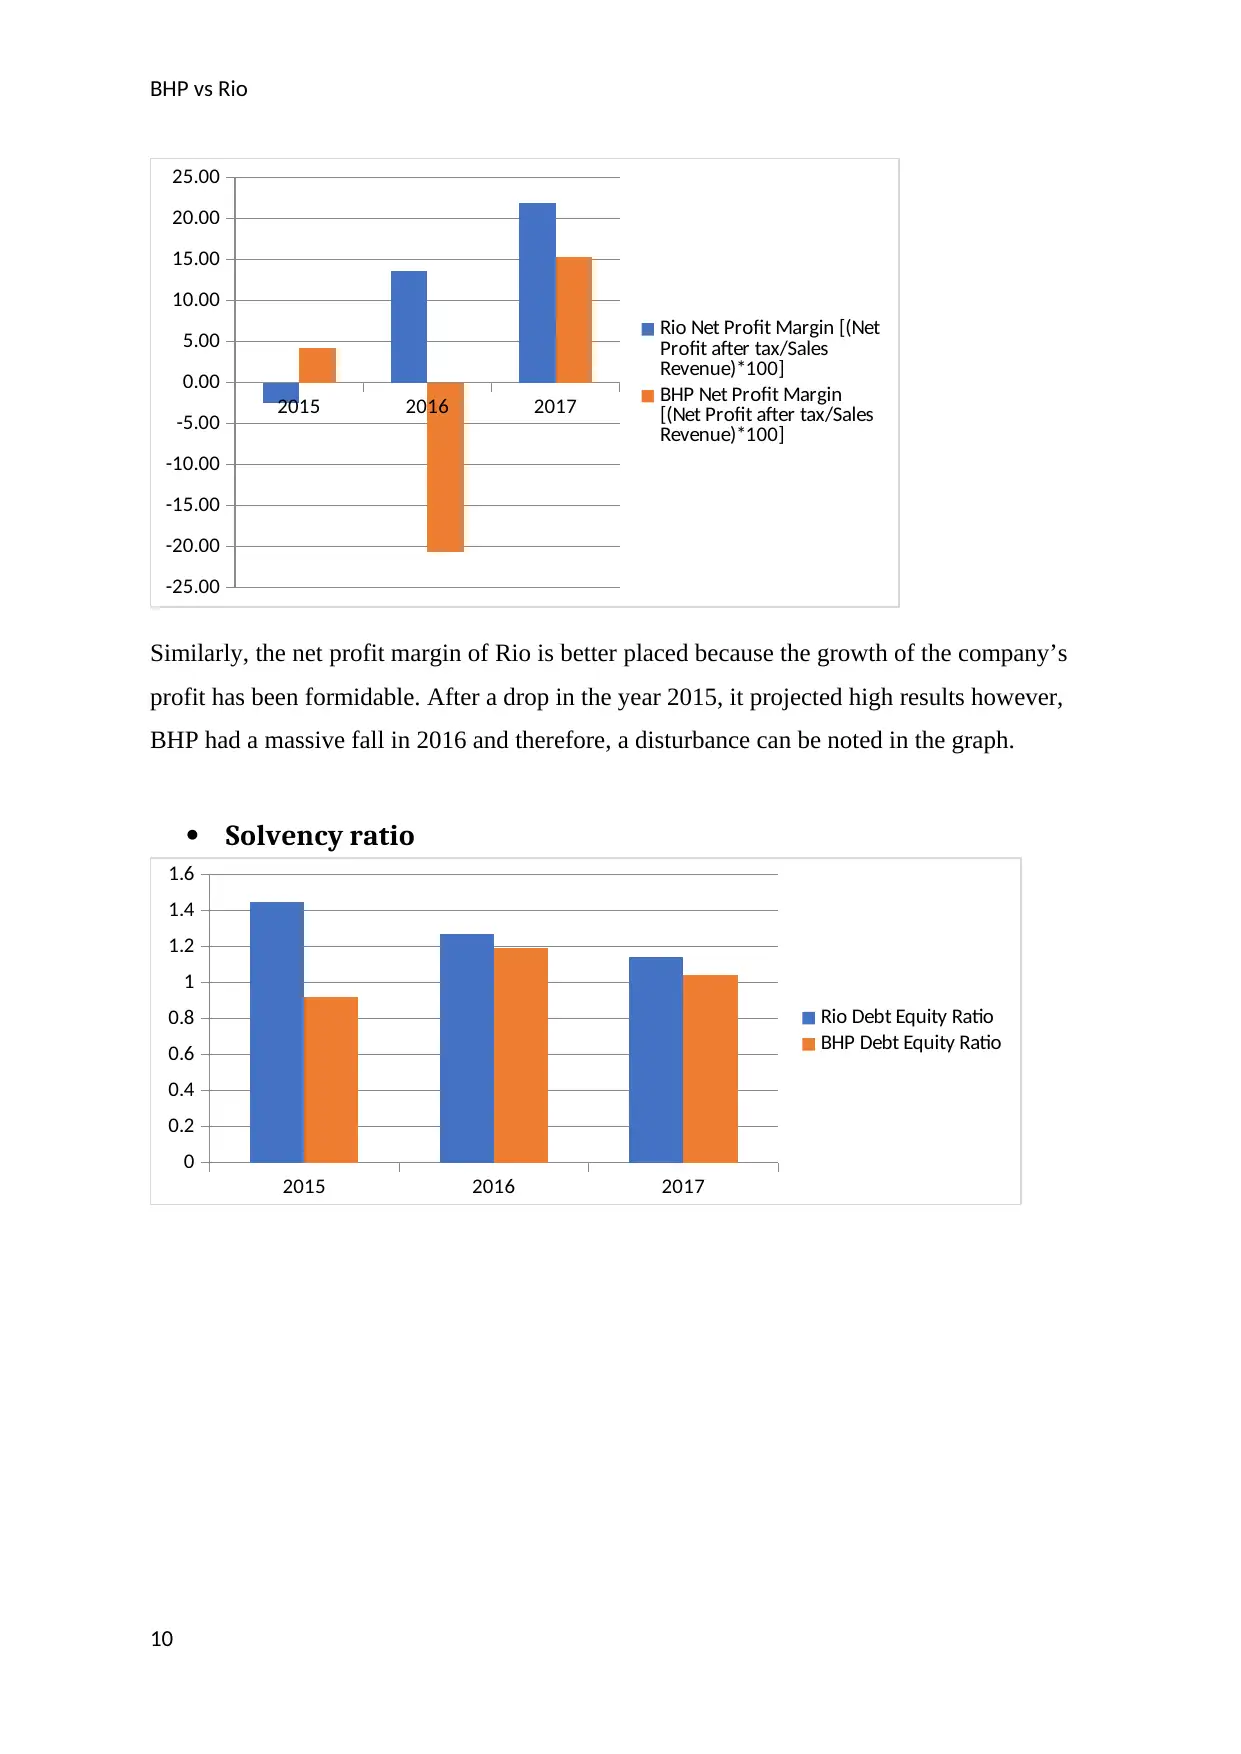
Similarly, the net profit margin of Rio is better placed because the growth of the company’s
profit has been formidable. After a drop in the year 2015, it projected high results however,
BHP had a massive fall in 2016 and therefore, a disturbance can be noted in the graph.
Solvency ratio
2015 2016 2017
0
0.2
0.4
0.6
0.8
1
1.2
1.4
1.6
Rio Debt Equity Ratio
BHP Debt Equity Ratio
10
2015 2016 2017
-25.00
-20.00
-15.00
-10.00
-5.00
0.00
5.00
10.00
15.00
20.00
25.00
Rio Net Profit Margin [(Net
Profit after tax/Sales
Revenue)*100]
BHP Net Profit Margin
[(Net Profit after tax/Sales
Revenue)*100]
Similarly, the net profit margin of Rio is better placed because the growth of the company’s
profit has been formidable. After a drop in the year 2015, it projected high results however,
BHP had a massive fall in 2016 and therefore, a disturbance can be noted in the graph.
Solvency ratio
2015 2016 2017
0
0.2
0.4
0.6
0.8
1
1.2
1.4
1.6
Rio Debt Equity Ratio
BHP Debt Equity Ratio
10
Paraphrase This Document
Need a fresh take? Get an instant paraphrase of this document with our AI Paraphraser
BHP vs Rio
2015 2016 2017
0
0.1
0.2
0.3
0.4
0.5
0.6
0.7
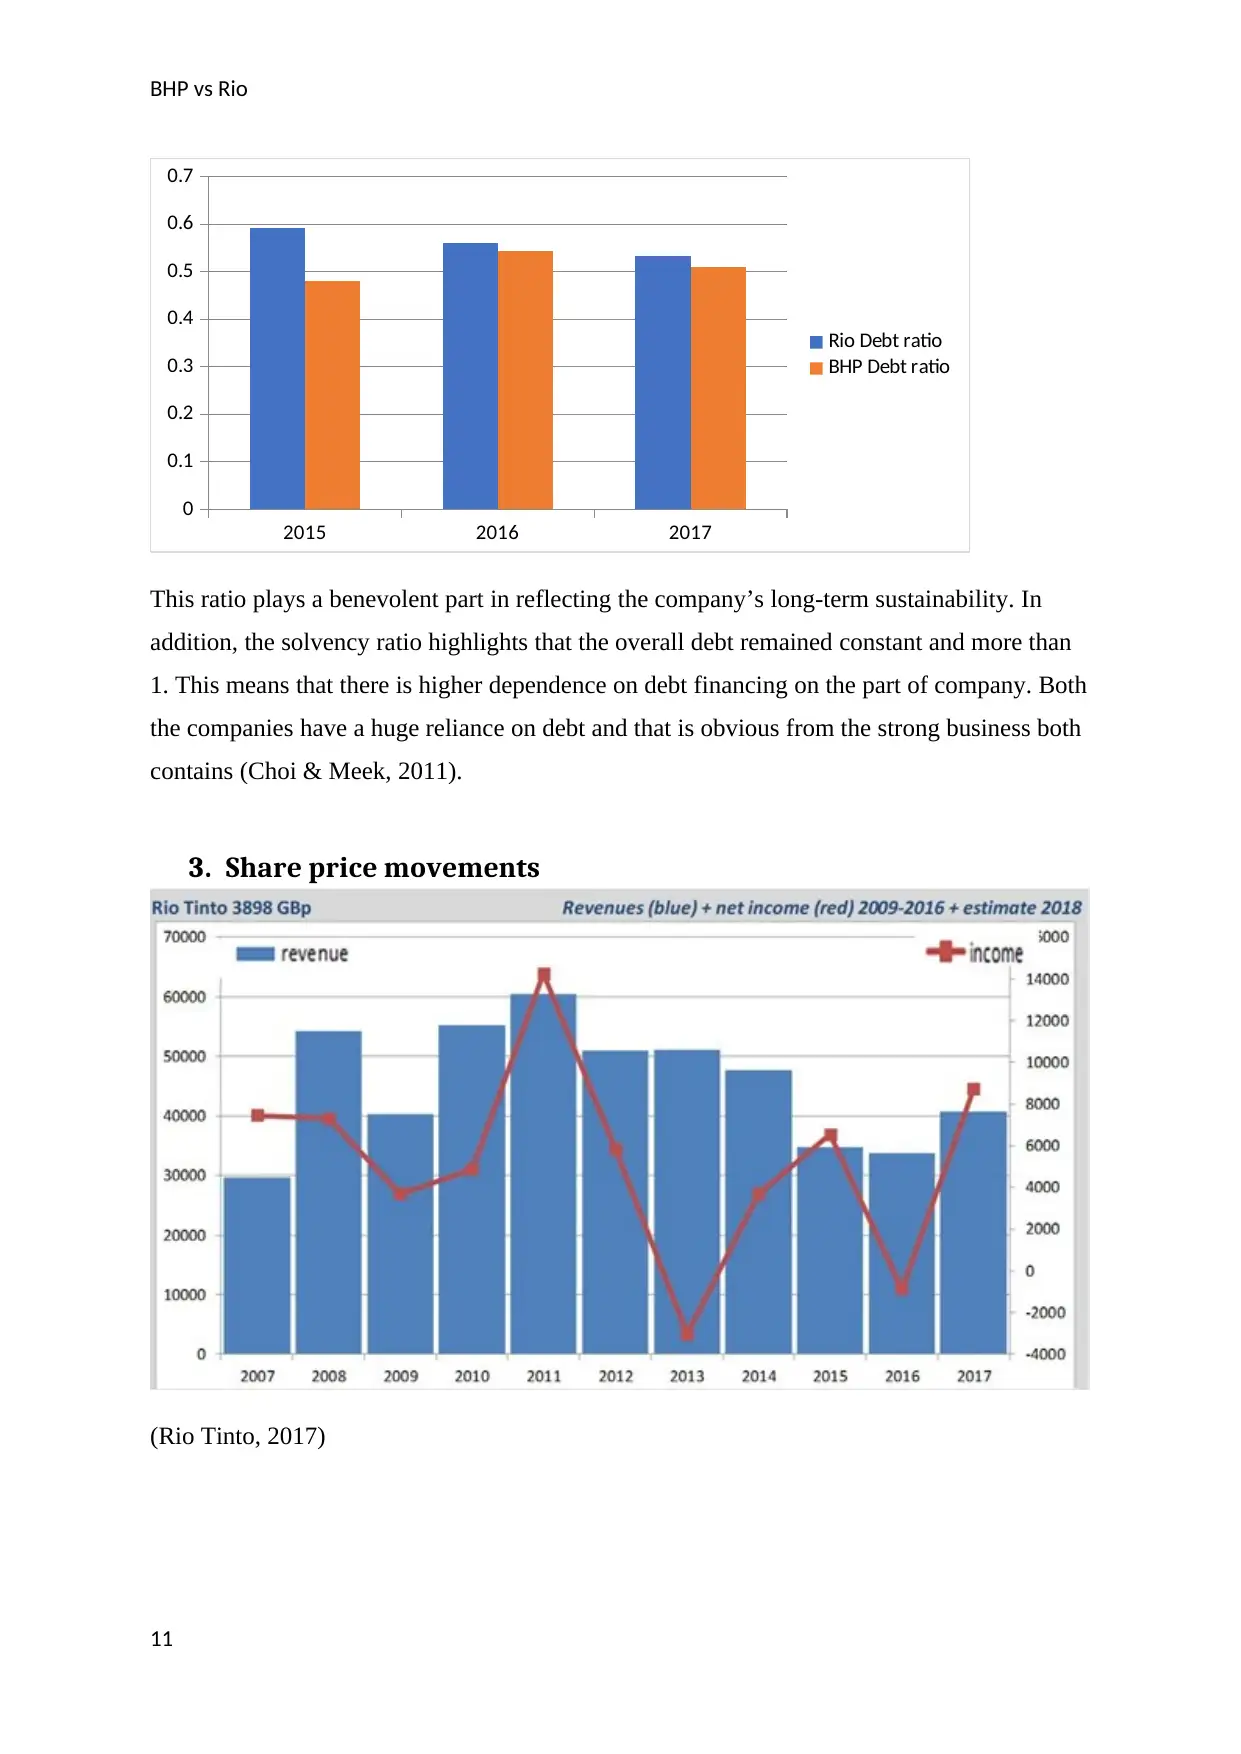
Rio Debt ratio
BHP Debt ratio
This ratio plays a benevolent part in reflecting the company’s long-term sustainability. In
addition, the solvency ratio highlights that the overall debt remained constant and more than
1. This means that there is higher dependence on debt financing on the part of company. Both
the companies have a huge reliance on debt and that is obvious from the strong business both
contains (Choi & Meek, 2011).
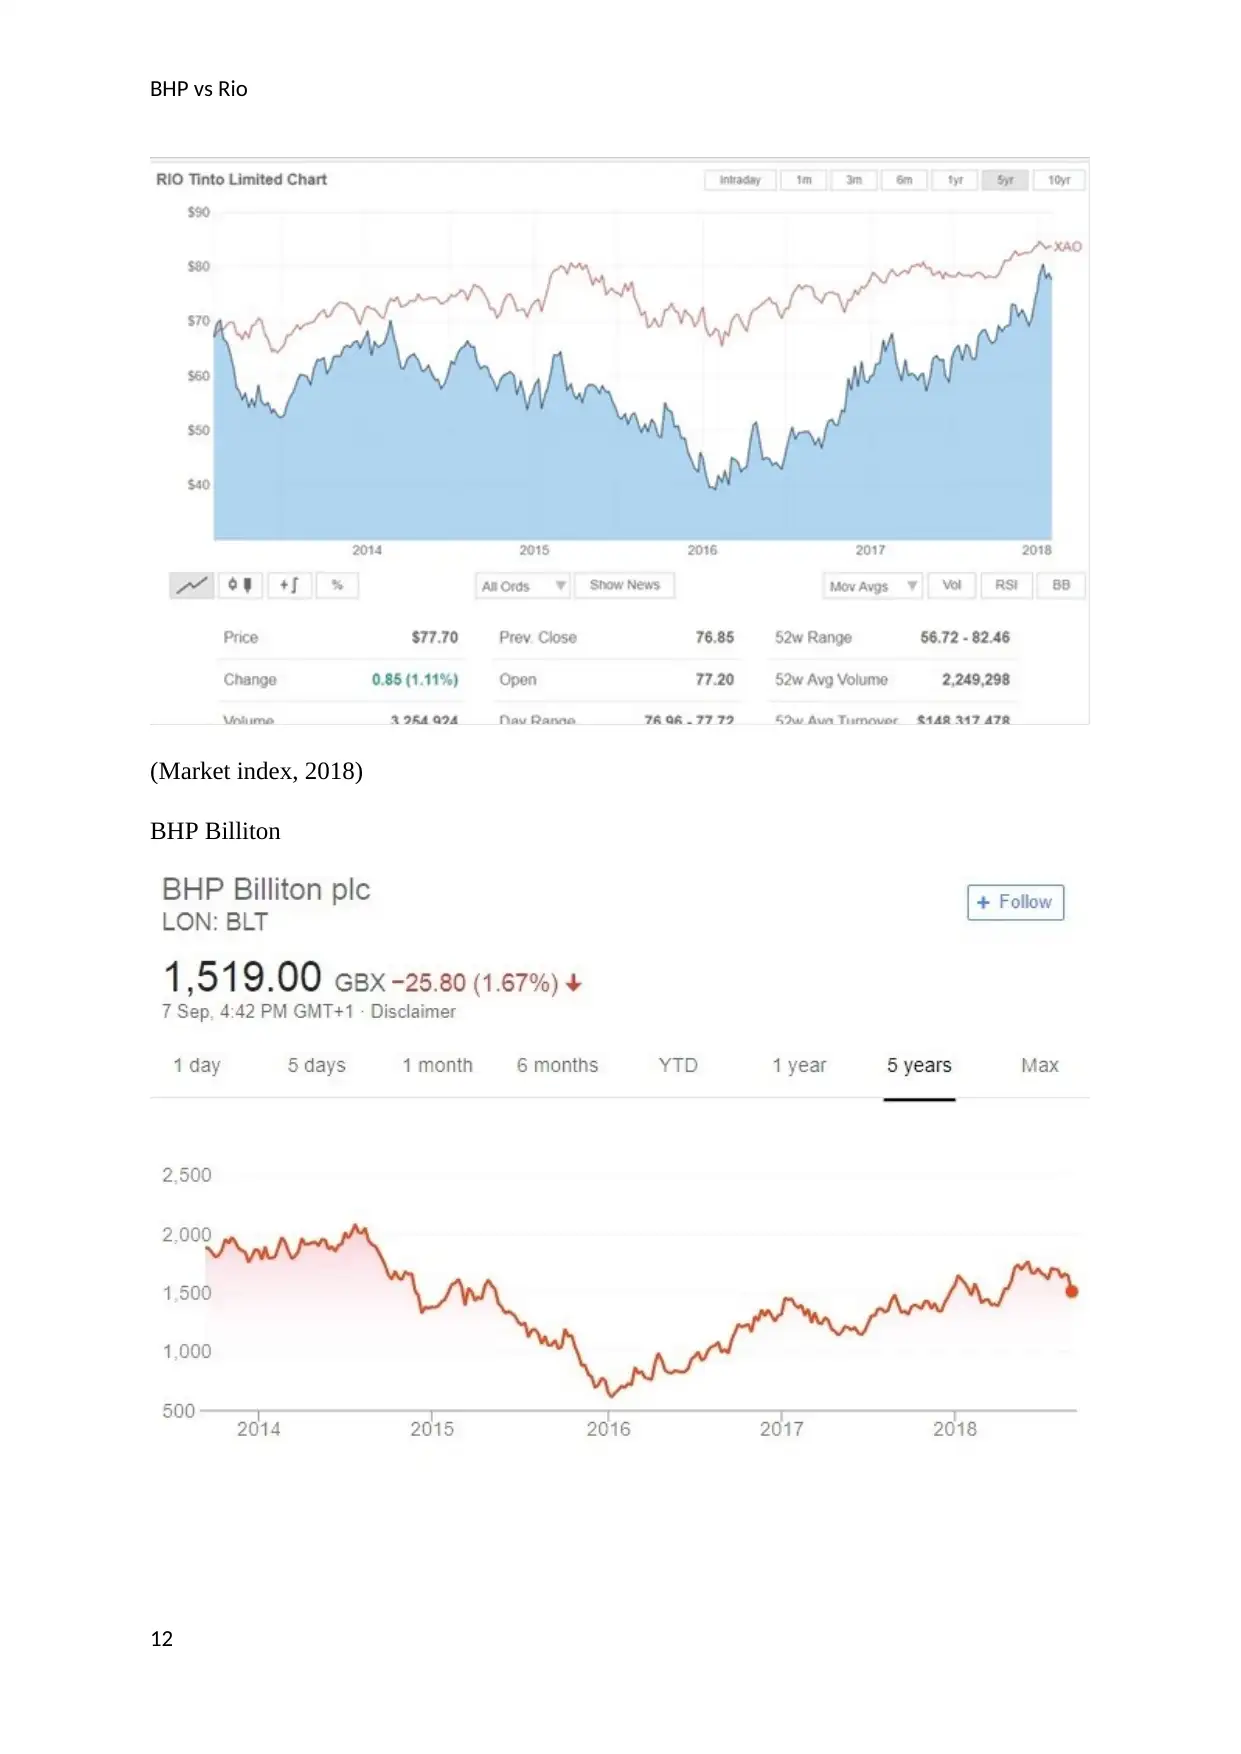
3. Share price movements
(Rio Tinto, 2017)
11
2015 2016 2017
0
0.1
0.2
0.3
0.4
0.5
0.6
0.7
Rio Debt ratio
BHP Debt ratio
This ratio plays a benevolent part in reflecting the company’s long-term sustainability. In
addition, the solvency ratio highlights that the overall debt remained constant and more than
1. This means that there is higher dependence on debt financing on the part of company. Both
the companies have a huge reliance on debt and that is obvious from the strong business both
contains (Choi & Meek, 2011).
3. Share price movements
(Rio Tinto, 2017)
11
BHP vs Rio
(Market index, 2018)
BHP Billiton
12
(Market index, 2018)
BHP Billiton
12
⊘ This is a preview!⊘
Do you want full access?
Subscribe today to unlock all pages.
Trusted by 1+ million students worldwide
1 out of 20
Related Documents


Your All-in-One AI-Powered Toolkit for Academic Success.
+13062052269
info@desklib.com
Available 24*7 on WhatsApp / Email
![[object Object]](/_next/static/media/star-bottom.7253800d.svg)
Unlock your academic potential
Copyright © 2020–2026 A2Z Services. All Rights Reserved. Developed and managed by ZUCOL.