Comprehensive Financial Analysis Report of Blackmores Ltd. (2013-2015)
VerifiedAdded on 2020/03/04
|11
|2191
|400
Report
AI Summary
This report presents a financial analysis of Blackmores Limited, focusing on its performance from 2013 to 2015. The analysis encompasses key financial aspects, including profitability, liquidity, solvency, and efficiency, using tools such as ratio analysis, horizontal analysis, and vertical analysis. The report examines the company's revenue growth, net profit, gross profit, and financial position, highlighting improvements in net profit margin, gross profit margin, and return on equity. It also evaluates liquidity, debt ratio, assets turnover ratio, and inventory turnover ratio. Furthermore, the report analyzes the limitations of ratio analysis and discusses the significance of the annual report. The findings indicate that Blackmores has improved its financial performance over the period, although its liquidity position has weakened. The report concludes with an overview of the company's market performance and the implications of its financial strategies.
Running Head: Financial Analysis
Report on Financial Analysis of Balckmores Ltd.
Report on Financial Analysis of Balckmores Ltd.
Paraphrase This Document
Need a fresh take? Get an instant paraphrase of this document with our AI Paraphraser
Financial Analysis 2
Contents
Executive Summary.........................................................................................................................3
Introduction......................................................................................................................................3
Overview of Blackmores: Firm’s Strategy and Prospects...............................................................3
Financial Analysis of Blackmores...................................................................................................4
Limitations of Ratio Analysis..........................................................................................................6
Usefulness of the Annual Report and the information Contained Therein.....................................7
Conclusion.......................................................................................................................................7
References........................................................................................................................................8
Appendix-1:.....................................................................................................................................9
Appendix-2:.....................................................................................................................................9
Financial Analysis 3
Executive Summary
Blackmores Limited’s financial analysis for the financial year 2015 has been carried out
in this report. The outcome of analysis depicts that the company has been able to improve the
financial performance over the period from 2013 to 2015. The net profit margin and return on
equity has been found to be increasing. The net profit margin increased from 7.65% to 9.96%
and the return on equity increased from 25.51% to 35.34%.
Introduction
The analysis of the financial statements of a company provides evaluation of the
company’s profitability, liquidity, solvency, and efficiency which are four crucial aspects of the
business (Gibson, 2012). This analysis has impact on the investor’s decision, lender’s decisions
and the government’s revenue policies. In this context, this report has been prepared to provide
financial performance analysis of Blackmores for the year 2015.
Overview of Blackmores
Blackmore limited is listed on the Australian Stock Exchange having headquarters in
Australia. The company was incorporated way back in 1930 and since then it has grown
magnificently standing with $471.62 million revenues in 2015 (Blackmore Limited, 2015).
Blackmore operates in the consumer goods industry with the main products being produced for
human and animal healthcare. The company’s mission is to expand the business operations
outside Australia and increase its reach to a large part of population. For the achievement of the
mission, the company is working with the strategy of delivering quality products. The focus of
the company is on improving the quality of products, which will push the demand upside.
Further, the company is also considering expanding the business to the Asian countries namely
China and Malaysia (Blackmore Limited, 2015). The company is running with the goal of
satisfying the customers to the hundred percent. It believes that customer satisfaction is
necessary for the achievement of the company’s mission and vision.
⊘ This is a preview!⊘
Do you want full access?
Subscribe today to unlock all pages.
Trusted by 1+ million students worldwide
Financial Analysis 4
Financial Analysis of Blackmores
In order to analyze the financial performance, it is crucial to extract the information from
various sources which mainly comprise the financial statements, annual report, and board’s
report. The financial statements of a company comprise of three main components such as
income statement, balance sheet, and the cash flow statement. The different piece of information
is provided by these different components of the financial statements. Further, the companies
listed on the stock exchange are required to prepare the annual reports that contain essential
information about the company’s business. The board’s report provides information about the
company’s future plans and prospects.
The information collected from the above discussed resources is analyzed by applying the
financial evaluation tools. The ratio analysis is the most commonly used financial evaluation tool
(Tracy, 2012). However, the other evaluation tools such as vertical analysis and horizontal
analysis are also used in assessing the financial performance of a company. The ratio analysis
covers all crucial aspects of the business such as profitability, liquidity, solvency, and efficiency.
The ratios not only provide analysis into the trend but these also facilitates the comparison of the
company with its peers (Tracy, 2012).
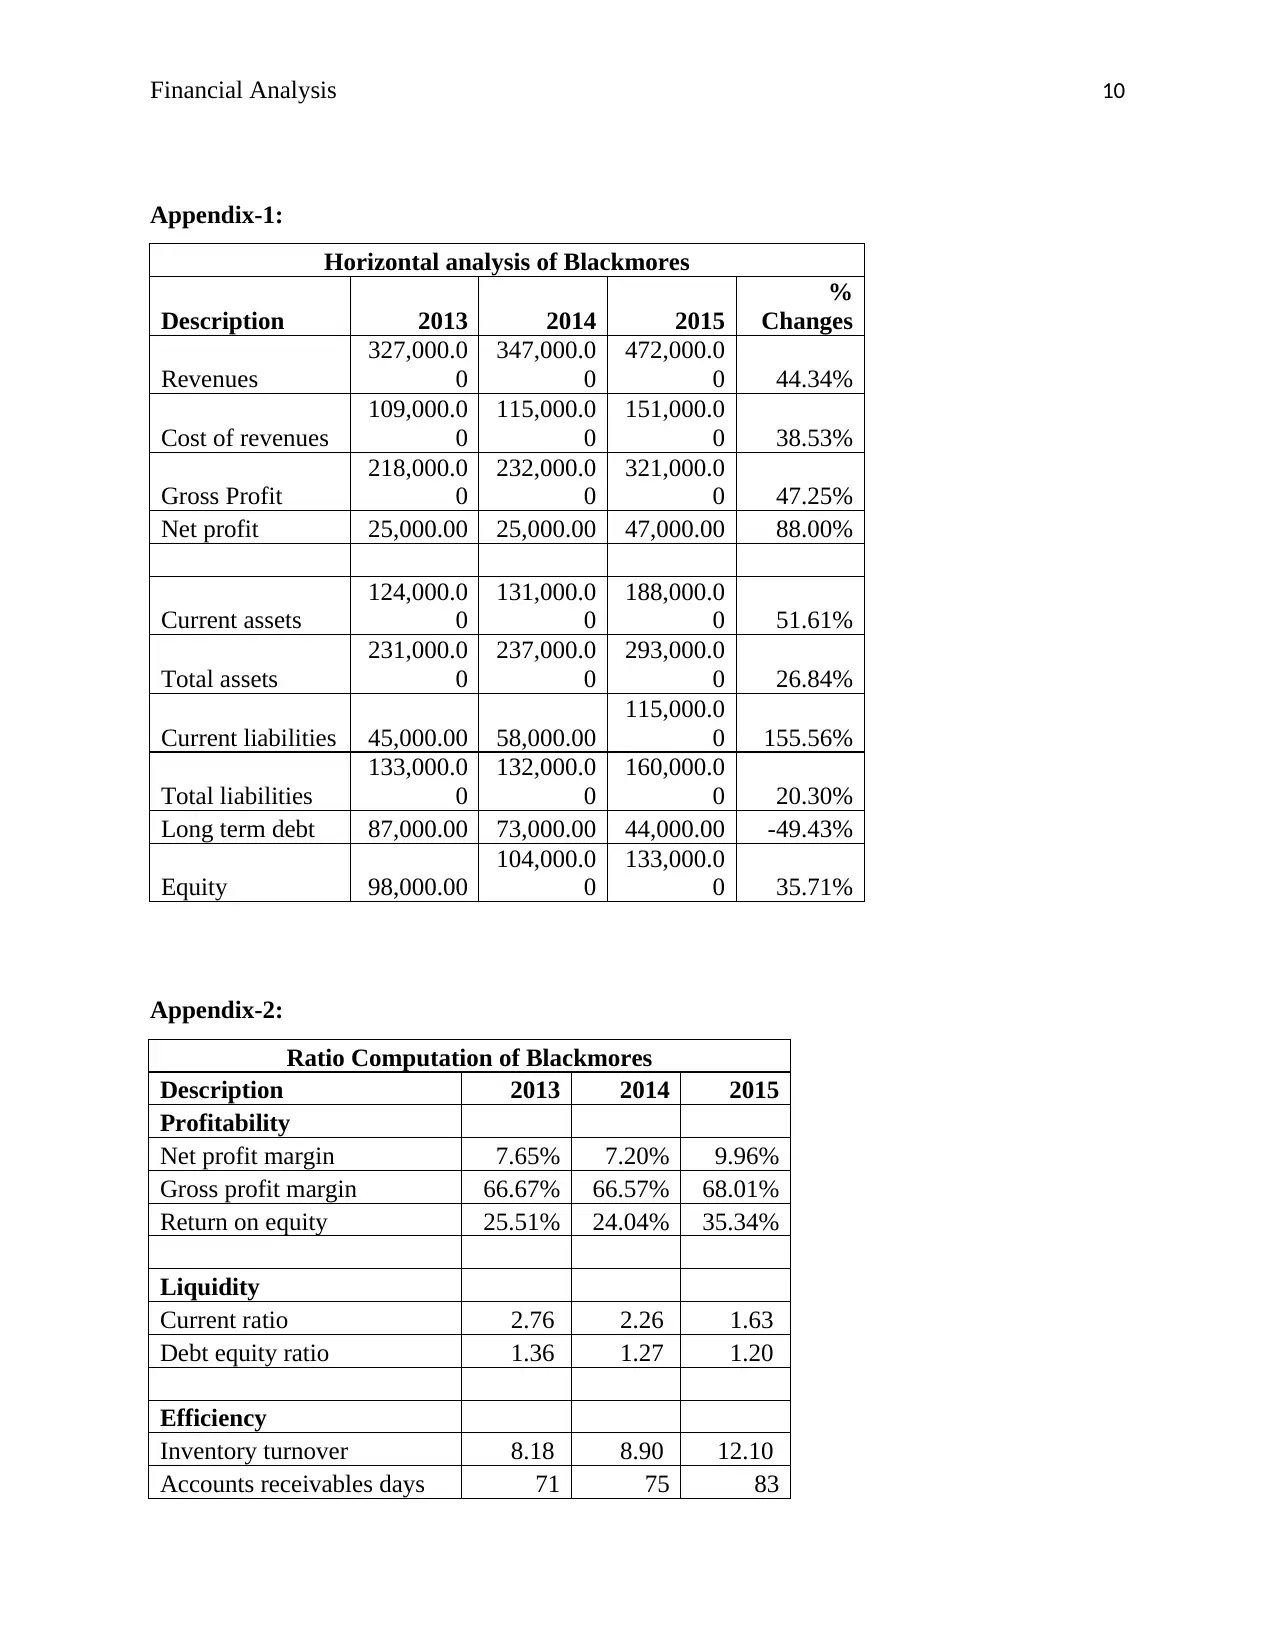
The horizontal analysis on the financial statements of Blackmores Limited is presented in
the appendix-1.
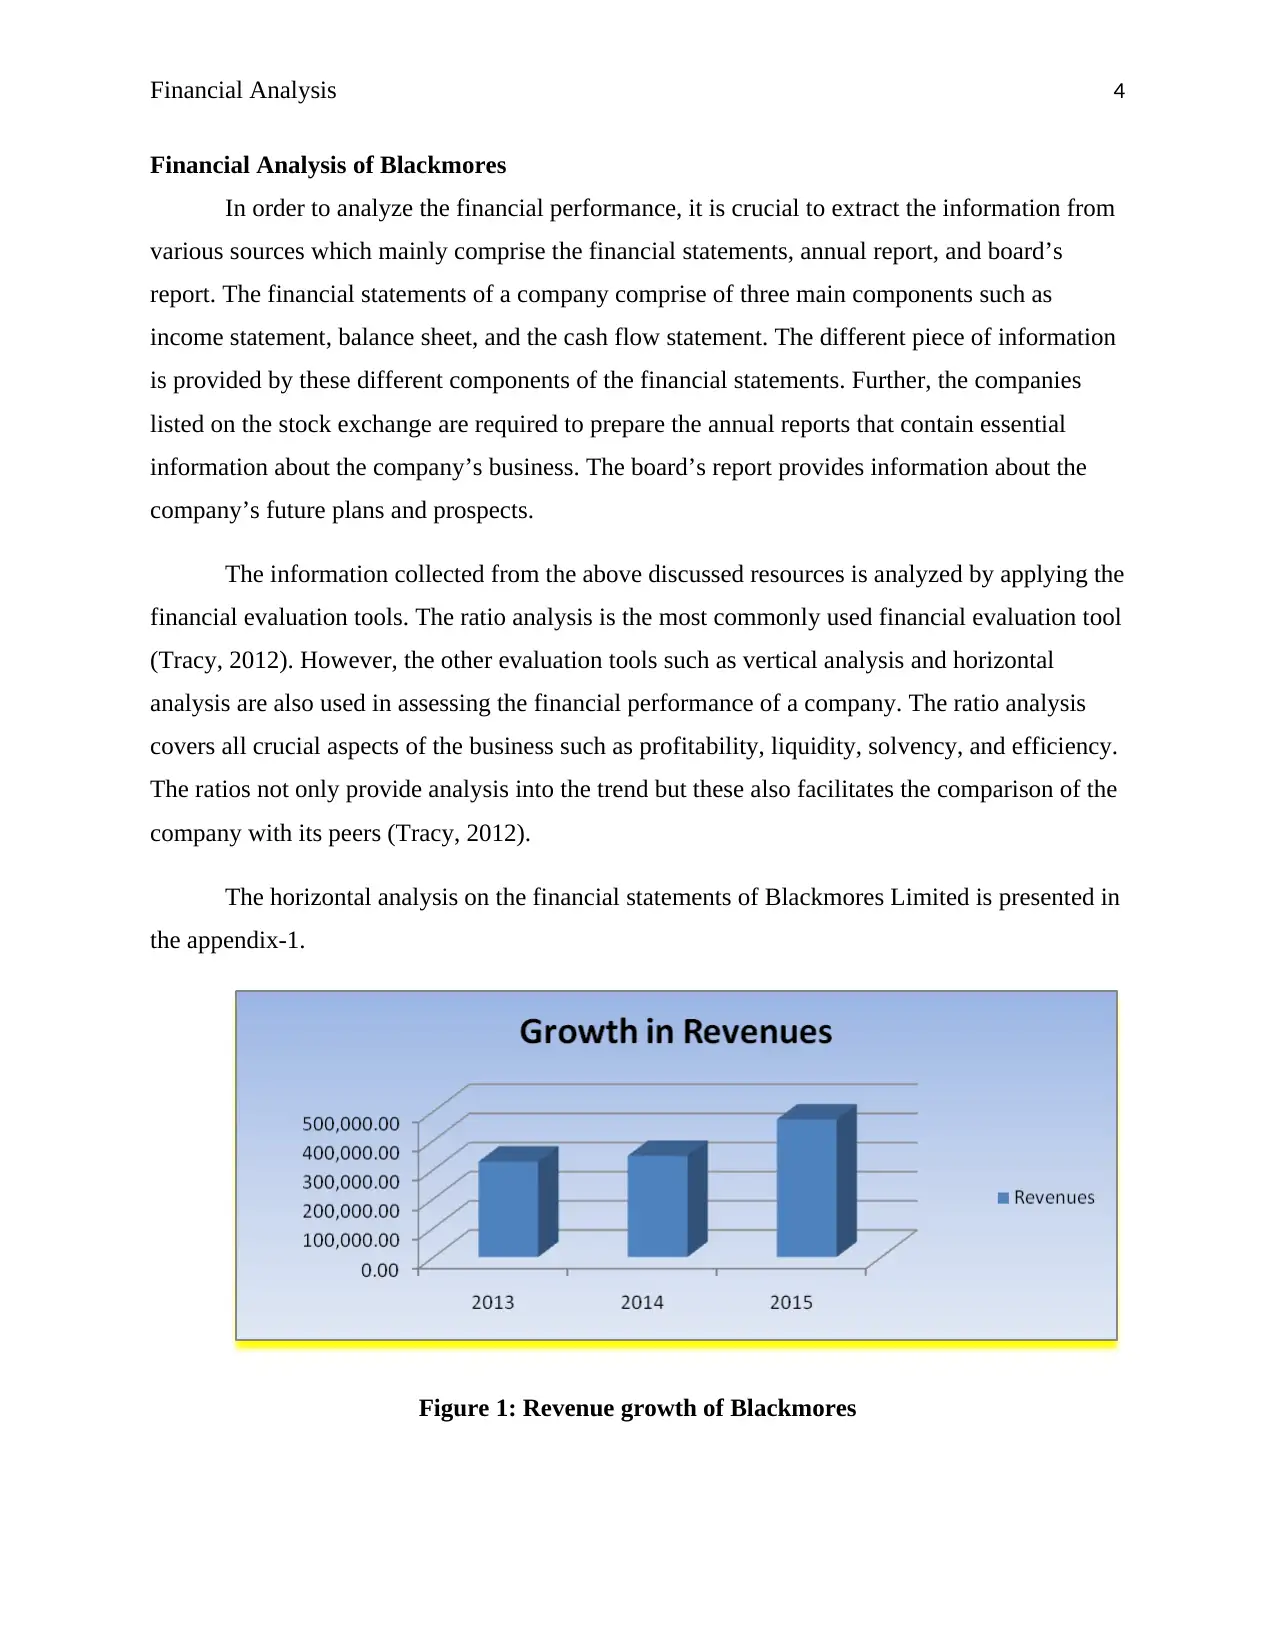
Figure 1: Revenue growth of Blackmores
Financial Analysis of Blackmores
In order to analyze the financial performance, it is crucial to extract the information from
various sources which mainly comprise the financial statements, annual report, and board’s
report. The financial statements of a company comprise of three main components such as
income statement, balance sheet, and the cash flow statement. The different piece of information
is provided by these different components of the financial statements. Further, the companies
listed on the stock exchange are required to prepare the annual reports that contain essential
information about the company’s business. The board’s report provides information about the
company’s future plans and prospects.
The information collected from the above discussed resources is analyzed by applying the
financial evaluation tools. The ratio analysis is the most commonly used financial evaluation tool
(Tracy, 2012). However, the other evaluation tools such as vertical analysis and horizontal
analysis are also used in assessing the financial performance of a company. The ratio analysis
covers all crucial aspects of the business such as profitability, liquidity, solvency, and efficiency.
The ratios not only provide analysis into the trend but these also facilitates the comparison of the
company with its peers (Tracy, 2012).
The horizontal analysis on the financial statements of Blackmores Limited is presented in
the appendix-1.
Figure 1: Revenue growth of Blackmores
Paraphrase This Document
Need a fresh take? Get an instant paraphrase of this document with our AI Paraphraser
Financial Analysis 5
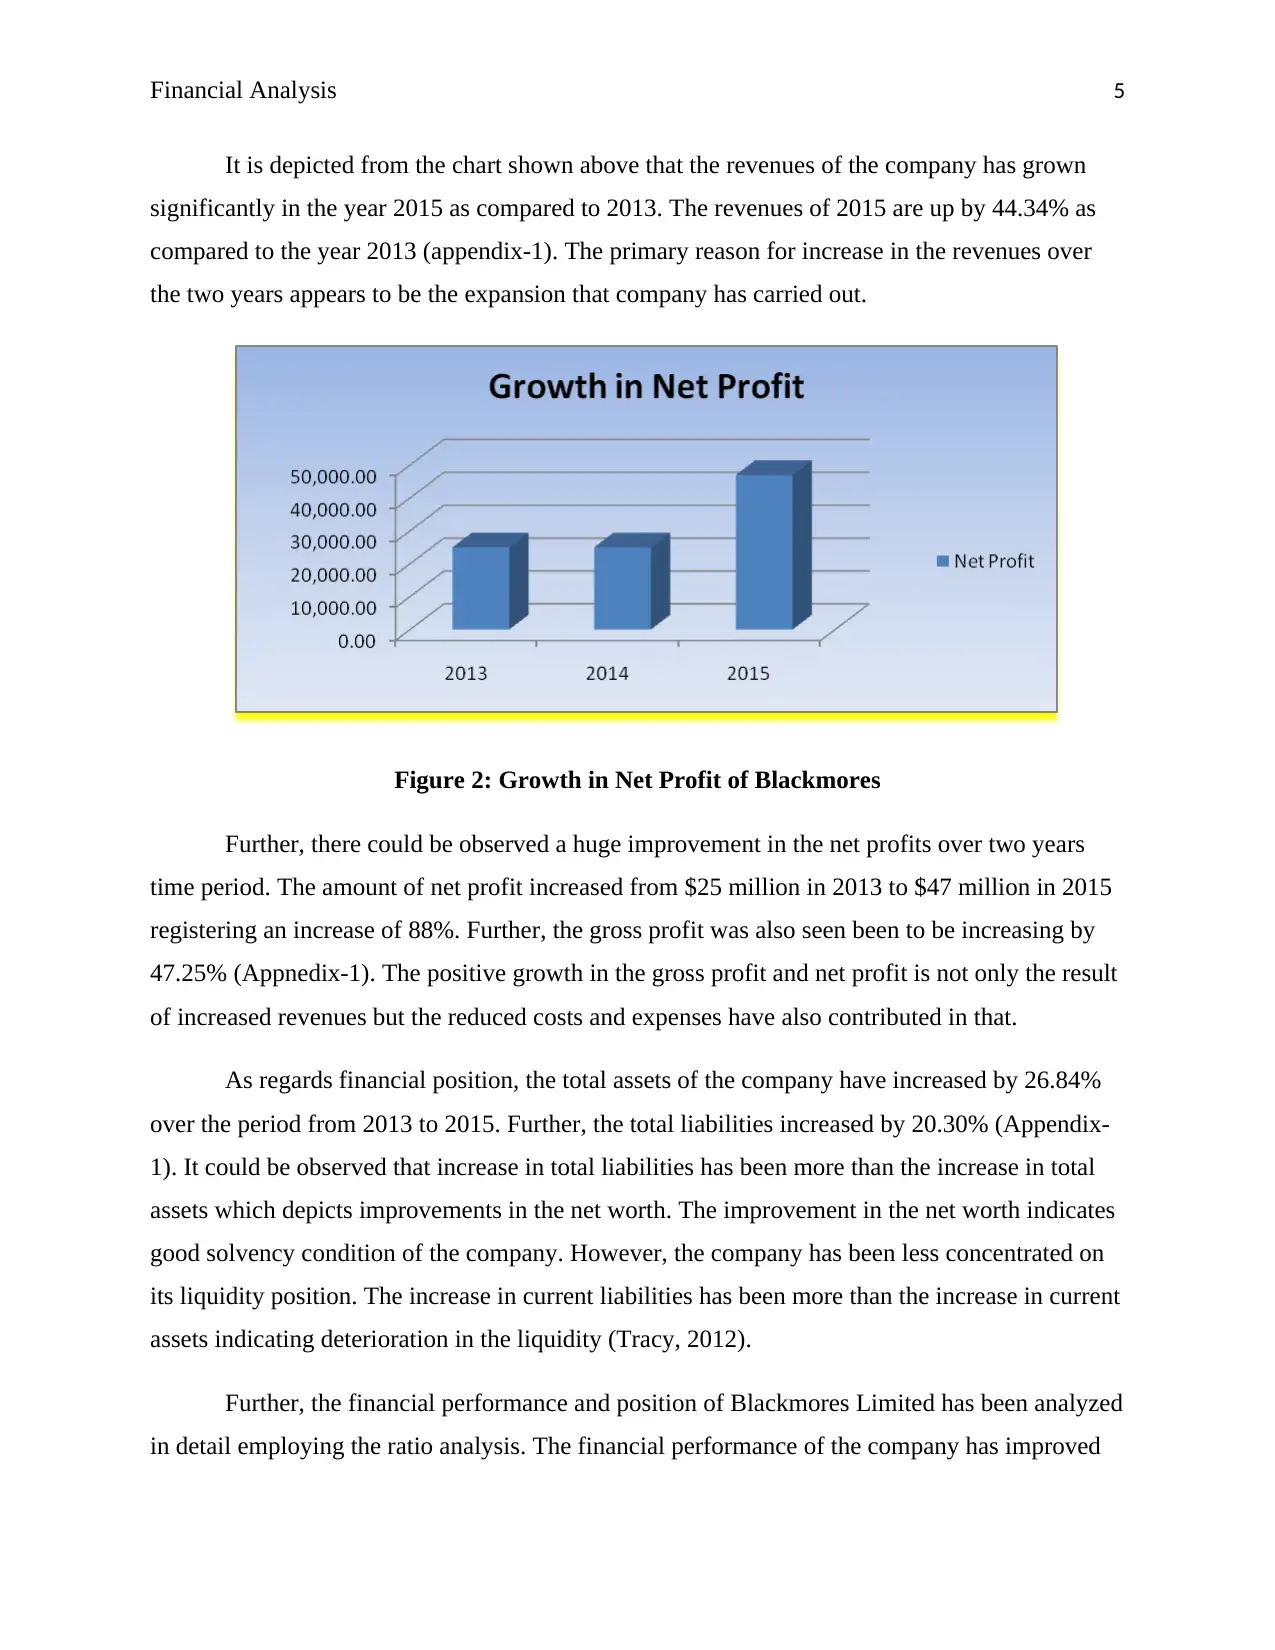
It is depicted from the chart shown above that the revenues of the company has grown
significantly in the year 2015 as compared to 2013. The revenues of 2015 are up by 44.34% as
compared to the year 2013 (appendix-1). The primary reason for increase in the revenues over
the two years appears to be the expansion that company has carried out.
Figure 2: Growth in Net Profit of Blackmores
Further, there could be observed a huge improvement in the net profits over two years
time period. The amount of net profit increased from $25 million in 2013 to $47 million in 2015
registering an increase of 88%. Further, the gross profit was also seen been to be increasing by
47.25% (Appnedix-1). The positive growth in the gross profit and net profit is not only the result
of increased revenues but the reduced costs and expenses have also contributed in that.
As regards financial position, the total assets of the company have increased by 26.84%
over the period from 2013 to 2015. Further, the total liabilities increased by 20.30% (Appendix-
1). It could be observed that increase in total liabilities has been more than the increase in total
assets which depicts improvements in the net worth. The improvement in the net worth indicates
good solvency condition of the company. However, the company has been less concentrated on
its liquidity position. The increase in current liabilities has been more than the increase in current
assets indicating deterioration in the liquidity (Tracy, 2012).
Further, the financial performance and position of Blackmores Limited has been analyzed
in detail employing the ratio analysis. The financial performance of the company has improved
Financial Analysis 6
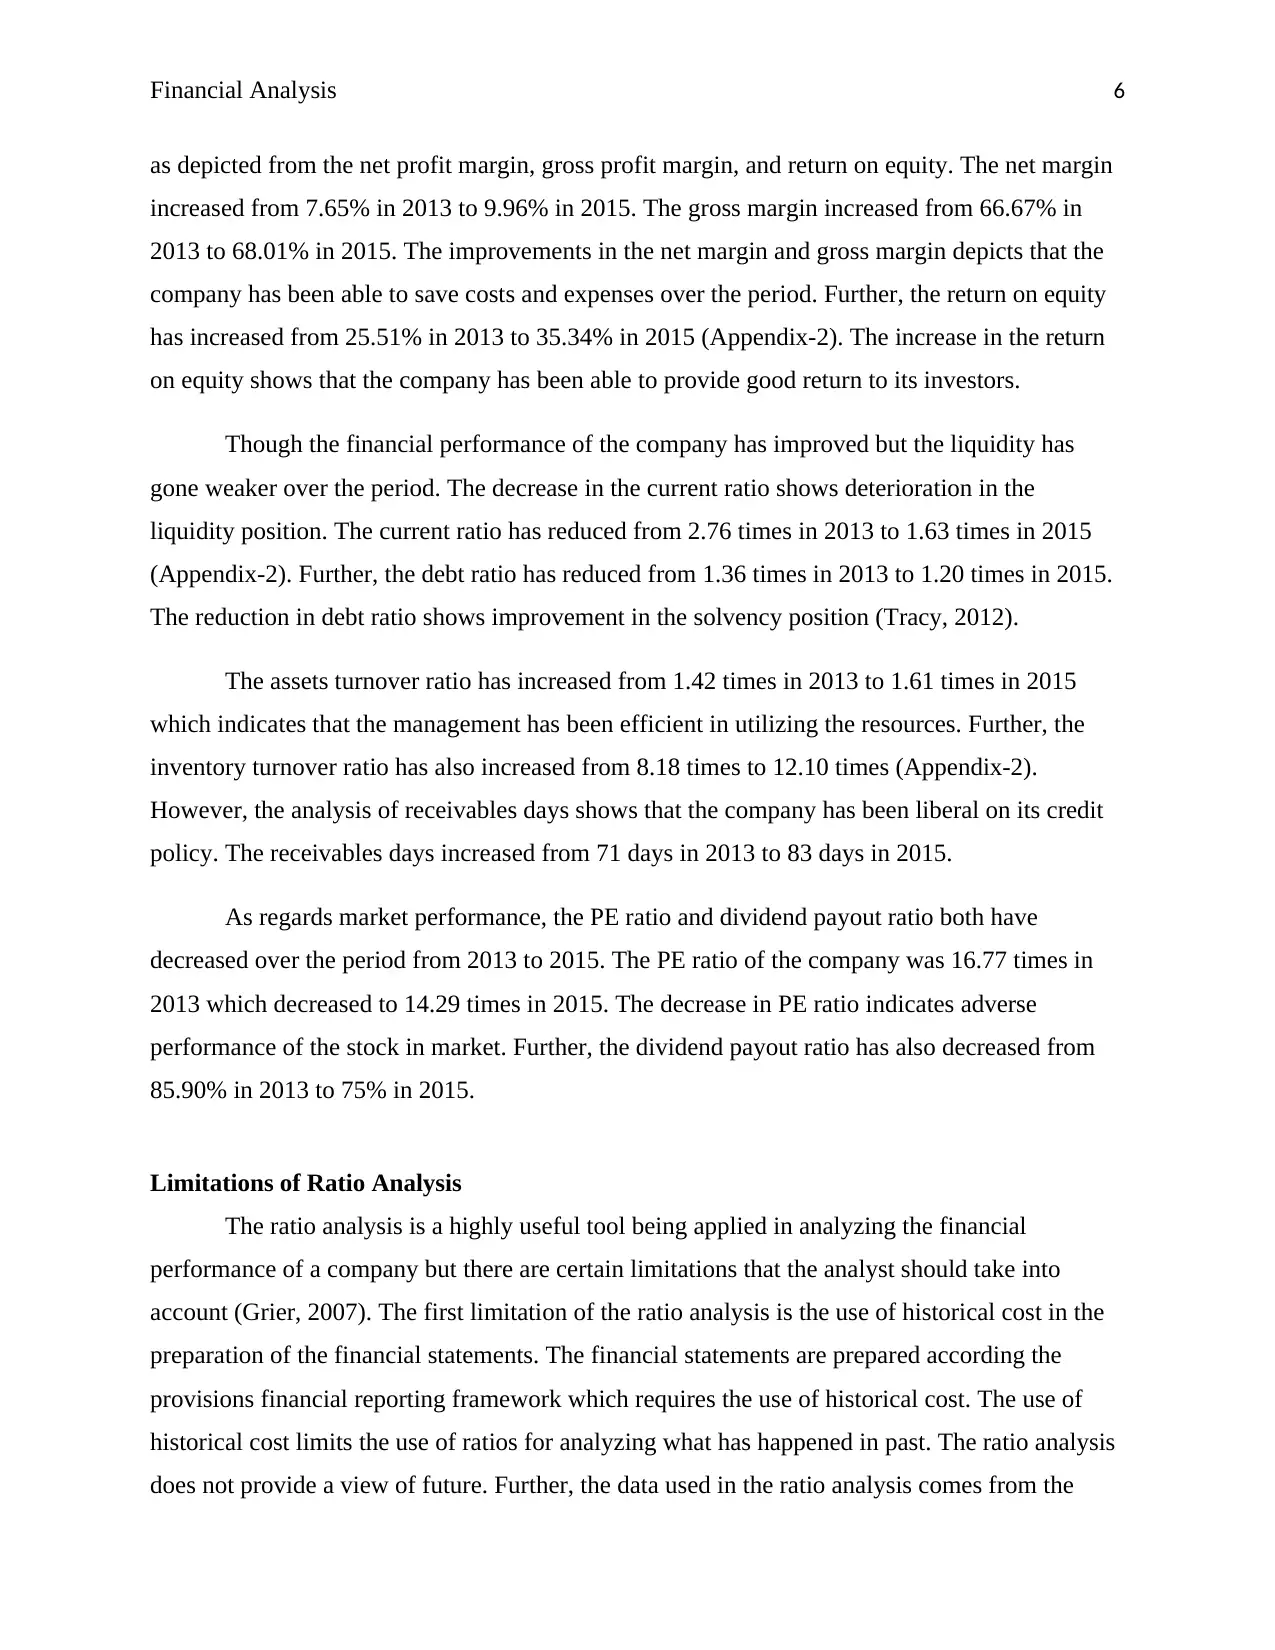
as depicted from the net profit margin, gross profit margin, and return on equity. The net margin
increased from 7.65% in 2013 to 9.96% in 2015. The gross margin increased from 66.67% in
2013 to 68.01% in 2015. The improvements in the net margin and gross margin depicts that the
company has been able to save costs and expenses over the period. Further, the return on equity
has increased from 25.51% in 2013 to 35.34% in 2015 (Appendix-2). The increase in the return
on equity shows that the company has been able to provide good return to its investors.
Though the financial performance of the company has improved but the liquidity has
gone weaker over the period. The decrease in the current ratio shows deterioration in the
liquidity position. The current ratio has reduced from 2.76 times in 2013 to 1.63 times in 2015
(Appendix-2). Further, the debt ratio has reduced from 1.36 times in 2013 to 1.20 times in 2015.
The reduction in debt ratio shows improvement in the solvency position (Tracy, 2012).
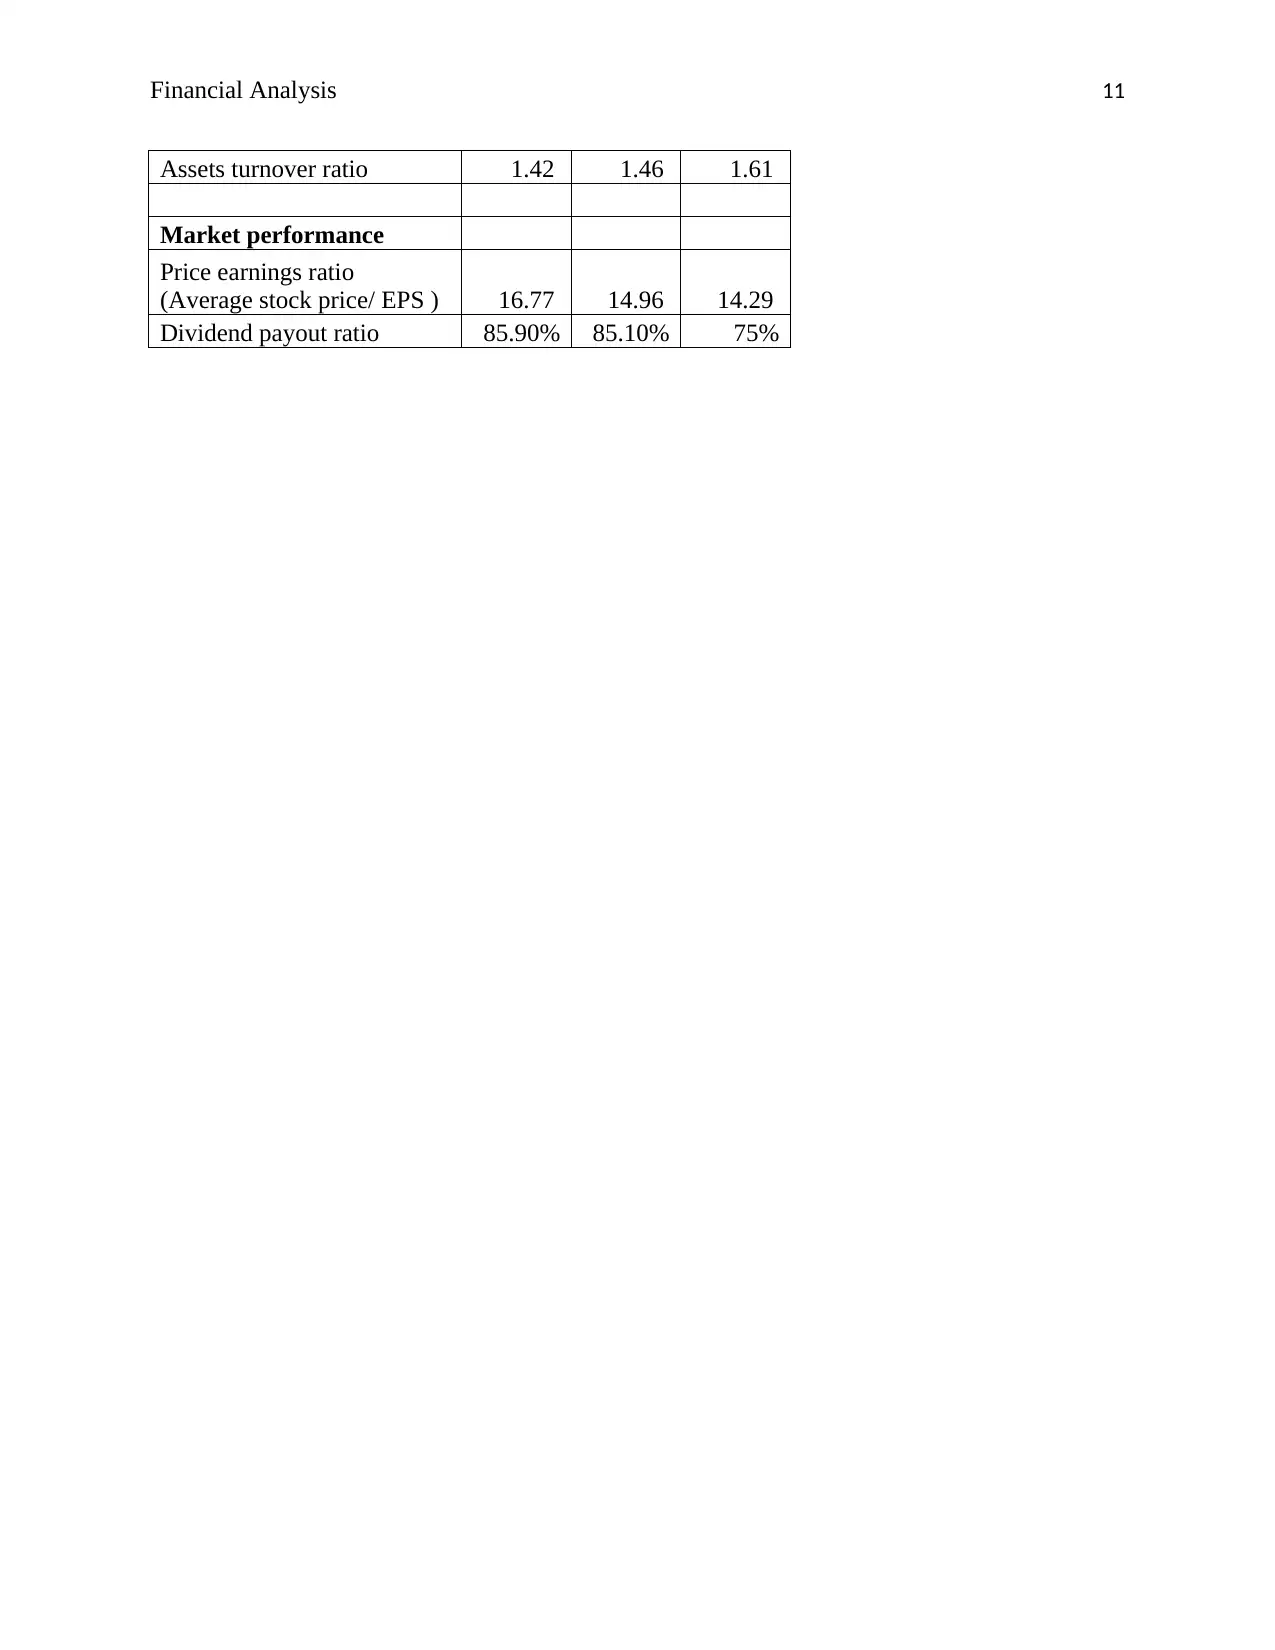
The assets turnover ratio has increased from 1.42 times in 2013 to 1.61 times in 2015
which indicates that the management has been efficient in utilizing the resources. Further, the
inventory turnover ratio has also increased from 8.18 times to 12.10 times (Appendix-2).
However, the analysis of receivables days shows that the company has been liberal on its credit
policy. The receivables days increased from 71 days in 2013 to 83 days in 2015.
As regards market performance, the PE ratio and dividend payout ratio both have
decreased over the period from 2013 to 2015. The PE ratio of the company was 16.77 times in
2013 which decreased to 14.29 times in 2015. The decrease in PE ratio indicates adverse
performance of the stock in market. Further, the dividend payout ratio has also decreased from
85.90% in 2013 to 75% in 2015.
Limitations of Ratio Analysis
The ratio analysis is a highly useful tool being applied in analyzing the financial
performance of a company but there are certain limitations that the analyst should take into
account (Grier, 2007). The first limitation of the ratio analysis is the use of historical cost in the
preparation of the financial statements. The financial statements are prepared according the
provisions financial reporting framework which requires the use of historical cost. The use of
historical cost limits the use of ratios for analyzing what has happened in past. The ratio analysis
does not provide a view of future. Further, the data used in the ratio analysis comes from the
as depicted from the net profit margin, gross profit margin, and return on equity. The net margin
increased from 7.65% in 2013 to 9.96% in 2015. The gross margin increased from 66.67% in
2013 to 68.01% in 2015. The improvements in the net margin and gross margin depicts that the
company has been able to save costs and expenses over the period. Further, the return on equity
has increased from 25.51% in 2013 to 35.34% in 2015 (Appendix-2). The increase in the return
on equity shows that the company has been able to provide good return to its investors.
Though the financial performance of the company has improved but the liquidity has
gone weaker over the period. The decrease in the current ratio shows deterioration in the
liquidity position. The current ratio has reduced from 2.76 times in 2013 to 1.63 times in 2015
(Appendix-2). Further, the debt ratio has reduced from 1.36 times in 2013 to 1.20 times in 2015.
The reduction in debt ratio shows improvement in the solvency position (Tracy, 2012).
The assets turnover ratio has increased from 1.42 times in 2013 to 1.61 times in 2015
which indicates that the management has been efficient in utilizing the resources. Further, the
inventory turnover ratio has also increased from 8.18 times to 12.10 times (Appendix-2).
However, the analysis of receivables days shows that the company has been liberal on its credit
policy. The receivables days increased from 71 days in 2013 to 83 days in 2015.
As regards market performance, the PE ratio and dividend payout ratio both have
decreased over the period from 2013 to 2015. The PE ratio of the company was 16.77 times in
2013 which decreased to 14.29 times in 2015. The decrease in PE ratio indicates adverse
performance of the stock in market. Further, the dividend payout ratio has also decreased from
85.90% in 2013 to 75% in 2015.
Limitations of Ratio Analysis
The ratio analysis is a highly useful tool being applied in analyzing the financial
performance of a company but there are certain limitations that the analyst should take into
account (Grier, 2007). The first limitation of the ratio analysis is the use of historical cost in the
preparation of the financial statements. The financial statements are prepared according the
provisions financial reporting framework which requires the use of historical cost. The use of
historical cost limits the use of ratios for analyzing what has happened in past. The ratio analysis
does not provide a view of future. Further, the data used in the ratio analysis comes from the
⊘ This is a preview!⊘
Do you want full access?
Subscribe today to unlock all pages.
Trusted by 1+ million students worldwide
Financial Analysis 7
financial statements which are prepared using different policies and methods. The accounting
rules permit the use of different accounting methods which could lead differences in the
accounting figures of two companies. Therefore, the comparison based on the ratios would
become less effective in such a case. Apart from that the ratio analysis does not cover other
aspects of the business such as quality improvement, customer satisfaction and employee
satisfaction (Grier, 2007).
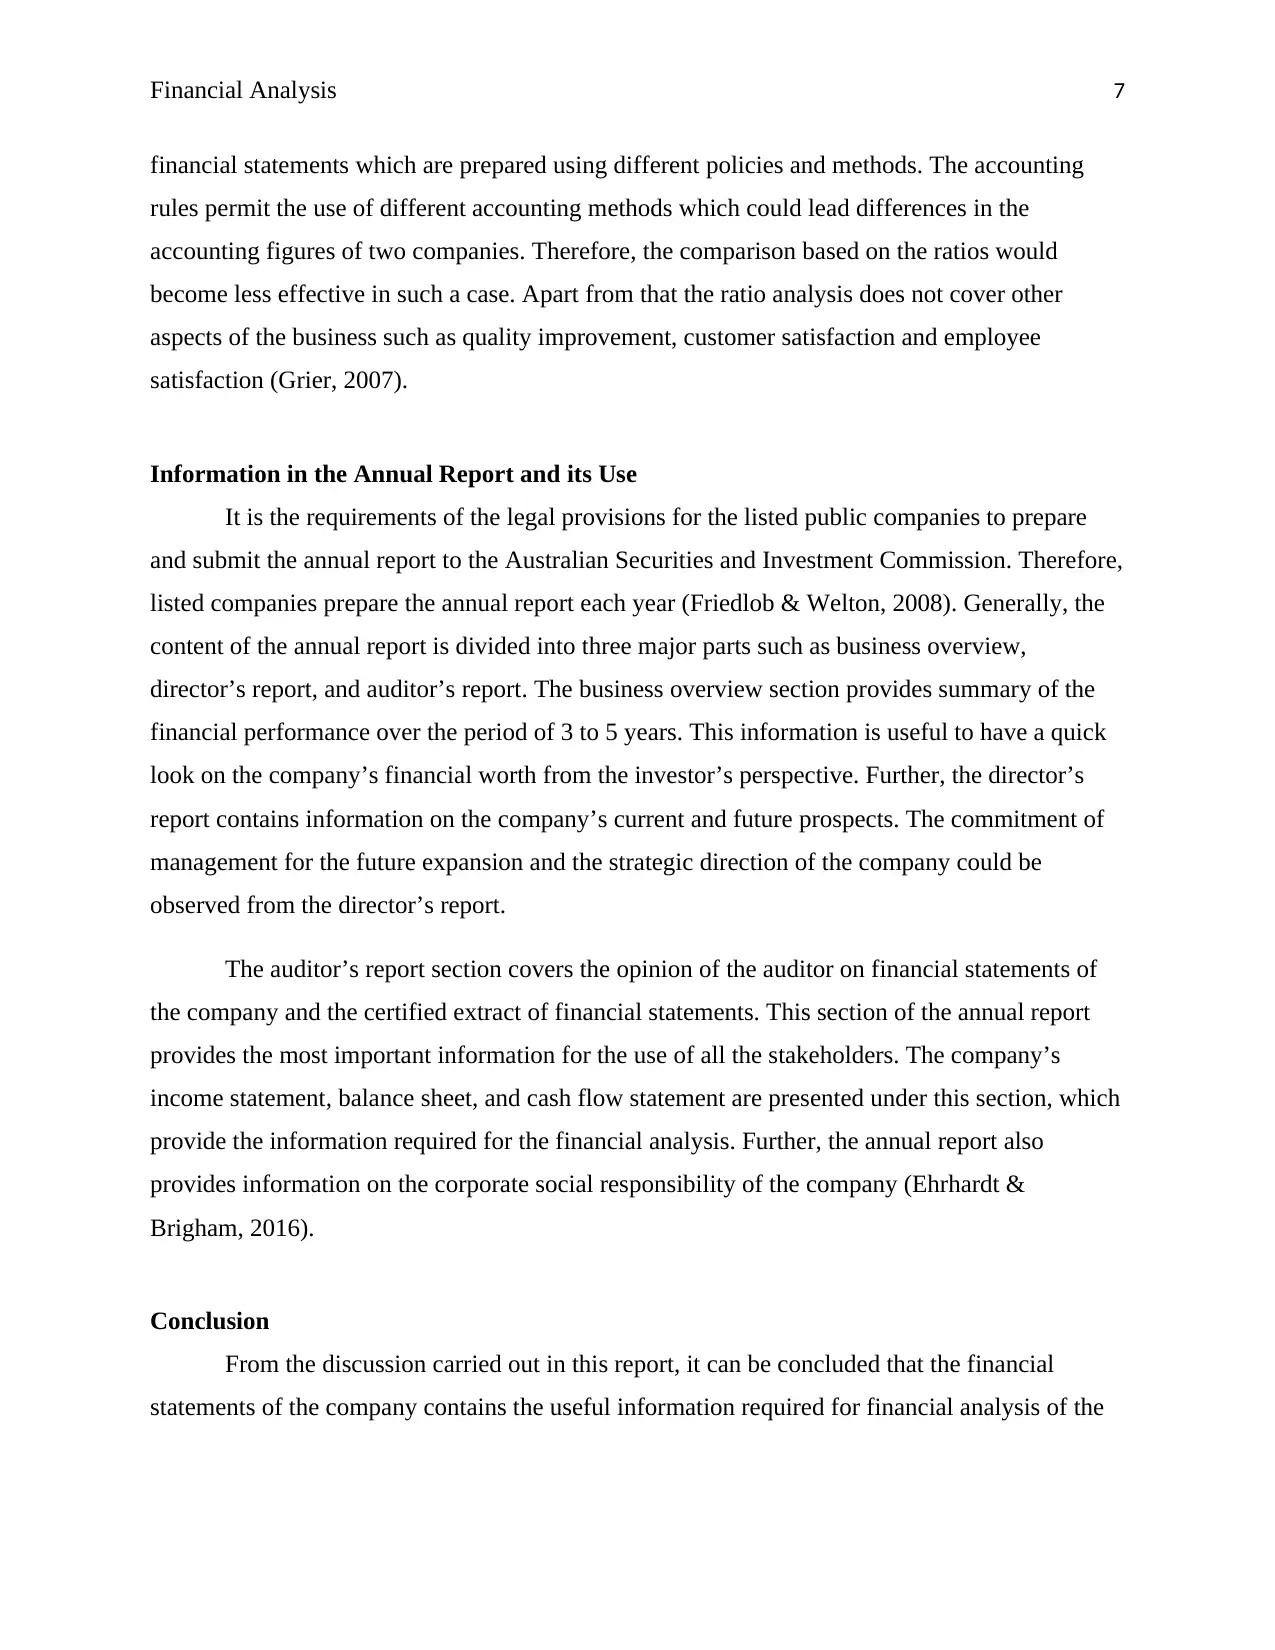
Information in the Annual Report and its Use
It is the requirements of the legal provisions for the listed public companies to prepare
and submit the annual report to the Australian Securities and Investment Commission. Therefore,
listed companies prepare the annual report each year (Friedlob & Welton, 2008). Generally, the
content of the annual report is divided into three major parts such as business overview,
director’s report, and auditor’s report. The business overview section provides summary of the
financial performance over the period of 3 to 5 years. This information is useful to have a quick
look on the company’s financial worth from the investor’s perspective. Further, the director’s
report contains information on the company’s current and future prospects. The commitment of
management for the future expansion and the strategic direction of the company could be
observed from the director’s report.
The auditor’s report section covers the opinion of the auditor on financial statements of
the company and the certified extract of financial statements. This section of the annual report
provides the most important information for the use of all the stakeholders. The company’s
income statement, balance sheet, and cash flow statement are presented under this section, which
provide the information required for the financial analysis. Further, the annual report also
provides information on the corporate social responsibility of the company (Ehrhardt &
Brigham, 2016).
Conclusion
From the discussion carried out in this report, it can be concluded that the financial
statements of the company contains the useful information required for financial analysis of the
financial statements which are prepared using different policies and methods. The accounting
rules permit the use of different accounting methods which could lead differences in the
accounting figures of two companies. Therefore, the comparison based on the ratios would
become less effective in such a case. Apart from that the ratio analysis does not cover other
aspects of the business such as quality improvement, customer satisfaction and employee
satisfaction (Grier, 2007).
Information in the Annual Report and its Use
It is the requirements of the legal provisions for the listed public companies to prepare
and submit the annual report to the Australian Securities and Investment Commission. Therefore,
listed companies prepare the annual report each year (Friedlob & Welton, 2008). Generally, the
content of the annual report is divided into three major parts such as business overview,
director’s report, and auditor’s report. The business overview section provides summary of the
financial performance over the period of 3 to 5 years. This information is useful to have a quick
look on the company’s financial worth from the investor’s perspective. Further, the director’s
report contains information on the company’s current and future prospects. The commitment of
management for the future expansion and the strategic direction of the company could be
observed from the director’s report.
The auditor’s report section covers the opinion of the auditor on financial statements of
the company and the certified extract of financial statements. This section of the annual report
provides the most important information for the use of all the stakeholders. The company’s
income statement, balance sheet, and cash flow statement are presented under this section, which
provide the information required for the financial analysis. Further, the annual report also
provides information on the corporate social responsibility of the company (Ehrhardt &
Brigham, 2016).
Conclusion
From the discussion carried out in this report, it can be concluded that the financial
statements of the company contains the useful information required for financial analysis of the
Paraphrase This Document
Need a fresh take? Get an instant paraphrase of this document with our AI Paraphraser

Financial Analysis 8
business. Further, the financial evaluation tools such as ratio analysis, horizontal analysis, and
vertical analysis are applied to evaluate the financial performance of the company.
business. Further, the financial evaluation tools such as ratio analysis, horizontal analysis, and
vertical analysis are applied to evaluate the financial performance of the company.
Financial Analysis 9
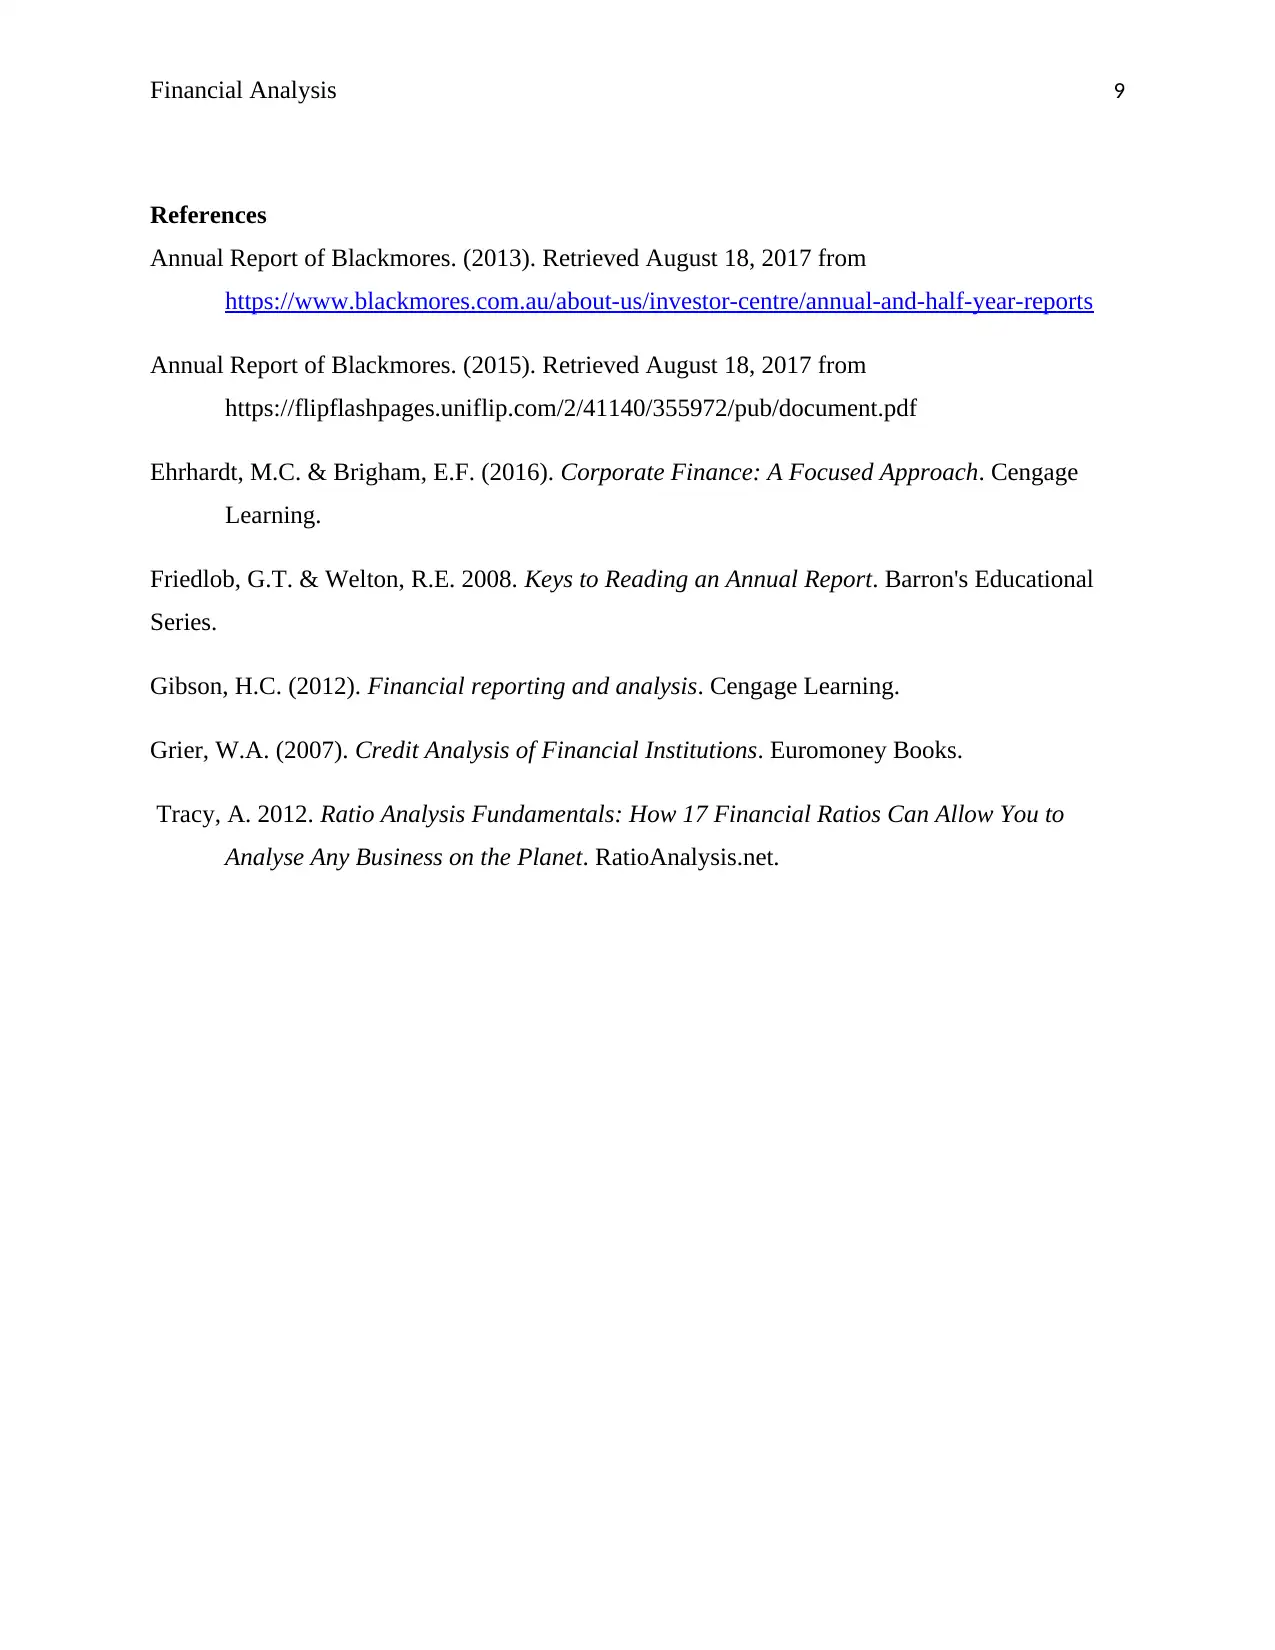
References
Annual Report of Blackmores. (2013). Retrieved August 18, 2017 from
https://www.blackmores.com.au/about-us/investor-centre/annual-and-half-year-reports
Annual Report of Blackmores. (2015). Retrieved August 18, 2017 from
https://flipflashpages.uniflip.com/2/41140/355972/pub/document.pdf
Ehrhardt, M.C. & Brigham, E.F. (2016). Corporate Finance: A Focused Approach. Cengage
Learning.
Friedlob, G.T. & Welton, R.E. 2008. Keys to Reading an Annual Report. Barron's Educational
Series.
Gibson, H.C. (2012). Financial reporting and analysis. Cengage Learning.
Grier, W.A. (2007). Credit Analysis of Financial Institutions. Euromoney Books.
Tracy, A. 2012. Ratio Analysis Fundamentals: How 17 Financial Ratios Can Allow You to
Analyse Any Business on the Planet. RatioAnalysis.net.
⊘ This is a preview!⊘
Do you want full access?
Subscribe today to unlock all pages.
Trusted by 1+ million students worldwide
Financial Analysis 10
Appendix-1:
Horizontal analysis of Blackmores
Description 2013 2014 2015
%
Changes
Revenues
327,000.0
0
347,000.0
0
472,000.0
0 44.34%
Cost of revenues
109,000.0
0
115,000.0
0
151,000.0
0 38.53%
Gross Profit
218,000.0
0
232,000.0
0
321,000.0
0 47.25%
Net profit 25,000.00 25,000.00 47,000.00 88.00%
Current assets
124,000.0
0
131,000.0
0
188,000.0
0 51.61%
Total assets
231,000.0
0
237,000.0
0
293,000.0
0 26.84%
Current liabilities 45,000.00 58,000.00
115,000.0
0 155.56%
Total liabilities
133,000.0
0
132,000.0
0
160,000.0
0 20.30%
Long term debt 87,000.00 73,000.00 44,000.00 -49.43%
Equity 98,000.00
104,000.0
0
133,000.0
0 35.71%
Appendix-2:
Ratio Computation of Blackmores
Description 2013 2014 2015
Profitability
Net profit margin 7.65% 7.20% 9.96%
Gross profit margin 66.67% 66.57% 68.01%
Return on equity 25.51% 24.04% 35.34%
Liquidity
Current ratio 2.76 2.26 1.63
Debt equity ratio 1.36 1.27 1.20
Efficiency
Inventory turnover 8.18 8.90 12.10
Accounts receivables days 71 75 83
Paraphrase This Document
Need a fresh take? Get an instant paraphrase of this document with our AI Paraphraser
Financial Analysis 11
Assets turnover ratio 1.42 1.46 1.61
Market performance
Price earnings ratio
(Average stock price/ EPS ) 16.77 14.96 14.29
Dividend payout ratio 85.90% 85.10% 75%
Assets turnover ratio 1.42 1.46 1.61
Market performance
Price earnings ratio
(Average stock price/ EPS ) 16.77 14.96 14.29
Dividend payout ratio 85.90% 85.10% 75%
1 out of 11
Related Documents


Your All-in-One AI-Powered Toolkit for Academic Success.
+13062052269
info@desklib.com
Available 24*7 on WhatsApp / Email
![[object Object]](/_next/static/media/star-bottom.7253800d.svg)
Unlock your academic potential
Copyright © 2020–2026 A2Z Services. All Rights Reserved. Developed and managed by ZUCOL.