Comprehensive Financial Analysis of Harvey Norman's 2016 Annual Report
VerifiedAdded on 2020/02/24
|10
|2471
|39
Report
AI Summary
This report provides a financial analysis of Harvey Norman Holdings Limited, focusing on its 2016 annual report. It begins with an overview of the company and its business operations, followed by an examination of key sections of the annual report, including the directors' report and the auditors' report. The analysis delves into the company's financial performance, including sales analysis, cash flow from operating activities, and retained profits. A significant portion of the report is dedicated to the calculation and interpretation of various financial ratios, such as profitability, liquidity, asset turnover, and leverage ratios. The report assesses Harvey Norman's financial health based on these ratios, offering insights into its strengths and weaknesses. The analysis covers the period ending June 30, 2016, comparing the company's performance to the previous year, and provides context for the company's financial standing.
Running head: FINANCIAL ACCOUNTING
Financial accounting
Name of the student
Name of the university
Author note
Financial accounting
Name of the student
Name of the university
Author note
Paraphrase This Document
Need a fresh take? Get an instant paraphrase of this document with our AI Paraphraser
1FINANCIAL ACCOUNTING
Table of Contents
1. Introduction of Harvey Norman.........................................................................................2
2. Dominant art of the annual report.......................................................................................3
3. Details of directors and their report....................................................................................3
4. Details of auditor’s and their report....................................................................................5
5. Sales analysis......................................................................................................................5
6. Cash inflow from operating activities.................................................................................6
7. Retained profit....................................................................................................................6
8. Calculation of ratios............................................................................................................7
Reference..................................................................................................................................10
2FINANCIAL ACCOUNTING
1. Introduction of Harvey Norman
Ian Norman and Gerry Harvey opened the 1st store during 1961 and that store was
specialised in the electrical appliances and goods. The success of the store influenced them to
expand their business. As they were struggling to establish their brand name, they started
doing the business with the name of Norman and the name of the manager, Peter Ross which
then named as the retail chain of Norman Ross. Eventually they became one of the biggest
retail chains for larges appliances and by the year 1979 they were in control of 42 stores with
the sales revenue amounted to more than A$ 240 million. However, during 1992, Norman
Ross liquidated and Norman and Harvey together bought new shopping centre in the outer
Sydney for an amount of A$ 3 million and they started operating their 1st store under the
name of Harvey Norman (Harveynormanholdings.com.au 2016).
A large Australian based multi-national retailer, Harvey Norman primarily deals in
consumer electrical, computer, furniture and communication related goods. Various stores of
Harvey Norman are owned and operated by the parent company Harvey Norman Holdings
Limited that is listed under the Australian Stock Exchange. Their operating strategies differ
from the competitors as each distinct stores of the company are managed by distinct
management. The main purpose of the entity is to become the global leader and getting
recognition with regard to the delivery of various retail services in fast growing consumer
goods sector and create shareholders value through improving the working environment and
inviting the local communities to participate in the business (Harveynormanholdings.com.au
2016).
Harvey Norman deals in various products like wardrobe, kitchen, bathroom, bars,
home office and renovations of home theatre, laundry and vacuum appliances, cooling and
heating air treatment, gaming products, photo centre, printers, camera, body and hair care,
⊘ This is a preview!⊘
Do you want full access?
Subscribe today to unlock all pages.
Trusted by 1+ million students worldwide
3FINANCIAL ACCOUNTING
carpet and flooring products, tablets and computers. Further, they provide various services
like installation facilities, delivery services, finance options, TV recycling and product care.
This report will represent the details regarding the auditors of the company and their
report, the directors of the company and their report. The report will further, look into the
financial performance of the company and their analysis. For reporting regarding the above
mentioned matters the annual report for the year 2016 will be taken into consideration
(Harveynormanholdings.com.au 2016).
2. Dominant art of the annual report
The dominant section of the annual report is the financial performance report and the
notes related to the financial reports. The financial report of the company includes various
reports like statement related to the financial position of the company as on 30th June 2016,
income statement for the closing of the year, comprehensive income statement for the closing
of the year, statement of equity changes and cash flow statement for the closing of the year
(Harveynormanholdings.com.au 2016).
3. Details of directors and their report
Unless otherwise stated, all the directors are collectively called as the board and they
hold their positions as director over the entire financial period and till the date of publishing
the report. The major directors of the company are as follows –
Christopher Herbert Brown, Non-executive Director – Mr. Brown appointed as the
director of the company during 1987 while the company listed as the public company.
Further, Mr. Brown is the member of nomination, remuneration and audit committee.
David Matthew Ackery, Executive Director – He was appointed as the director of the
company on 20th December 2005. Further, Mr. Ackery is also responsible for the
Paraphrase This Document
Need a fresh take? Get an instant paraphrase of this document with our AI Paraphraser
4FINANCIAL ACCOUNTING
entire executive responsibility with regard to the relationship among Harvey Norman
and the consolidated organization, technology franchisees, home entertainment and
strategic partners.
Michael John Harvey, Non-executive director – Mr. Harvey joined the company
during 1987. He is extremely experienced with regard to the company’s franchisee
from the year 1989 – 1994. Further, he was appointed as the director of the company
during 1993 and appointed as the managing director of the company during July 1994.
However, he ceased to be the managing director and executive director on 30th June
1998 (Harveynormanholdings.com.au 2016).
Director’s report
As per the director’s states that the financial and operating review to the shareholders
with the overview of the company’s consolidated report, key strategies, dividends and
financial position for the year ended 2016. The report also delivers the summary of the risks
associated with the business and the trading outlook for the financial year 2017. As per the
report, the segment of franchising operations within Australia is the major contributor for the
overall profitability that includes 54% of the net profit before tax. Further, the margin related
to franchising operation enhanced to 5.03% during the financial year 2016 as compared to
4.05% of 2015. During the year 2016, 38 properties from Australia that were valued
independently that represents 31.1% of the total investment properties that is owned by
consolidated company and 39.6% of total fair values of the investment properties from
Australia (Picker et al. 2016). The main objective of the company with regard to its capital
management strategy is creating the sustainable worth for the shareholders, raising capital
through lowest possible sources of costs; prevent the company from unfavourable outcomes
and to maintain the maximum possible level of returns to the stakeholders
(Harveynormanholdings.com.au 2016).
5FINANCIAL ACCOUNTING
4. Details of auditor’s and their report
During the financial year 2016 the audit of Harvey Norman was carried out by Ernst
& Young. As per the director’s report, being the lead auditor of the company no
contraventions were found with regard to the independence requirement of the auditor as per
the Corporation Act 2001 concerning the audit. Moreover, no contraventions were found with
regard to the applicable code for the professional conduct concerning the audit (Schaltegger
and Burritt 2013). The auditors audited the associated financial statements of Harvey Norman
that includes that stated the financial position of the company as on 30th June 2016, income
statement for the closing of the year, comprehensive income statement for the closing of the
year, statement of equity changes and cash flow statement for the closing of the year. As per
the auditor’s opinion, the financial report of the company was prepared as per the
requirement of Corporation Act 2001 that includes –
Represents the true and fair view of the consolidated financial position as on 30th June
2016 and the performance of the company for the financial year ended on the
mentioned date.
Complies with the Corporation Regulations 2001 and AAS (Australian Accounting
standard)
Further, as per the opinion of the auditor, the remuneration report of the company for
the financial year ended 30th June 2016 is in compliance with the section 300A with regard to
the Corporation Act 2001.
⊘ This is a preview!⊘
Do you want full access?
Subscribe today to unlock all pages.
Trusted by 1+ million students worldwide
6FINANCIAL ACCOUNTING
5. Sales analysis
The sales revenue of the company for the year ended 30th June 2016 amounted to $
17,95,759 thousands as compared to $ 16,17,151 thousands for the year ended 30th June 2015.
Therefore, there was an increase of $ 178,608 thousand with regard to sales revenue as
compared to the previous year. Reasons behind the increase in sales were –
Market share with regard to bedding and furniture market continued to increase
despite of the industry slowdown
Small business cycling with regard to tax break and the weaning the computer sales
with regard to the stimulus package.
Deflation in market of flat panel that caused the softening of the sales with regard to
the electrical division.
6. Cash inflow from operating activities
Operating cash flow is the section under the cash flow statement that states the uses
and sources of the cash from the regular business activities of the company for the particular
period. Cash generated from the operating activities generally includes the net income from
income statement, changes in working capital and adjustment to the net income.
The net cash flow from the operating activities for the year ended 30th June 2016 was
$ 437,691 thousand as compared to $ 340,448 thousand for the year ended 30th June 2015.
Therefore, there was an increase of $ 97,243 thousand in 2016 as compared to 2015 and the
increased percentage was 28.56%.
7. Retained profit
Retained profits of the company for the year ended 30th June 2016 was $ 21,25,186
thousands.
Paraphrase This Document
Need a fresh take? Get an instant paraphrase of this document with our AI Paraphraser
7FINANCIAL ACCOUNTING
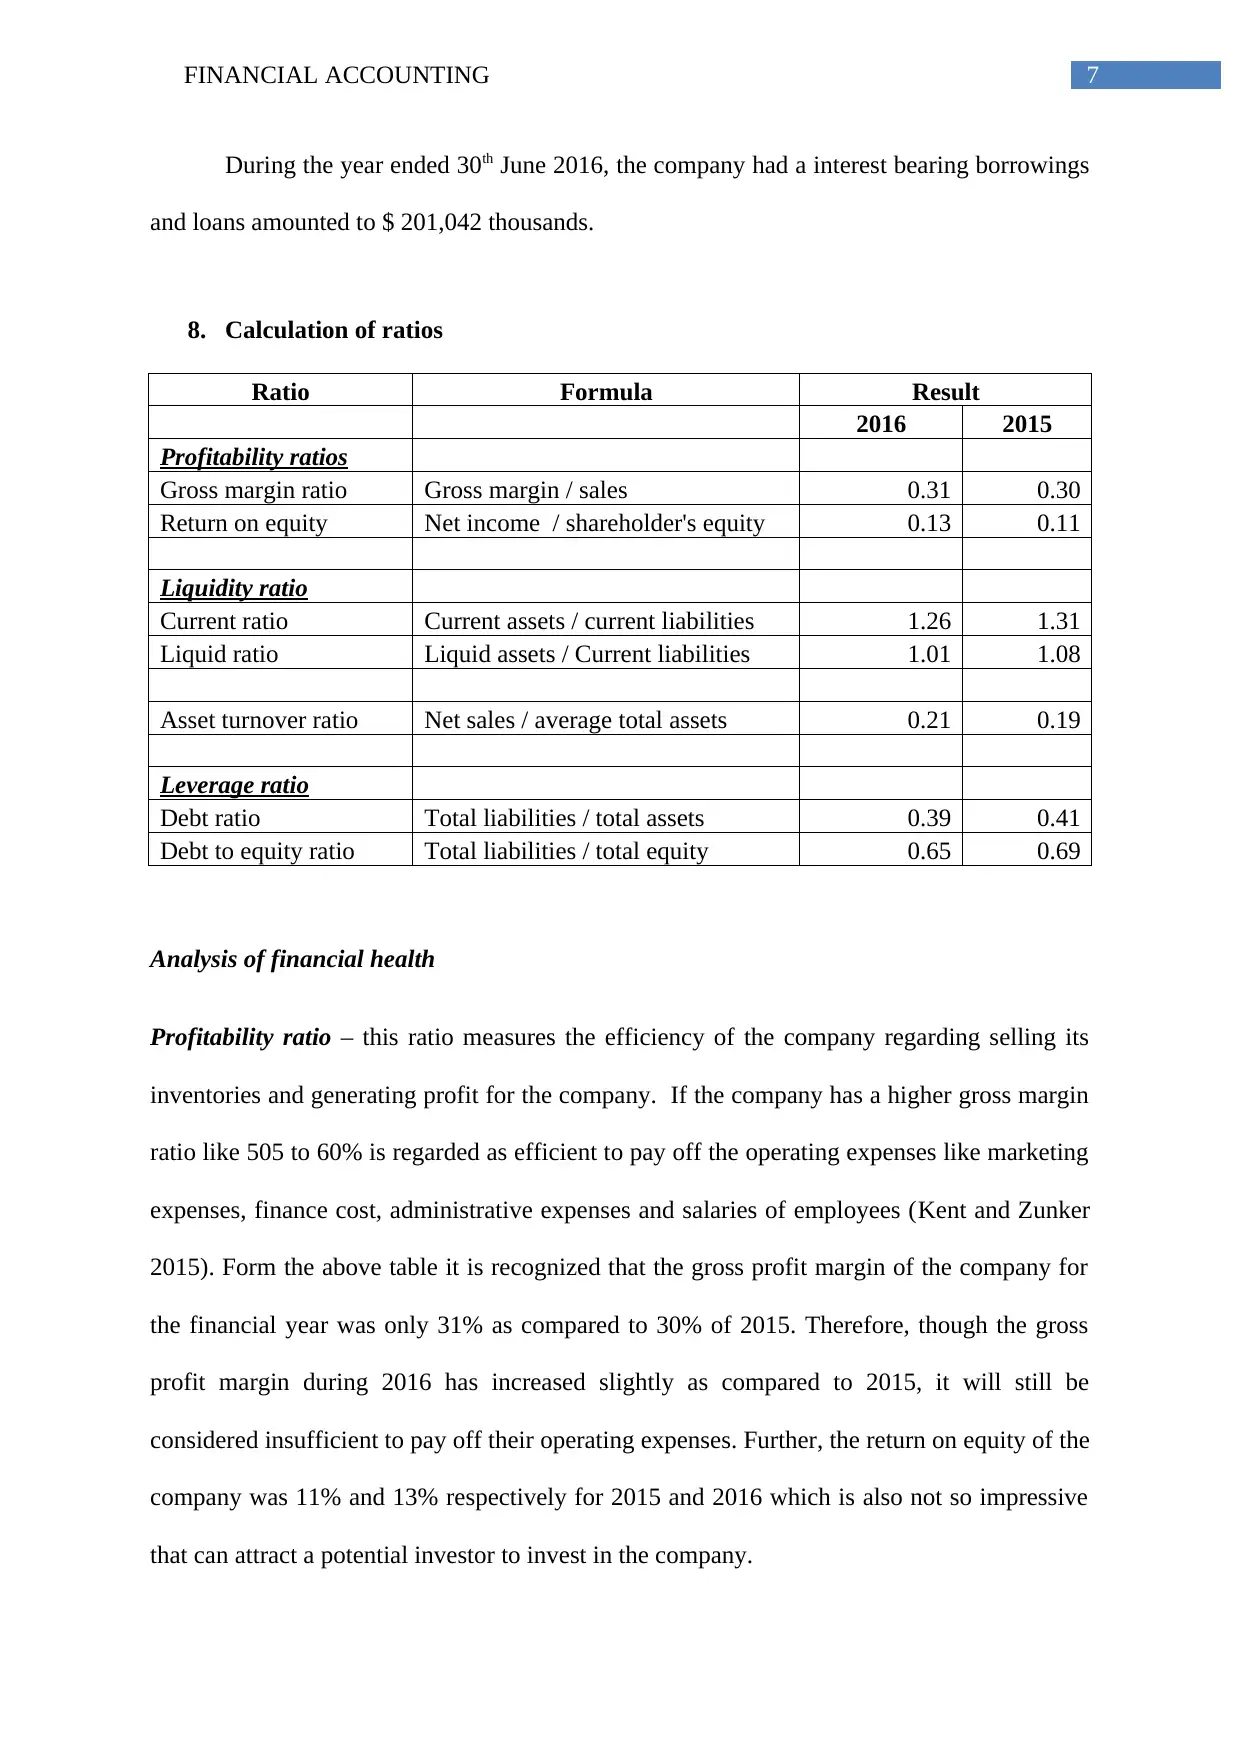
During the year ended 30th June 2016, the company had a interest bearing borrowings
and loans amounted to $ 201,042 thousands.
8. Calculation of ratios
Ratio Formula Result
2016 2015
Profitability ratios
Gross margin ratio Gross margin / sales 0.31 0.30
Return on equity Net income / shareholder's equity 0.13 0.11
Liquidity ratio
Current ratio Current assets / current liabilities 1.26 1.31
Liquid ratio Liquid assets / Current liabilities 1.01 1.08
Asset turnover ratio Net sales / average total assets 0.21 0.19
Leverage ratio
Debt ratio Total liabilities / total assets 0.39 0.41
Debt to equity ratio Total liabilities / total equity 0.65 0.69
Analysis of financial health
Profitability ratio – this ratio measures the efficiency of the company regarding selling its
inventories and generating profit for the company. If the company has a higher gross margin
ratio like 505 to 60% is regarded as efficient to pay off the operating expenses like marketing
expenses, finance cost, administrative expenses and salaries of employees (Kent and Zunker
2015). Form the above table it is recognized that the gross profit margin of the company for
the financial year was only 31% as compared to 30% of 2015. Therefore, though the gross
profit margin during 2016 has increased slightly as compared to 2015, it will still be
considered insufficient to pay off their operating expenses. Further, the return on equity of the
company was 11% and 13% respectively for 2015 and 2016 which is also not so impressive
that can attract a potential investor to invest in the company.
8FINANCIAL ACCOUNTING
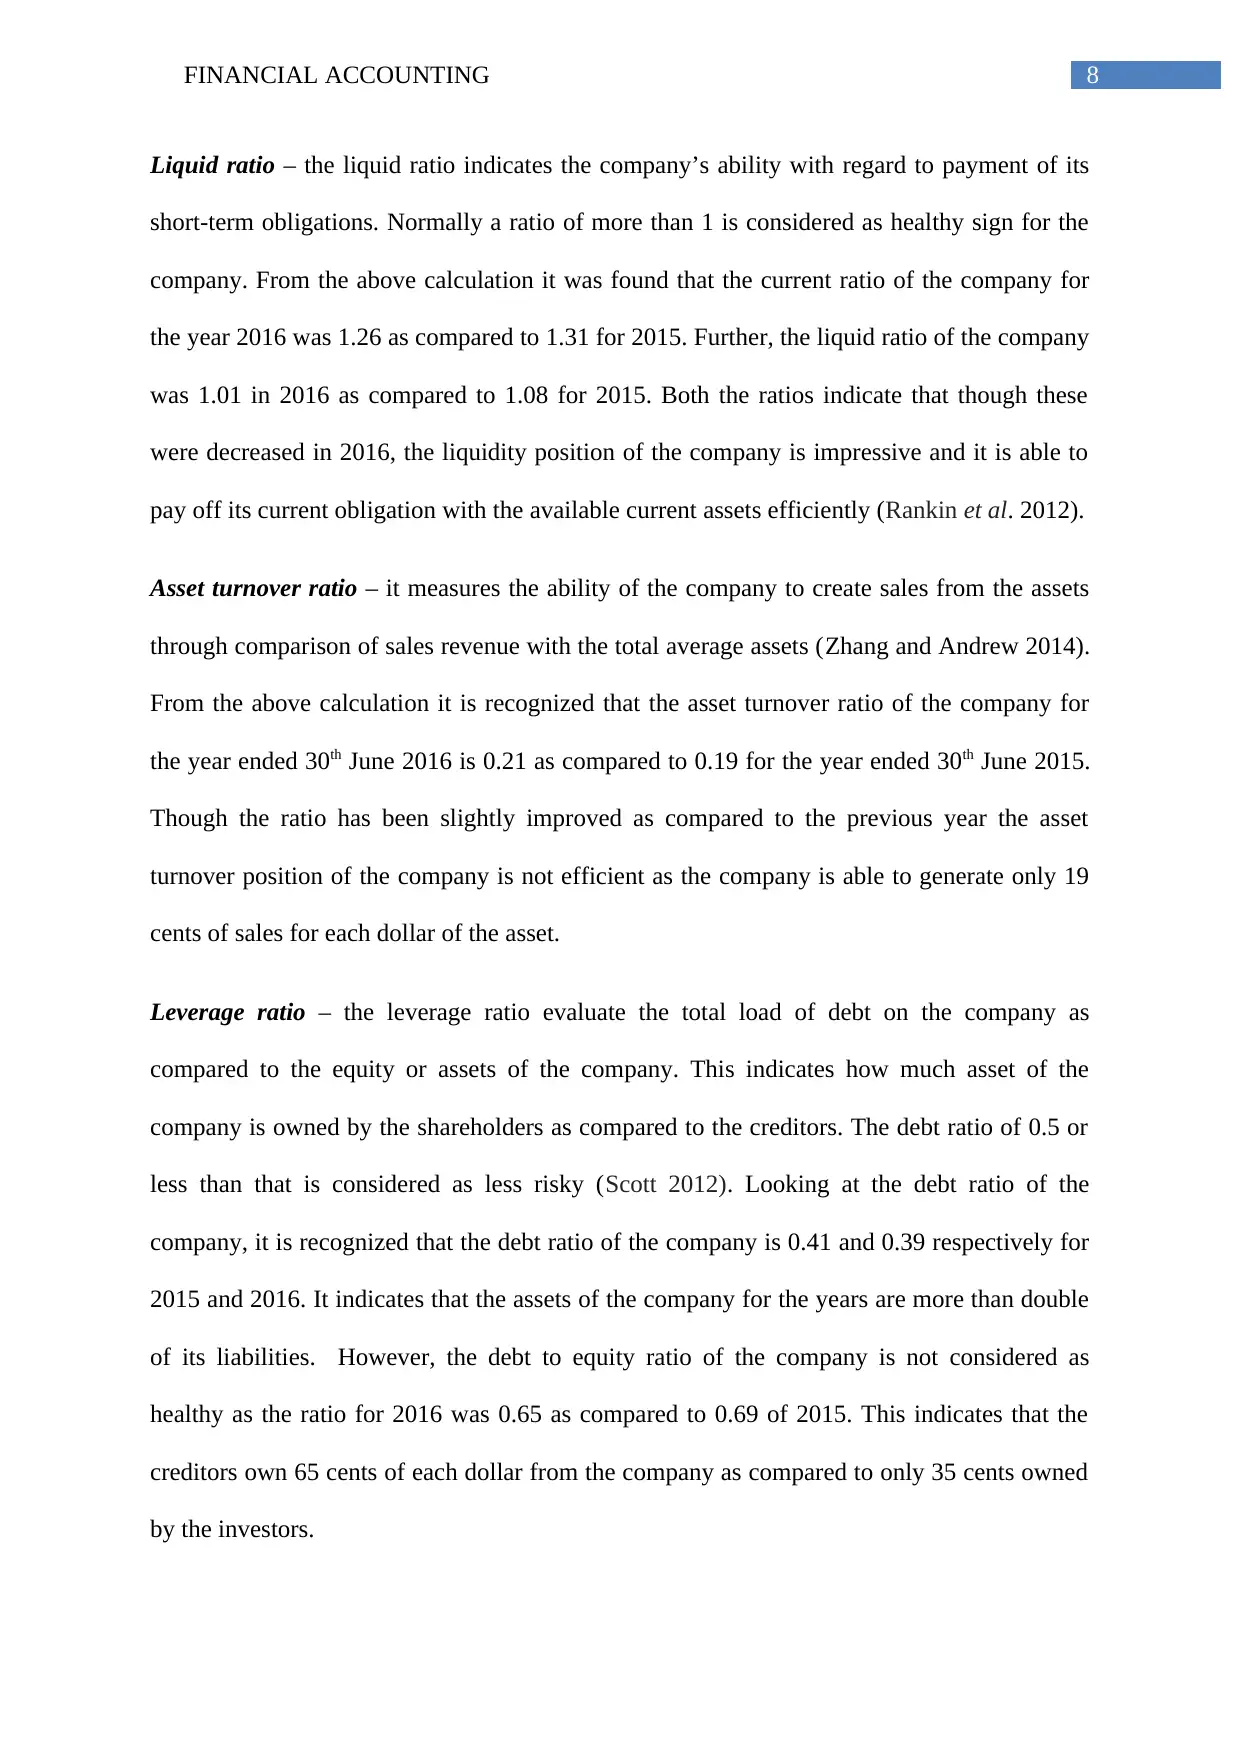
Liquid ratio – the liquid ratio indicates the company’s ability with regard to payment of its
short-term obligations. Normally a ratio of more than 1 is considered as healthy sign for the
company. From the above calculation it was found that the current ratio of the company for
the year 2016 was 1.26 as compared to 1.31 for 2015. Further, the liquid ratio of the company
was 1.01 in 2016 as compared to 1.08 for 2015. Both the ratios indicate that though these
were decreased in 2016, the liquidity position of the company is impressive and it is able to
pay off its current obligation with the available current assets efficiently (Rankin et al. 2012).
Asset turnover ratio – it measures the ability of the company to create sales from the assets
through comparison of sales revenue with the total average assets (Zhang and Andrew 2014).
From the above calculation it is recognized that the asset turnover ratio of the company for
the year ended 30th June 2016 is 0.21 as compared to 0.19 for the year ended 30th June 2015.
Though the ratio has been slightly improved as compared to the previous year the asset
turnover position of the company is not efficient as the company is able to generate only 19
cents of sales for each dollar of the asset.
Leverage ratio – the leverage ratio evaluate the total load of debt on the company as
compared to the equity or assets of the company. This indicates how much asset of the
company is owned by the shareholders as compared to the creditors. The debt ratio of 0.5 or
less than that is considered as less risky (Scott 2012). Looking at the debt ratio of the
company, it is recognized that the debt ratio of the company is 0.41 and 0.39 respectively for
2015 and 2016. It indicates that the assets of the company for the years are more than double
of its liabilities. However, the debt to equity ratio of the company is not considered as
healthy as the ratio for 2016 was 0.65 as compared to 0.69 of 2015. This indicates that the
creditors own 65 cents of each dollar from the company as compared to only 35 cents owned
by the investors.
⊘ This is a preview!⊘
Do you want full access?
Subscribe today to unlock all pages.
Trusted by 1+ million students worldwide
9FINANCIAL ACCOUNTING
Reference
Harveynormanholdings.com.au. 2016. Reports. [online] Available at:
http://www.wesfarmers.com.au/investor-centre/company-performance-news/reports
[Accessed 07 Sept. 2017].
Kent, P. and Zunker, T., 2015. A stakeholder analysis of employee disclosures in annual
reports. Accounting & Finance.
Picker, R., Clark, K., Dunn, J., Kolitz, D., Livne, G., Loftus, J. and Van der Tas, L.,
2016. Applying international financial reporting standards. John Wiley & Sons.
Rankin, M., Stanton, P.A., McGowan, S.C., Ferlauto, K. and Tilling, M., 2012.
Contemporary issues in accounting. John Wiley and Sons Australia, Limited.
Schaltegger, S. and Burritt, R., 2013. Contemporary environmental accounting: issues,
concepts and practice. Greenleaf Publishing.
Scott, W.R., 2012. Financial accounting theory (Vol. 2, No. 1, p. 12). Upper Saddle River,
NJ: Prentice hall.
Zhang, Y. and Andrew, J., 2014. Financialisation and the conceptual framework. Critical
perspectives on accounting, 25(1), pp.17-26.
1 out of 10
Related Documents


Your All-in-One AI-Powered Toolkit for Academic Success.
+13062052269
info@desklib.com
Available 24*7 on WhatsApp / Email
![[object Object]](/_next/static/media/star-bottom.7253800d.svg)
Unlock your academic potential
Copyright © 2020–2026 A2Z Services. All Rights Reserved. Developed and managed by ZUCOL.