Financial Analysis of Huawei Investment and Holding Coy Limited Report
VerifiedAdded on 2023/04/20
|34
|7245
|404
Report
AI Summary
This report offers a comprehensive financial analysis of Huawei Investment and Holding Coy Limited, evaluating its performance over five years. It examines key financial ratios, including gross margin, operating margin, and return on equity, to assess profitability and efficiency. The report further delves into Huawei's growth strategies, highlighting its investments in research and development, long-term partnerships, and product innovation. Activity ratios, such as inventory turnover and receivables turnover, are analyzed to gauge operational efficiency, and the management's approach to minimizing credit risk is evaluated. The report provides a detailed overview of Huawei's financial health and strategic direction within the information and communication technology (ICT) sector, offering insights into its financial management practices and competitive positioning.
Running head: FINANCIAL MANAGEMENT
Financial Management
Name of the Student:
Name of the University:
Author’s Note:
Course ID:
Financial Management
Name of the Student:
Name of the University:
Author’s Note:
Course ID:
Paraphrase This Document
Need a fresh take? Get an instant paraphrase of this document with our AI Paraphraser
1FINANCIAL MANAGEMENT
Executive Summary:
The first section of the paper has provided a brief overview of the financial performance of
Huawei Investment and Holding Coy Limited for the past five years. The organisation is
involved in providing information and communication technology (ICT) solutions for global
enterprises, telecom carriers and consumers. It has been analysed that Huawei has adopted
certain growth strategies by investing in a number of activities that would help in maximising its
overall profit margin in future. In terms of efficiency analysis, it has been analysed that the
organisation has experienced improvement in both inventory turnover and receivables turnover,
owing to which cash conversion cycle has been minimised in 2017. Finally, it has been evaluated
that Huawei employs effective techniques for minimising exposure to credit risk so that it could
control its cash outflows effectively.
2FINANCIAL MANAGEMENT
Table of Contents
Question 1: Huawei Investment and Holding Coy Limited............................................................3
Introduction:................................................................................................................................3
a) Overview of the financial performance of the organisation in the past five years:.................3
b) Evaluation of the management growth strategy:.....................................................................7
c) Evaluation of activity ratios and strategy of the management of assuring minimal exposure
to credit risks:............................................................................................................................10
Conclusion:................................................................................................................................14
Question 2: Nixon Group Plc........................................................................................................15
Requirement a:...........................................................................................................................15
Requirement b:...........................................................................................................................18
Requirement c:...........................................................................................................................20
References:....................................................................................................................................25
Appendices:...................................................................................................................................30
⊘ This is a preview!⊘
Do you want full access?
Subscribe today to unlock all pages.
Trusted by 1+ million students worldwide
3FINANCIAL MANAGEMENT
Question 1: Huawei Investment and Holding Coy Limited
Introduction:
This section would provide a brief overview of the financial performance of Huawei
Investment and Holding Coy Limited for the past five years. The organisation is involved in
providing information and communication technology (ICT) solutions for global enterprises,
telecom carriers and consumers. The organisation has been established in 1987 in China and
currently, it has employee base around 180,000 (Huawei 2019). The section would lay stress on
the growth strategy of the management through investment activities intended to assure the
fulfilment of objectives. Finally, the report would shed light on analysing the activity ratios with
special emphasis on cash conversion cycle of Huawei for the years 2016 and 2017. In addition,
the strategy of the management of assuring minimum exposure to credit risks and the impact on
cash flow would be assessed as well.
a) Overview of the financial performance of the organisation in the past five years:
In order to analyse the financial performance of Huawei for the past five years, certain
ratios have been taken into consideration. These ratios include gross margin, operating margin,
net margin, return on capital employed, return on assets and return on equity. The detailed
explanations of these ratios are provided as follows:
Paraphrase This Document
Need a fresh take? Get an instant paraphrase of this document with our AI Paraphraser
4FINANCIAL MANAGEMENT
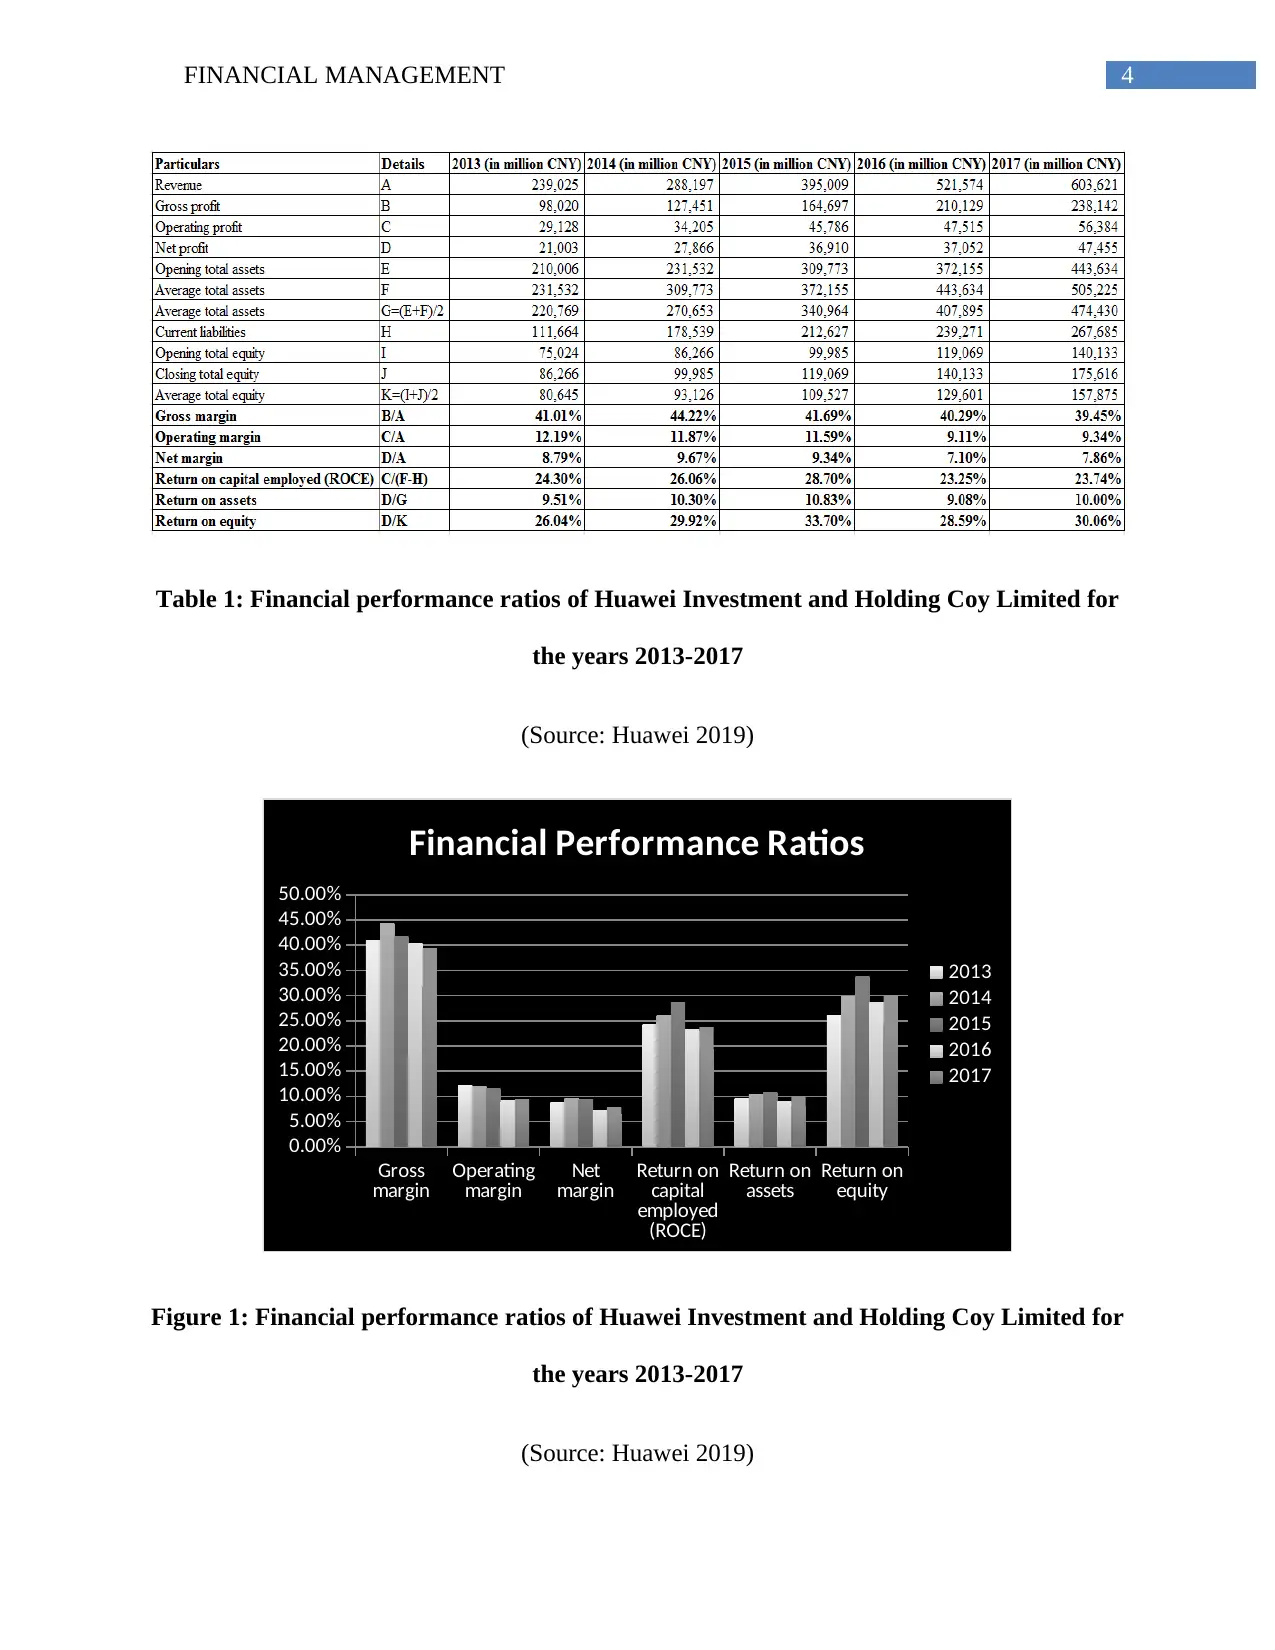
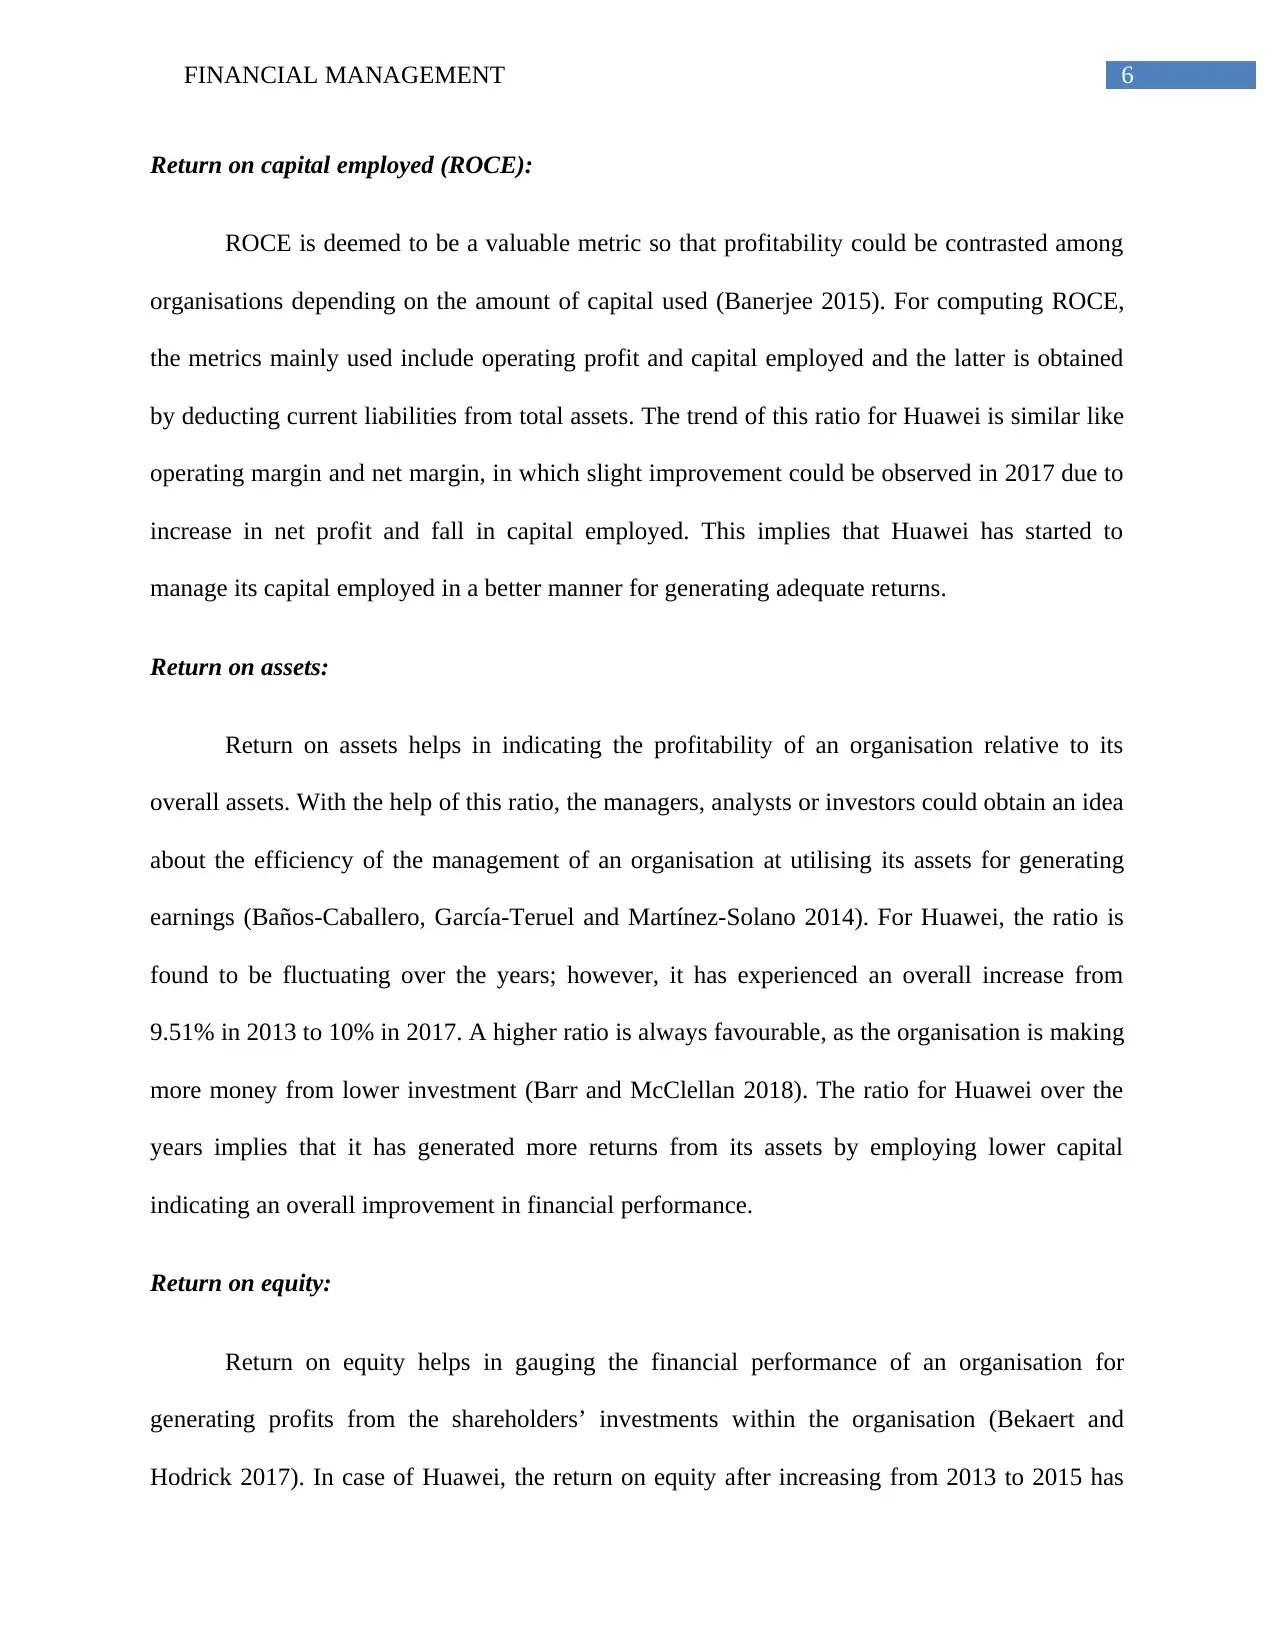
Table 1: Financial performance ratios of Huawei Investment and Holding Coy Limited for
the years 2013-2017
(Source: Huawei 2019)
Gross
margin Operating
margin Net
margin Return on
capital
employed
(ROCE)
Return on
assets Return on
equity
0.00%
5.00%
10.00%
15.00%
20.00%
25.00%
30.00%
35.00%
40.00%
45.00%
50.00%
Financial Performance Ratios
2013
2014
2015
2016
2017
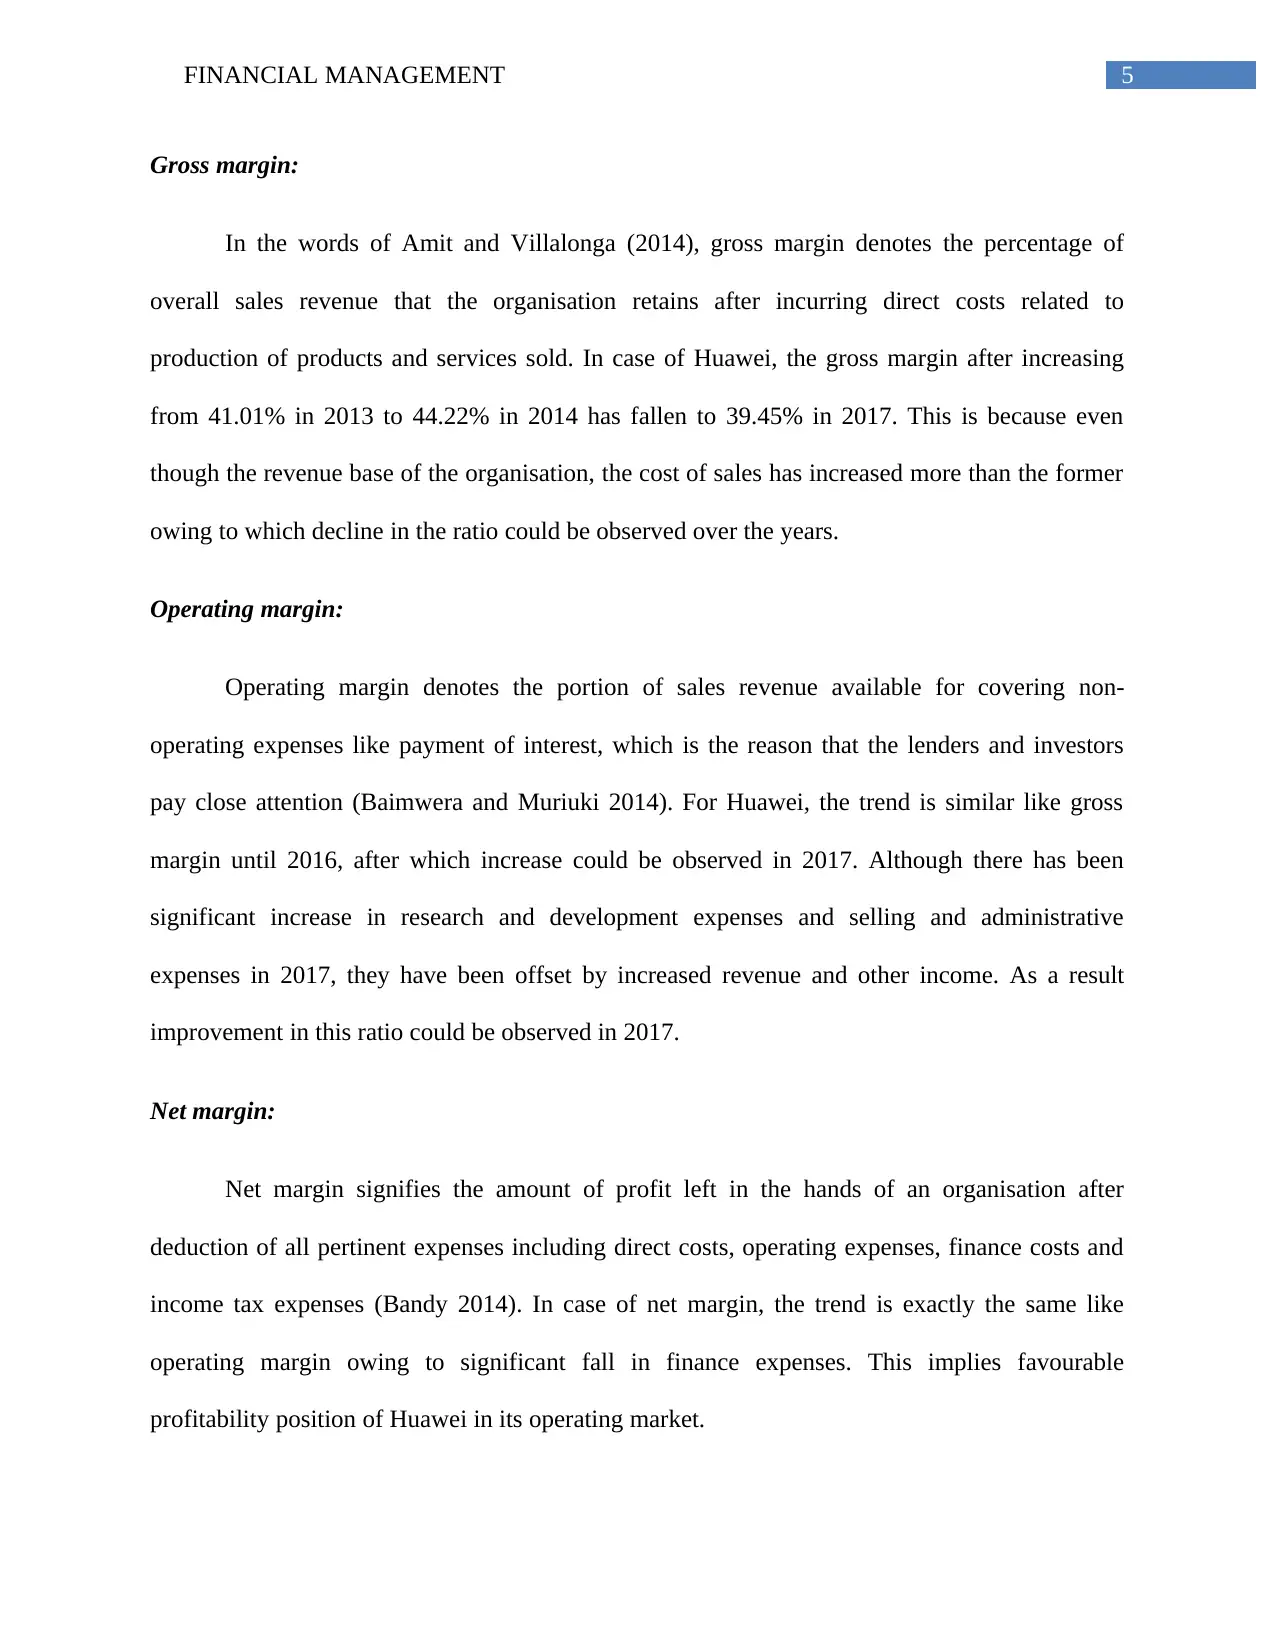
Figure 1: Financial performance ratios of Huawei Investment and Holding Coy Limited for
the years 2013-2017
(Source: Huawei 2019)
Table 1: Financial performance ratios of Huawei Investment and Holding Coy Limited for
the years 2013-2017
(Source: Huawei 2019)
Gross
margin Operating
margin Net
margin Return on
capital
employed
(ROCE)
Return on
assets Return on
equity
0.00%
5.00%
10.00%
15.00%
20.00%
25.00%
30.00%
35.00%
40.00%
45.00%
50.00%
Financial Performance Ratios
2013
2014
2015
2016
2017
Figure 1: Financial performance ratios of Huawei Investment and Holding Coy Limited for
the years 2013-2017
(Source: Huawei 2019)
5FINANCIAL MANAGEMENT
Gross margin:
In the words of Amit and Villalonga (2014), gross margin denotes the percentage of
overall sales revenue that the organisation retains after incurring direct costs related to
production of products and services sold. In case of Huawei, the gross margin after increasing
from 41.01% in 2013 to 44.22% in 2014 has fallen to 39.45% in 2017. This is because even
though the revenue base of the organisation, the cost of sales has increased more than the former
owing to which decline in the ratio could be observed over the years.
Operating margin:
Operating margin denotes the portion of sales revenue available for covering non-
operating expenses like payment of interest, which is the reason that the lenders and investors
pay close attention (Baimwera and Muriuki 2014). For Huawei, the trend is similar like gross
margin until 2016, after which increase could be observed in 2017. Although there has been
significant increase in research and development expenses and selling and administrative
expenses in 2017, they have been offset by increased revenue and other income. As a result
improvement in this ratio could be observed in 2017.
Net margin:
Net margin signifies the amount of profit left in the hands of an organisation after
deduction of all pertinent expenses including direct costs, operating expenses, finance costs and
income tax expenses (Bandy 2014). In case of net margin, the trend is exactly the same like
operating margin owing to significant fall in finance expenses. This implies favourable
profitability position of Huawei in its operating market.
⊘ This is a preview!⊘
Do you want full access?
Subscribe today to unlock all pages.
Trusted by 1+ million students worldwide
6FINANCIAL MANAGEMENT
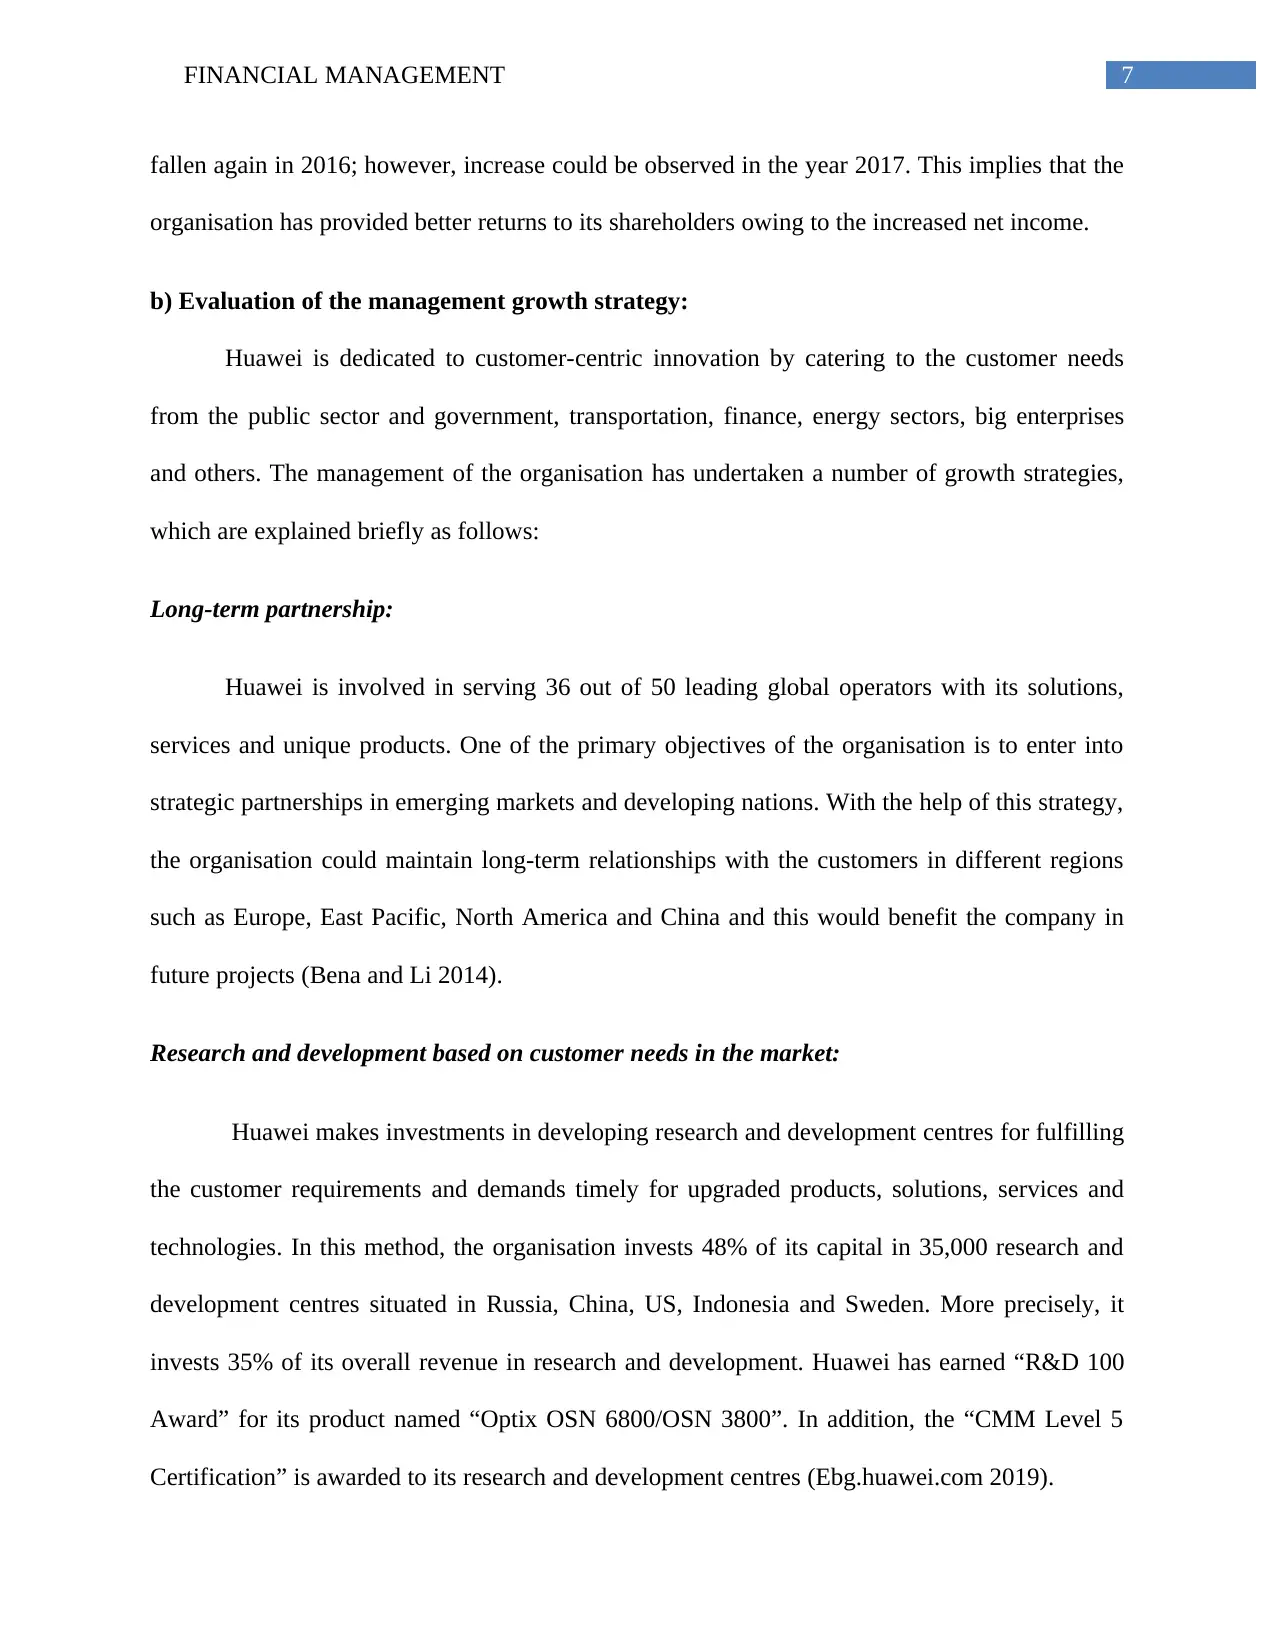
Return on capital employed (ROCE):
ROCE is deemed to be a valuable metric so that profitability could be contrasted among
organisations depending on the amount of capital used (Banerjee 2015). For computing ROCE,
the metrics mainly used include operating profit and capital employed and the latter is obtained
by deducting current liabilities from total assets. The trend of this ratio for Huawei is similar like
operating margin and net margin, in which slight improvement could be observed in 2017 due to
increase in net profit and fall in capital employed. This implies that Huawei has started to
manage its capital employed in a better manner for generating adequate returns.
Return on assets:
Return on assets helps in indicating the profitability of an organisation relative to its
overall assets. With the help of this ratio, the managers, analysts or investors could obtain an idea
about the efficiency of the management of an organisation at utilising its assets for generating
earnings (Baños-Caballero, García-Teruel and Martínez-Solano 2014). For Huawei, the ratio is
found to be fluctuating over the years; however, it has experienced an overall increase from
9.51% in 2013 to 10% in 2017. A higher ratio is always favourable, as the organisation is making
more money from lower investment (Barr and McClellan 2018). The ratio for Huawei over the
years implies that it has generated more returns from its assets by employing lower capital
indicating an overall improvement in financial performance.
Return on equity:
Return on equity helps in gauging the financial performance of an organisation for
generating profits from the shareholders’ investments within the organisation (Bekaert and
Hodrick 2017). In case of Huawei, the return on equity after increasing from 2013 to 2015 has
Paraphrase This Document
Need a fresh take? Get an instant paraphrase of this document with our AI Paraphraser
7FINANCIAL MANAGEMENT
fallen again in 2016; however, increase could be observed in the year 2017. This implies that the
organisation has provided better returns to its shareholders owing to the increased net income.
b) Evaluation of the management growth strategy:
Huawei is dedicated to customer-centric innovation by catering to the customer needs
from the public sector and government, transportation, finance, energy sectors, big enterprises
and others. The management of the organisation has undertaken a number of growth strategies,
which are explained briefly as follows:
Long-term partnership:
Huawei is involved in serving 36 out of 50 leading global operators with its solutions,
services and unique products. One of the primary objectives of the organisation is to enter into
strategic partnerships in emerging markets and developing nations. With the help of this strategy,
the organisation could maintain long-term relationships with the customers in different regions
such as Europe, East Pacific, North America and China and this would benefit the company in
future projects (Bena and Li 2014).
Research and development based on customer needs in the market:
Huawei makes investments in developing research and development centres for fulfilling
the customer requirements and demands timely for upgraded products, solutions, services and
technologies. In this method, the organisation invests 48% of its capital in 35,000 research and
development centres situated in Russia, China, US, Indonesia and Sweden. More precisely, it
invests 35% of its overall revenue in research and development. Huawei has earned “R&D 100
Award” for its product named “Optix OSN 6800/OSN 3800”. In addition, the “CMM Level 5
Certification” is awarded to its research and development centres (Ebg.huawei.com 2019).
8FINANCIAL MANAGEMENT
Edge products and latest solutions:
Huawei products are utilised in network development, which include IP core network,
broadband, terminals, various software and solutions and this has helped in maintaining the top
three ranking in the above categories. This would provide a competitive edge to Huawei over its
competitors. This strategy has assisted in its latest development in long-term evolution (LTE)
along with marketing and launching the first 4G network in Oslo, Norway.
Effective operation for customers (product and supply chain):
This signifies world class programs for its supply and products such as integrated product
development and integrated supply chain. For fulfilling the customer demands and timely
product delivery, it has maintained greater level of supply chain management (Brigham and
Daves 2014).
Technology innovation:
With the help of technology, it becomes possible for the organisation in acquiring global
resources, accomplishing international responsiveness to the customers along with establishing
commercial relationships (Brigham et al. 2016). The rise in digital growth results in the number
of users, which would raise the heavy tariff on the current networks. The diversification of such
networks raises the cost; however, it lacks the growth in revenue, which is a significant concern
in the sector.
With the help of research and development, Huawei has designed some innovative ideas,
which concentrated on value-added services besides the basic calls like advertisement,
convergent billing, personal entertainment, digital home and ICT solutions. At present, it assists
⊘ This is a preview!⊘
Do you want full access?
Subscribe today to unlock all pages.
Trusted by 1+ million students worldwide
9FINANCIAL MANAGEMENT
in supporting its users with such services, initiating new ideas and opportunities, which increase
its revenues gradually. The service-based traffic intelligence of Huawei technology is a kind of
management system, which assists the customers in providing better quality services along with
increasing bandwidth utilisation by 30% and thus, the services offered are valuable and unique;
thereby, raising competitive advantage (De Fiore and Uhlig 2015).
Partnership to accomplish competitive advantage:
Huawei intends to maintain effective relationships with its main players, local customers,
supplies and global customers that are crucial in the recent times. However, managing resources
is an issue faced by the organisations that directly manufacture their products and services
(Bryce 2017). For avoiding the same, with the help of proper management transformation,
Huawei has formed partnerships with organisation for obtaining support in fields like supply
chain, product, quality control, business transformation, finance and human resources. Hence, by
investing in these activities, Huawei maintains competitive advantage over its rivals.
Scope of expansion with unique products:
In the emerging economies, above 1 million users would be included in the existing
networks, which would assist in developing economic and digital conditions (Churet and Eccles
2014). However, owing to the lower average revenue per individual, the operators find it difficult
to ensure business success in these areas. On the contrary, there are issues like rise in cost in
emerging economies owing to primary infrastructure, transmission and power supply
engineering. For dealing with these issues, Huawei has designed an idea of high power coverage,
power control, solar power suppliers and power supply engineering. For instance, in Bangladesh,
Huawei, as the leading network provider, helped the nation in developing the network along with
Paraphrase This Document
Need a fresh take? Get an instant paraphrase of this document with our AI Paraphraser
10FINANCIAL MANAGEMENT
adding value to the services by forming Grameenphone (GP), which is a solar operated product
BTS adding in the form of a solution for power instability (Cornwall, Vang and Hartman 2016).
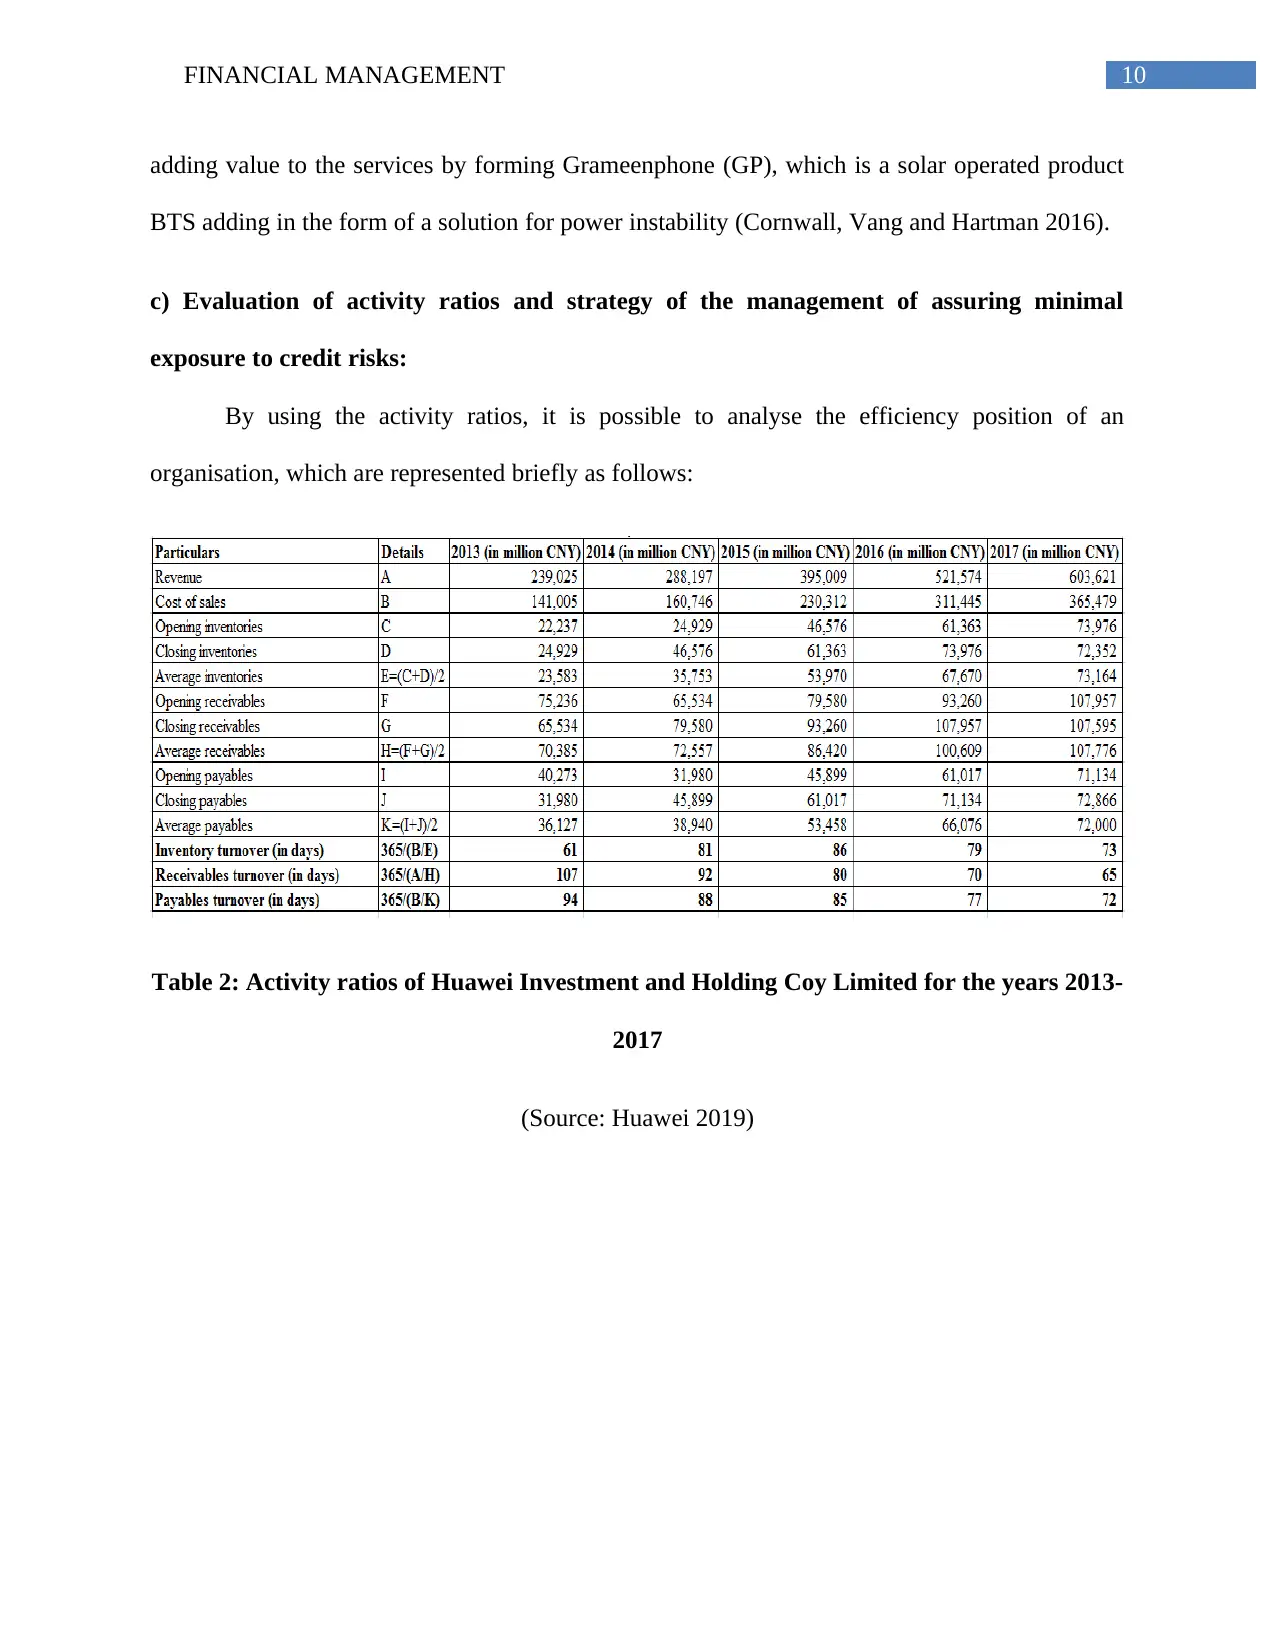
c) Evaluation of activity ratios and strategy of the management of assuring minimal
exposure to credit risks:
By using the activity ratios, it is possible to analyse the efficiency position of an
organisation, which are represented briefly as follows:
Table 2: Activity ratios of Huawei Investment and Holding Coy Limited for the years 2013-
2017
(Source: Huawei 2019)
adding value to the services by forming Grameenphone (GP), which is a solar operated product
BTS adding in the form of a solution for power instability (Cornwall, Vang and Hartman 2016).
c) Evaluation of activity ratios and strategy of the management of assuring minimal
exposure to credit risks:
By using the activity ratios, it is possible to analyse the efficiency position of an
organisation, which are represented briefly as follows:
Table 2: Activity ratios of Huawei Investment and Holding Coy Limited for the years 2013-
2017
(Source: Huawei 2019)
11FINANCIAL MANAGEMENT
2013 2014 2015 2016 2017
-
20
40
60
80
100
120
Activity Ratios
Inventory turnover (in
days)
Receivables turnover (in
days)
Payables turnover (in
days)
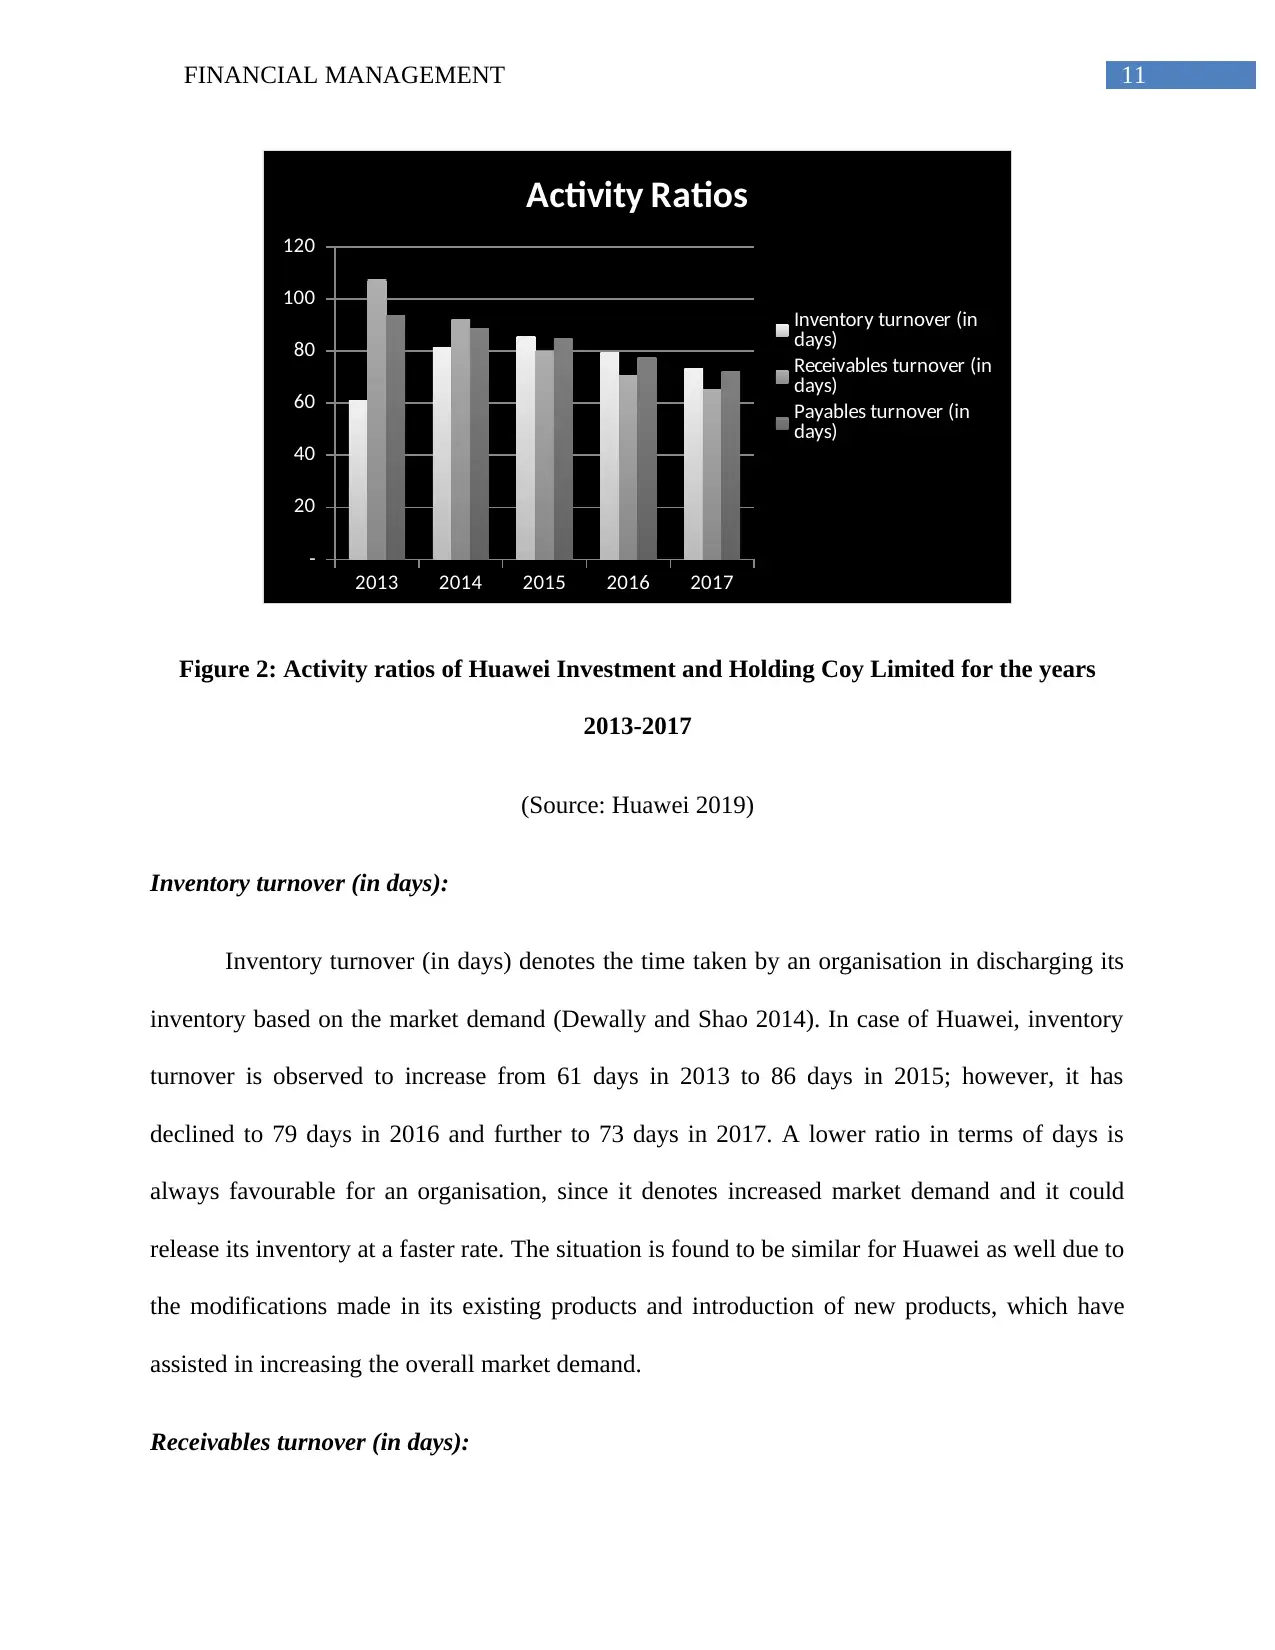
Figure 2: Activity ratios of Huawei Investment and Holding Coy Limited for the years
2013-2017
(Source: Huawei 2019)
Inventory turnover (in days):
Inventory turnover (in days) denotes the time taken by an organisation in discharging its
inventory based on the market demand (Dewally and Shao 2014). In case of Huawei, inventory
turnover is observed to increase from 61 days in 2013 to 86 days in 2015; however, it has
declined to 79 days in 2016 and further to 73 days in 2017. A lower ratio in terms of days is
always favourable for an organisation, since it denotes increased market demand and it could
release its inventory at a faster rate. The situation is found to be similar for Huawei as well due to
the modifications made in its existing products and introduction of new products, which have
assisted in increasing the overall market demand.
Receivables turnover (in days):
2013 2014 2015 2016 2017
-
20
40
60
80
100
120
Activity Ratios
Inventory turnover (in
days)
Receivables turnover (in
days)
Payables turnover (in
days)
Figure 2: Activity ratios of Huawei Investment and Holding Coy Limited for the years
2013-2017
(Source: Huawei 2019)
Inventory turnover (in days):
Inventory turnover (in days) denotes the time taken by an organisation in discharging its
inventory based on the market demand (Dewally and Shao 2014). In case of Huawei, inventory
turnover is observed to increase from 61 days in 2013 to 86 days in 2015; however, it has
declined to 79 days in 2016 and further to 73 days in 2017. A lower ratio in terms of days is
always favourable for an organisation, since it denotes increased market demand and it could
release its inventory at a faster rate. The situation is found to be similar for Huawei as well due to
the modifications made in its existing products and introduction of new products, which have
assisted in increasing the overall market demand.
Receivables turnover (in days):
⊘ This is a preview!⊘
Do you want full access?
Subscribe today to unlock all pages.
Trusted by 1+ million students worldwide
1 out of 34
Related Documents


Your All-in-One AI-Powered Toolkit for Academic Success.
+13062052269
info@desklib.com
Available 24*7 on WhatsApp / Email
![[object Object]](/_next/static/media/star-bottom.7253800d.svg)
Unlock your academic potential
Copyright © 2020–2026 A2Z Services. All Rights Reserved. Developed and managed by ZUCOL.