Kuafu Hotel Financial Analysis Report: Performance and Ratios
VerifiedAdded on 2023/04/22
|13
|2478
|59
Report
AI Summary
This report presents a comprehensive financial analysis of the Kuafu Hotel, a partnership venture, assessing its financial performance over a three-month period. The analysis includes a detailed examination of the income statement, focusing on sales, cost of sales, and various expenses, revealing negative EBITDA and net profit margins. Ratio analysis is conducted, comparing the hotel's performance against industry standards across profitability, financial stability, and asset utilization metrics. The report also undertakes a variance analysis to identify deviations from the budgeted financials and a CVP (Cost-Volume-Profit) analysis to determine the break-even point and assess the financial stability of the venture. The conclusion highlights the need for financial restructuring, including debt rationalization, increased sales, and cost minimization to ensure the hotel's long-term viability and sustainability, emphasizing the challenges of lower demand, high maintenance costs, and inadequate working capital.
Running Head: FINANCIAL ANALYSIS 0
KUAFU HOTEL
Financial Analysis
System04115
KUAFU HOTEL
Financial Analysis
System04115
Paraphrase This Document
Need a fresh take? Get an instant paraphrase of this document with our AI Paraphraser
FINANCIAL ANALYSIS 1
Table of Contents
Introduction................................................................................................................................1
Importance of Financial Analysis..............................................................................................1
Financial Analysis..................................................................................................................1
Ratio Analysis............................................................................................................................3
Assessment of the ratios.........................................................................................................3
Profitability........................................................................................................................3
Financial Stability..............................................................................................................4
Asset utilisation..................................................................................................................4
Variance Analysis......................................................................................................................5
CVP analysis..............................................................................................................................6
Conclusion..................................................................................................................................7
References..................................................................................................................................9
FINANCIAL ANALYSIS 2
Introduction
Kuafu Hotel is a partnership venture. It is necessary to understand the reasonableness
of the revenue, cost assumptions and consequently the margins and sustainability check. The
relevant industry benchmarks are studied and applied using research and industry expertise.
This report projects the financial performance of the Company along with the Debt
sustainability Check. The financial analysis helps the members of the venture to take key
decisions and also understand the area that need working. The report discusses various aspect
of the financial such as ratios, the variance analysis and also the breakeven analysis
(Williams & Dobelman, 2017).
Importance of Financial Analysis
The primary reason for any business venture is to earn the profit, so we can find out
the financial position of business with the help of financial statements (Vogel, 2014). The
analysis of financial helps us to find the viability of the business and help the key decision
maker in making an important decision. (Corporate Finance Institute, 2019). The financial
analysis helps us to find that there is a proper allocation of resources. Different financial
analysis carries their own benefit and helps in determining something different such as
financial statement help un-understanding the financial position of the firm, break-even
analysis assists in determining the breakeven point for the firm (Titman et al., 2011).
Financial Analysis
The financial statements allow analysts to measure liquidity, profitability, company-
wide efficiency, and cash flow. There are three main types of financial statements: the
balance sheet, income statement and cash flow statement (Investopedia, 2019).
⊘ This is a preview!⊘
Do you want full access?
Subscribe today to unlock all pages.
Trusted by 1+ million students worldwide
FINANCIAL ANALYSIS 3
STATEMENT OF COMPREHENSIVE INCOME
Jan-19 Feb-19 Mar-19 Budgeted
Sales 24959
27454.
9
30200.3
9
32446.
7
Cost of Sales 1990 2089.5
2193.97
5 2089.5
Gross Profit 22969
25365.
4
28006.4
2
30357.
2
Selling Expenses
Advertising 500 300 200 300
Disinfection
room 380 391.4 403.142
411.204
8
Hotel
Cooperation
1000
0 10880
1000
0
10691.
4 10000
10603.1
4 10000
10711.
2
Admin.
Expenses
Deprecation 2490 2490 2490 2490
Decoration 6300
0
3700
0 39000 37000
Wages & Staff 3690
0
3726
9
37641.6
9 37269
Others 6020
10698
7 5130 81889 5130
84261.6
9 6200 82959
Financial
Expenses
Bad Debts 135 70 65 65
Interest 723 858 723 793 723 788 723 788
Net Profit -95756 -68008 -67646.4 -64101
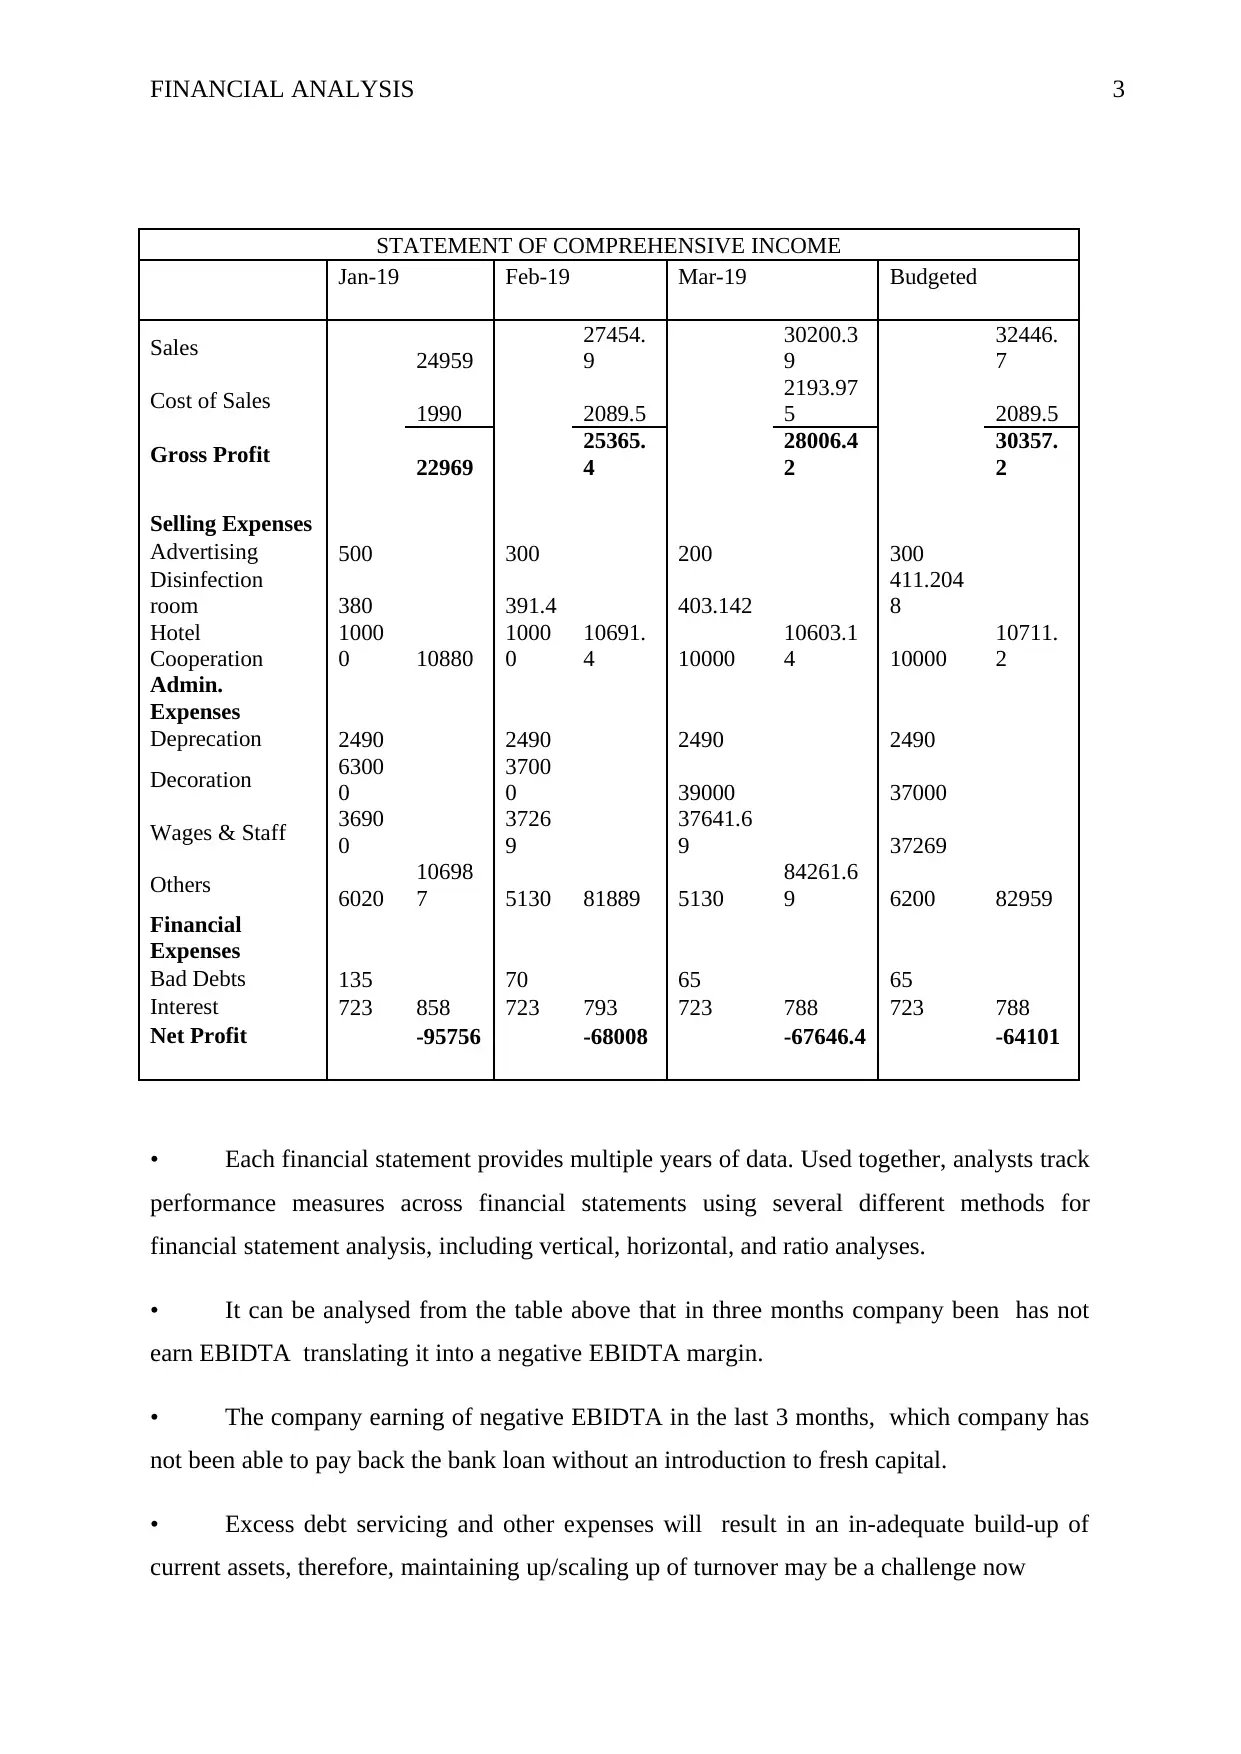
• Each financial statement provides multiple years of data. Used together, analysts track
performance measures across financial statements using several different methods for
financial statement analysis, including vertical, horizontal, and ratio analyses.
• It can be analysed from the table above that in three months company been has not
earn EBIDTA translating it into a negative EBIDTA margin.
• The company earning of negative EBIDTA in the last 3 months, which company has
not been able to pay back the bank loan without an introduction to fresh capital.
• Excess debt servicing and other expenses will result in an in-adequate build-up of
current assets, therefore, maintaining up/scaling up of turnover may be a challenge now
STATEMENT OF COMPREHENSIVE INCOME
Jan-19 Feb-19 Mar-19 Budgeted
Sales 24959
27454.
9
30200.3
9
32446.
7
Cost of Sales 1990 2089.5
2193.97
5 2089.5
Gross Profit 22969
25365.
4
28006.4
2
30357.
2
Selling Expenses
Advertising 500 300 200 300
Disinfection
room 380 391.4 403.142
411.204
8
Hotel
Cooperation
1000
0 10880
1000
0
10691.
4 10000
10603.1
4 10000
10711.
2
Admin.
Expenses
Deprecation 2490 2490 2490 2490
Decoration 6300
0
3700
0 39000 37000
Wages & Staff 3690
0
3726
9
37641.6
9 37269
Others 6020
10698
7 5130 81889 5130
84261.6
9 6200 82959
Financial
Expenses
Bad Debts 135 70 65 65
Interest 723 858 723 793 723 788 723 788
Net Profit -95756 -68008 -67646.4 -64101
• Each financial statement provides multiple years of data. Used together, analysts track
performance measures across financial statements using several different methods for
financial statement analysis, including vertical, horizontal, and ratio analyses.
• It can be analysed from the table above that in three months company been has not
earn EBIDTA translating it into a negative EBIDTA margin.
• The company earning of negative EBIDTA in the last 3 months, which company has
not been able to pay back the bank loan without an introduction to fresh capital.
• Excess debt servicing and other expenses will result in an in-adequate build-up of
current assets, therefore, maintaining up/scaling up of turnover may be a challenge now
Paraphrase This Document
Need a fresh take? Get an instant paraphrase of this document with our AI Paraphraser
FINANCIAL ANALYSIS 4
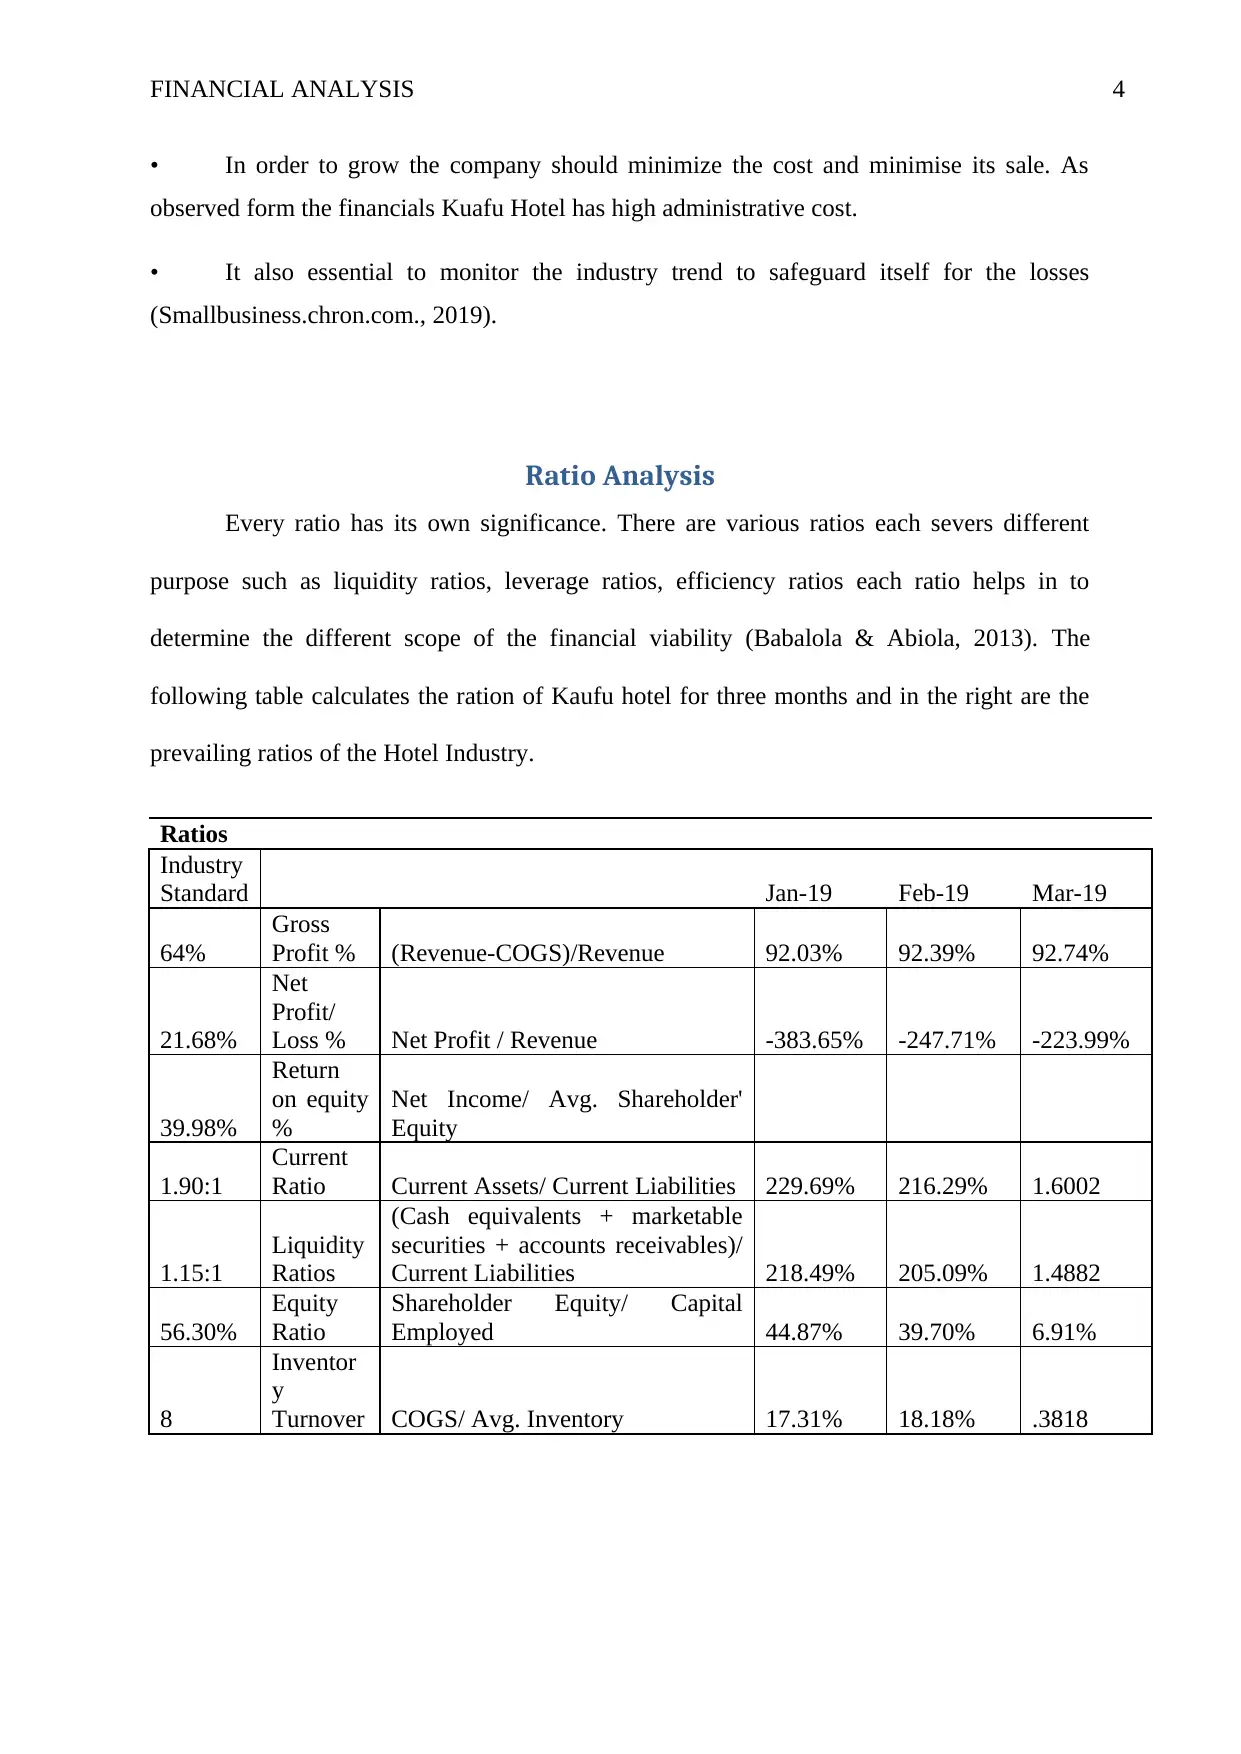
• In order to grow the company should minimize the cost and minimise its sale. As
observed form the financials Kuafu Hotel has high administrative cost.
• It also essential to monitor the industry trend to safeguard itself for the losses
(Smallbusiness.chron.com., 2019).
Ratio Analysis
Every ratio has its own significance. There are various ratios each severs different
purpose such as liquidity ratios, leverage ratios, efficiency ratios each ratio helps in to
determine the different scope of the financial viability (Babalola & Abiola, 2013). The
following table calculates the ration of Kaufu hotel for three months and in the right are the
prevailing ratios of the Hotel Industry.
Ratios
Industry
Standard Jan-19 Feb-19 Mar-19
64%
Gross
Profit % (Revenue-COGS)/Revenue 92.03% 92.39% 92.74%
21.68%
Net
Profit/
Loss % Net Profit / Revenue -383.65% -247.71% -223.99%
39.98%
Return
on equity
%
Net Income/ Avg. Shareholder'
Equity
1.90:1
Current
Ratio Current Assets/ Current Liabilities 229.69% 216.29% 1.6002
1.15:1
Liquidity
Ratios
(Cash equivalents + marketable
securities + accounts receivables)/
Current Liabilities 218.49% 205.09% 1.4882
56.30%
Equity
Ratio
Shareholder Equity/ Capital
Employed 44.87% 39.70% 6.91%
8
Inventor
y
Turnover COGS/ Avg. Inventory 17.31% 18.18% .3818
FINANCIAL ANALYSIS 5
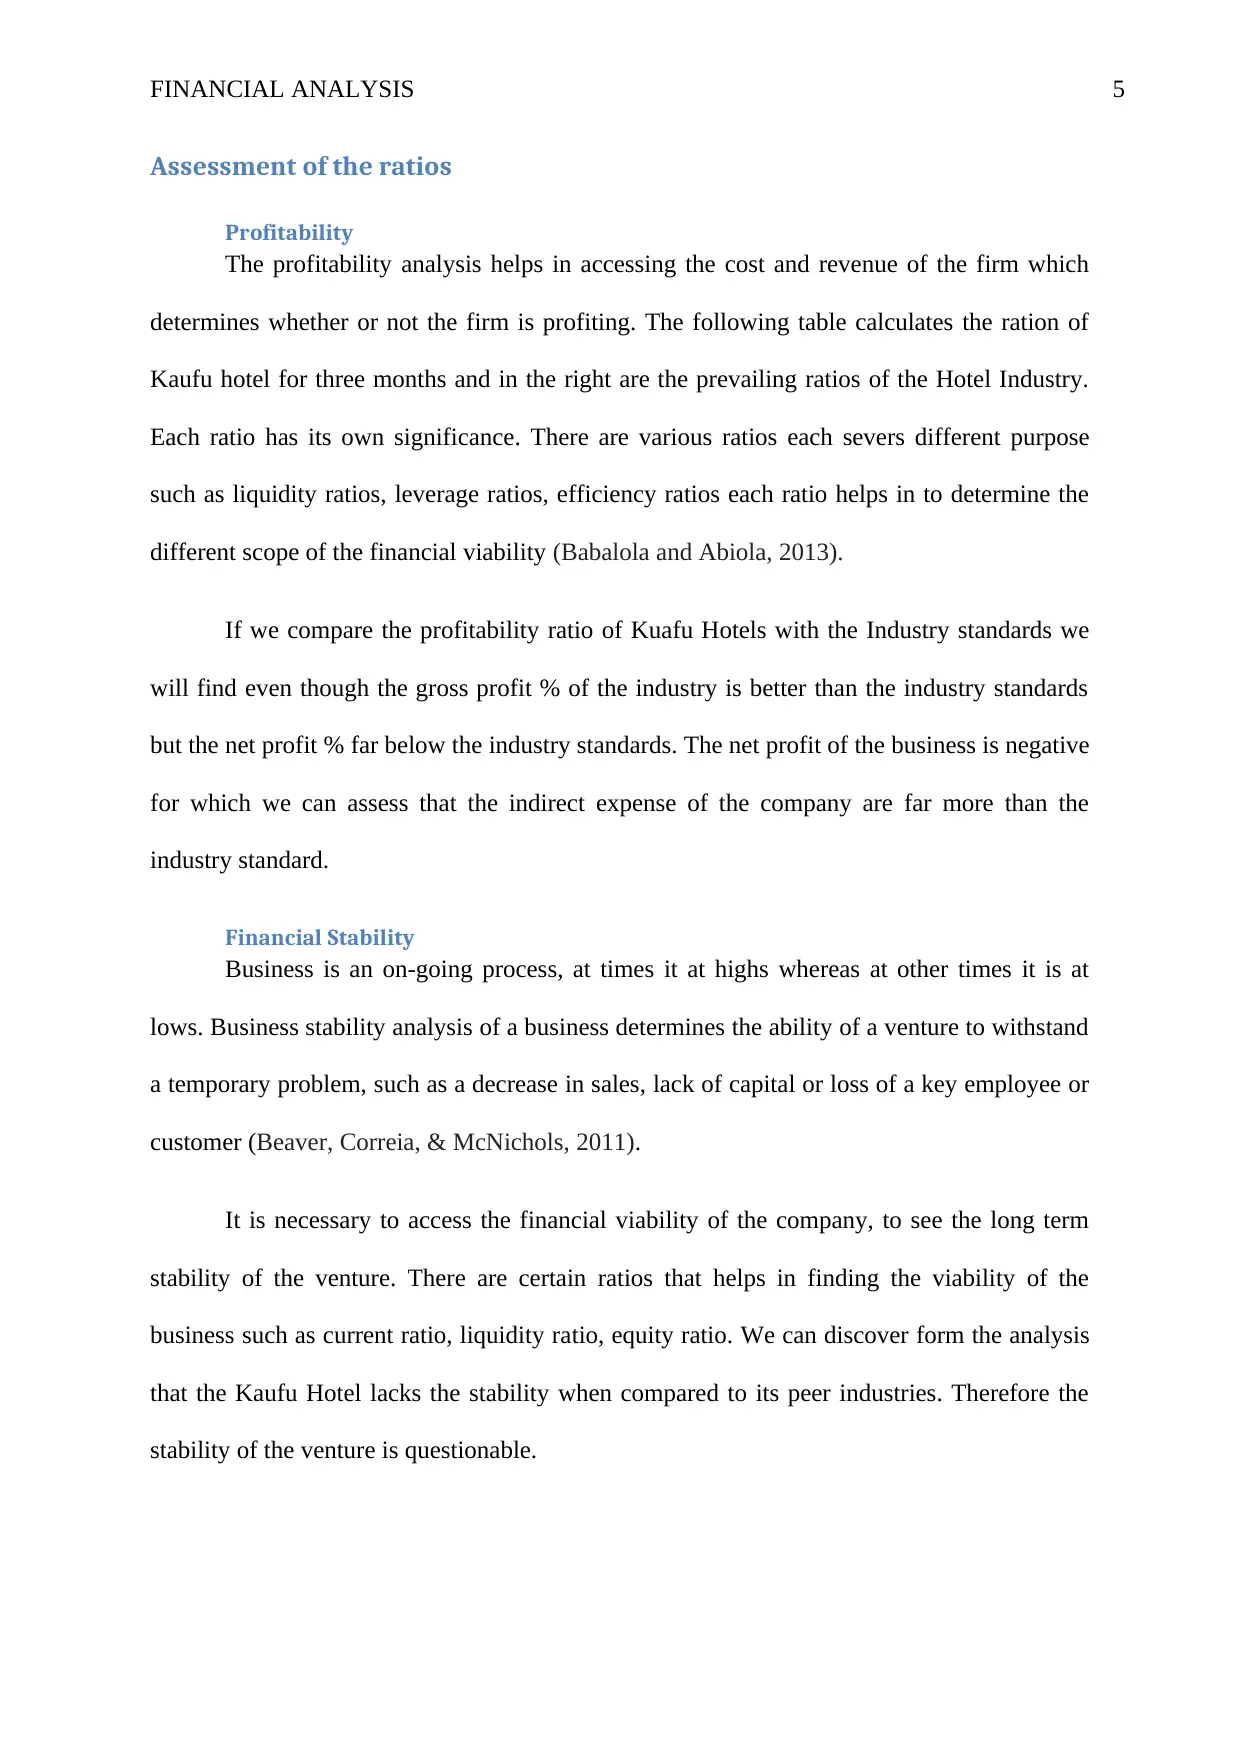
Assessment of the ratios
Profitability
The profitability analysis helps in accessing the cost and revenue of the firm which
determines whether or not the firm is profiting. The following table calculates the ration of
Kaufu hotel for three months and in the right are the prevailing ratios of the Hotel Industry.
Each ratio has its own significance. There are various ratios each severs different purpose
such as liquidity ratios, leverage ratios, efficiency ratios each ratio helps in to determine the
different scope of the financial viability (Babalola and Abiola, 2013).
If we compare the profitability ratio of Kuafu Hotels with the Industry standards we
will find even though the gross profit % of the industry is better than the industry standards
but the net profit % far below the industry standards. The net profit of the business is negative
for which we can assess that the indirect expense of the company are far more than the
industry standard.
Financial Stability
Business is an on-going process, at times it at highs whereas at other times it is at
lows. Business stability analysis of a business determines the ability of a venture to withstand
a temporary problem, such as a decrease in sales, lack of capital or loss of a key employee or
customer (Beaver, Correia, & McNichols, 2011).
It is necessary to access the financial viability of the company, to see the long term
stability of the venture. There are certain ratios that helps in finding the viability of the
business such as current ratio, liquidity ratio, equity ratio. We can discover form the analysis
that the Kaufu Hotel lacks the stability when compared to its peer industries. Therefore the
stability of the venture is questionable.
⊘ This is a preview!⊘
Do you want full access?
Subscribe today to unlock all pages.
Trusted by 1+ million students worldwide
FINANCIAL ANALYSIS 6
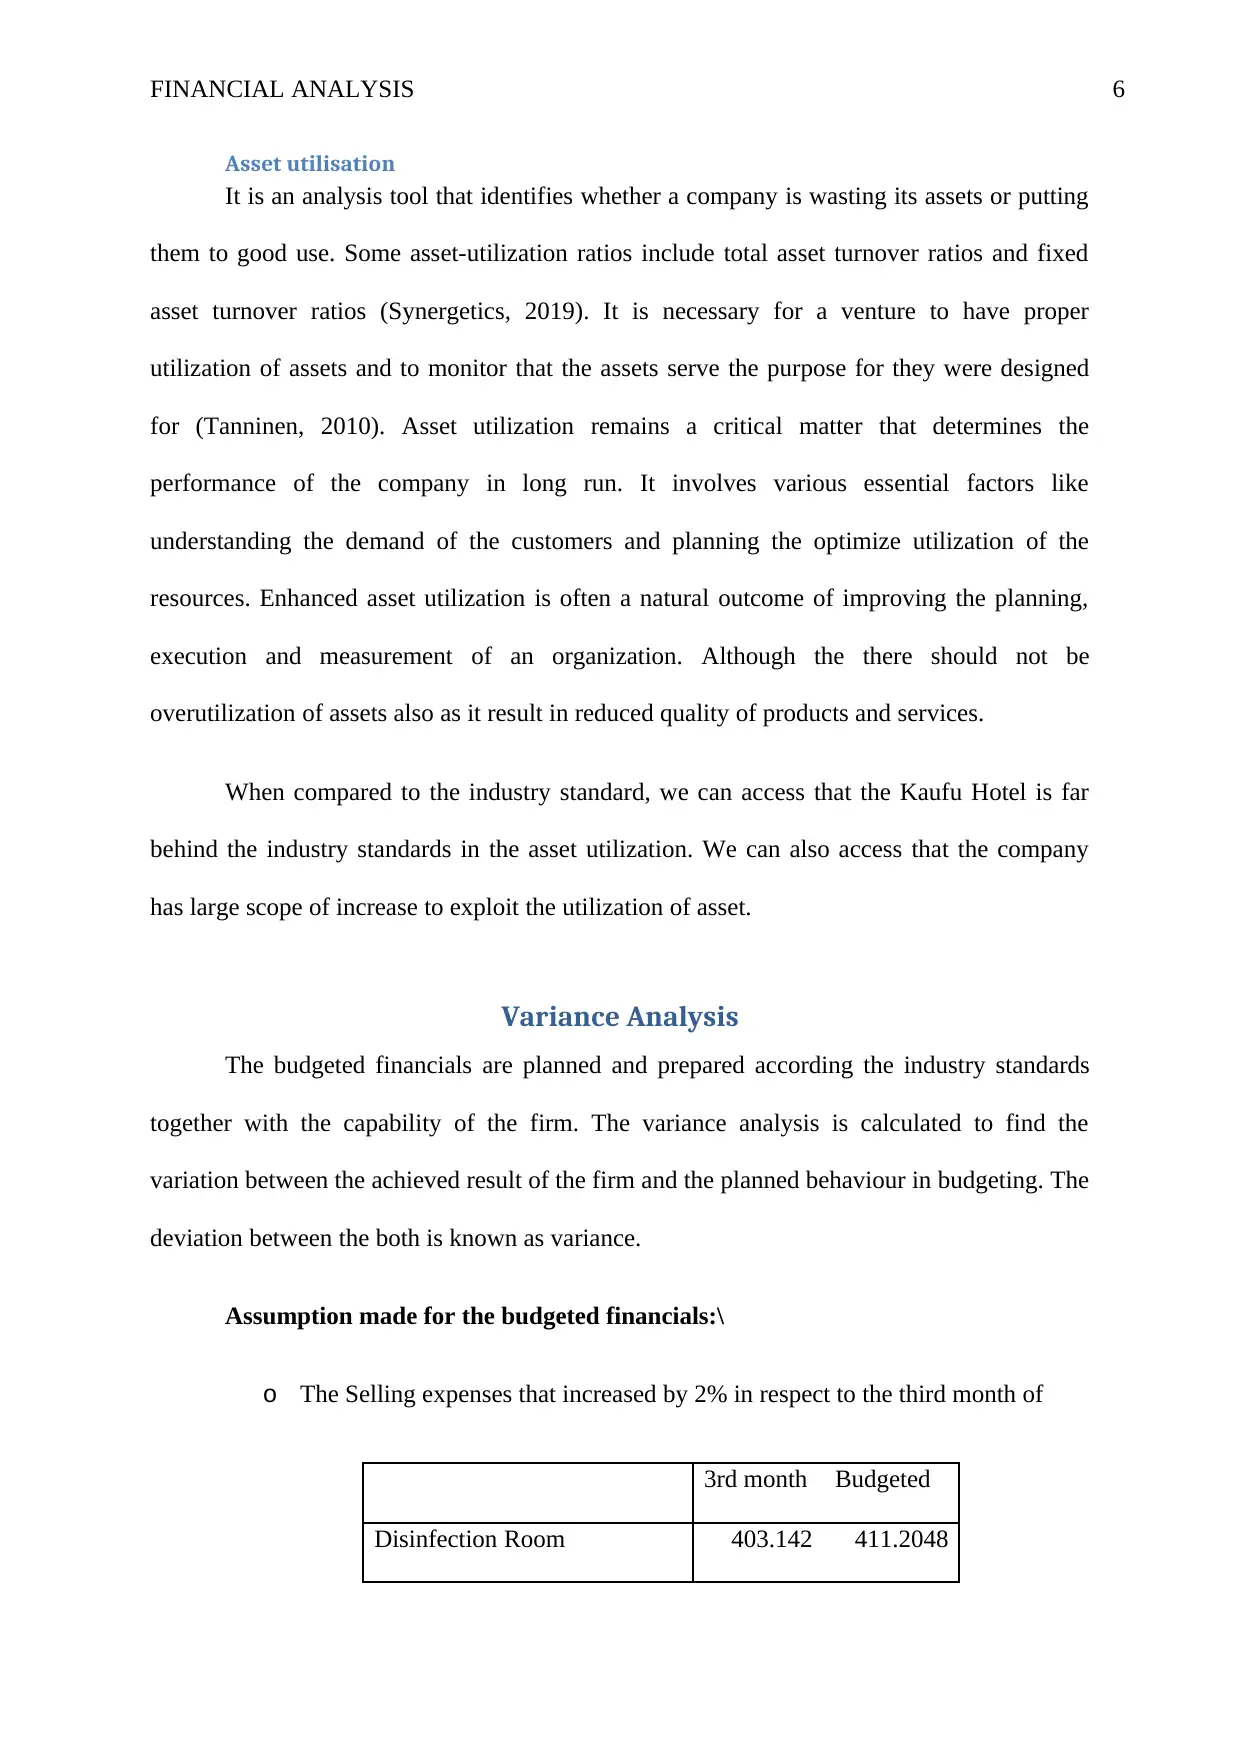
Asset utilisation
It is an analysis tool that identifies whether a company is wasting its assets or putting
them to good use. Some asset-utilization ratios include total asset turnover ratios and fixed
asset turnover ratios (Synergetics, 2019). It is necessary for a venture to have proper
utilization of assets and to monitor that the assets serve the purpose for they were designed
for (Tanninen, 2010). Asset utilization remains a critical matter that determines the
performance of the company in long run. It involves various essential factors like
understanding the demand of the customers and planning the optimize utilization of the
resources. Enhanced asset utilization is often a natural outcome of improving the planning,
execution and measurement of an organization. Although the there should not be
overutilization of assets also as it result in reduced quality of products and services.
When compared to the industry standard, we can access that the Kaufu Hotel is far
behind the industry standards in the asset utilization. We can also access that the company
has large scope of increase to exploit the utilization of asset.
Variance Analysis
The budgeted financials are planned and prepared according the industry standards
together with the capability of the firm. The variance analysis is calculated to find the
variation between the achieved result of the firm and the planned behaviour in budgeting. The
deviation between the both is known as variance.
Assumption made for the budgeted financials:\
o The Selling expenses that increased by 2% in respect to the third month of
3rd month Budgeted
Disinfection Room 403.142 411.2048
Paraphrase This Document
Need a fresh take? Get an instant paraphrase of this document with our AI Paraphraser
FINANCIAL ANALYSIS 7
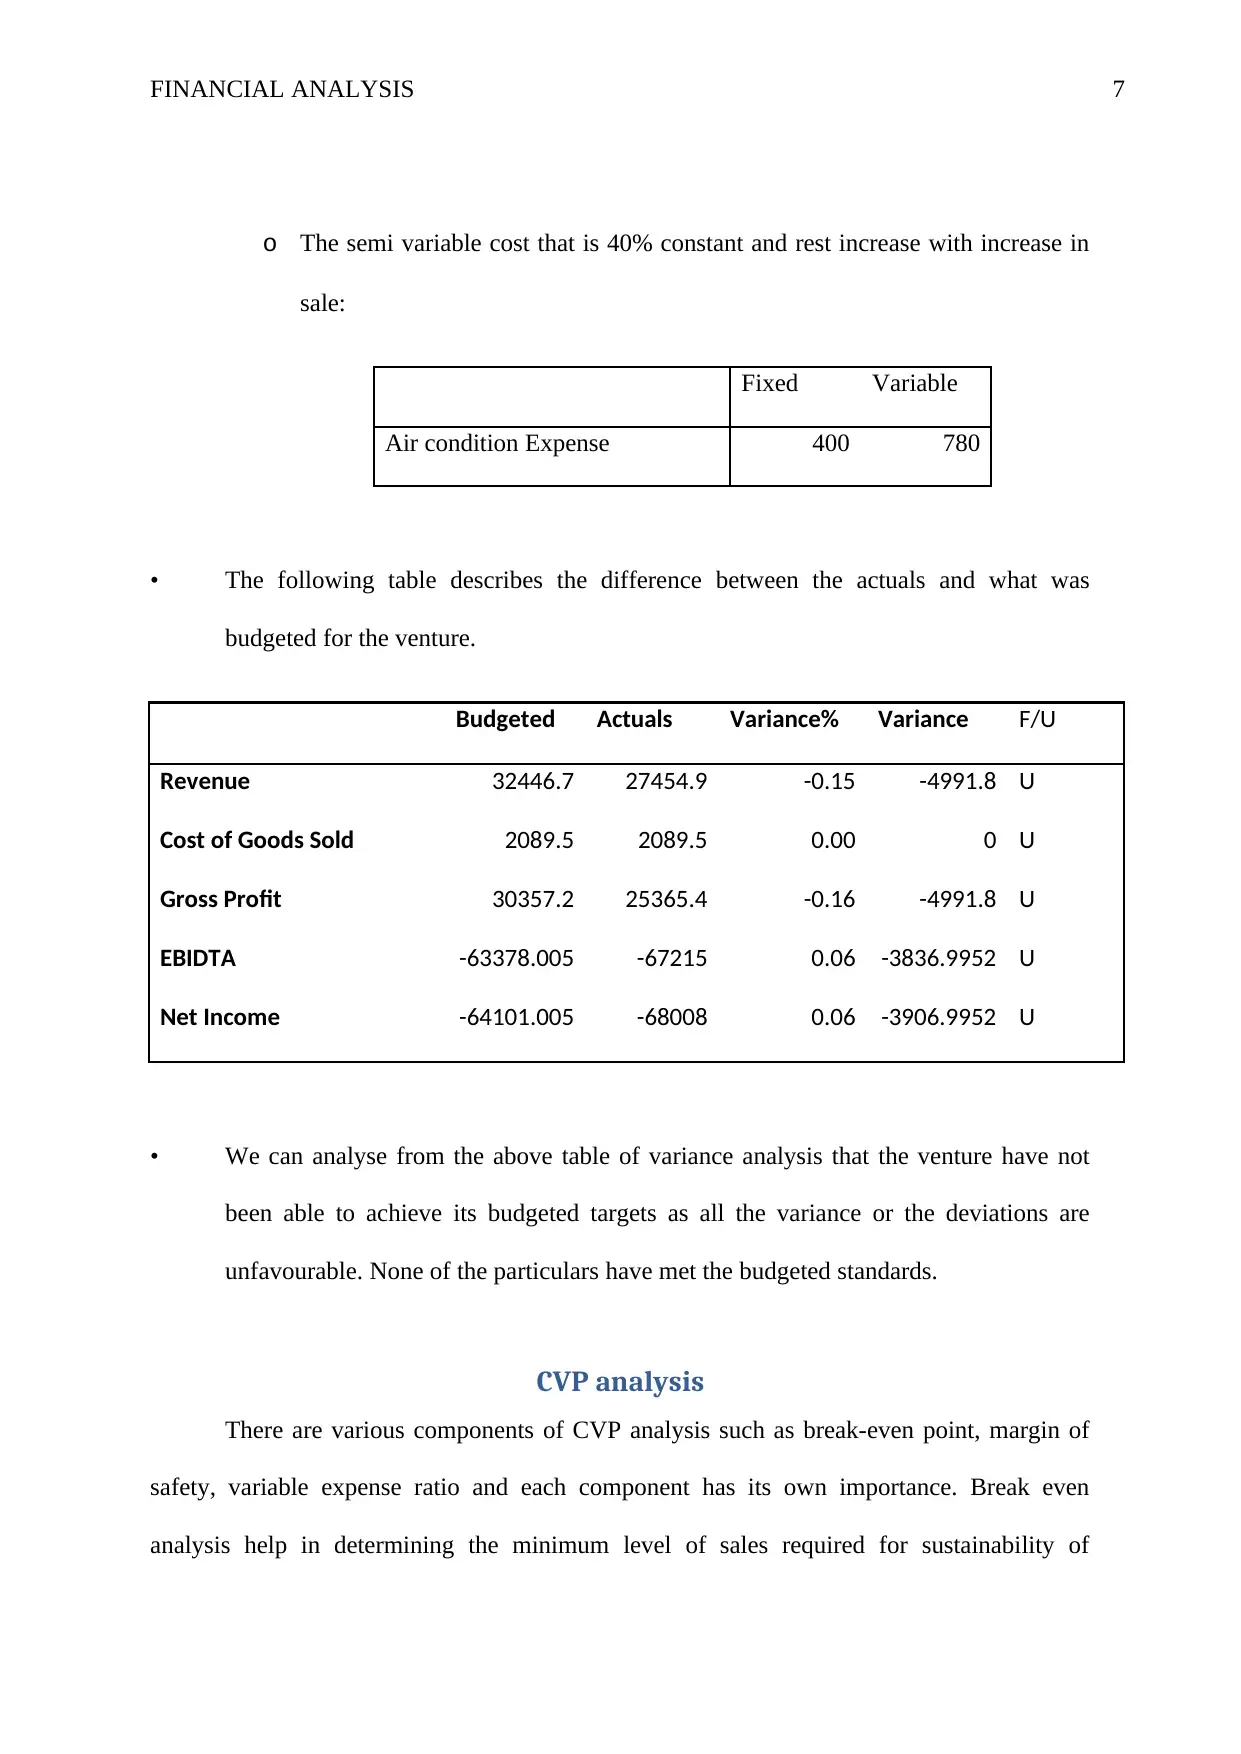
o The semi variable cost that is 40% constant and rest increase with increase in
sale:
Fixed Variable
Air condition Expense 400 780
• The following table describes the difference between the actuals and what was
budgeted for the venture.
Budgeted Actuals Variance% Variance F/U
Revenue 32446.7 27454.9 -0.15 -4991.8 U
Cost of Goods Sold 2089.5 2089.5 0.00 0 U
Gross Profit 30357.2 25365.4 -0.16 -4991.8 U
EBIDTA -63378.005 -67215 0.06 -3836.9952 U
Net Income -64101.005 -68008 0.06 -3906.9952 U
• We can analyse from the above table of variance analysis that the venture have not
been able to achieve its budgeted targets as all the variance or the deviations are
unfavourable. None of the particulars have met the budgeted standards.
CVP analysis
There are various components of CVP analysis such as break-even point, margin of
safety, variable expense ratio and each component has its own importance. Break even
analysis help in determining the minimum level of sales required for sustainability of
FINANCIAL ANALYSIS 8
business (Cosic, Shanks & Maynard, 2015). Margin of safety is the excess margin achieved
by the firm above the break-even point. Variable Expense Ratio shows the significance of
variable expense.
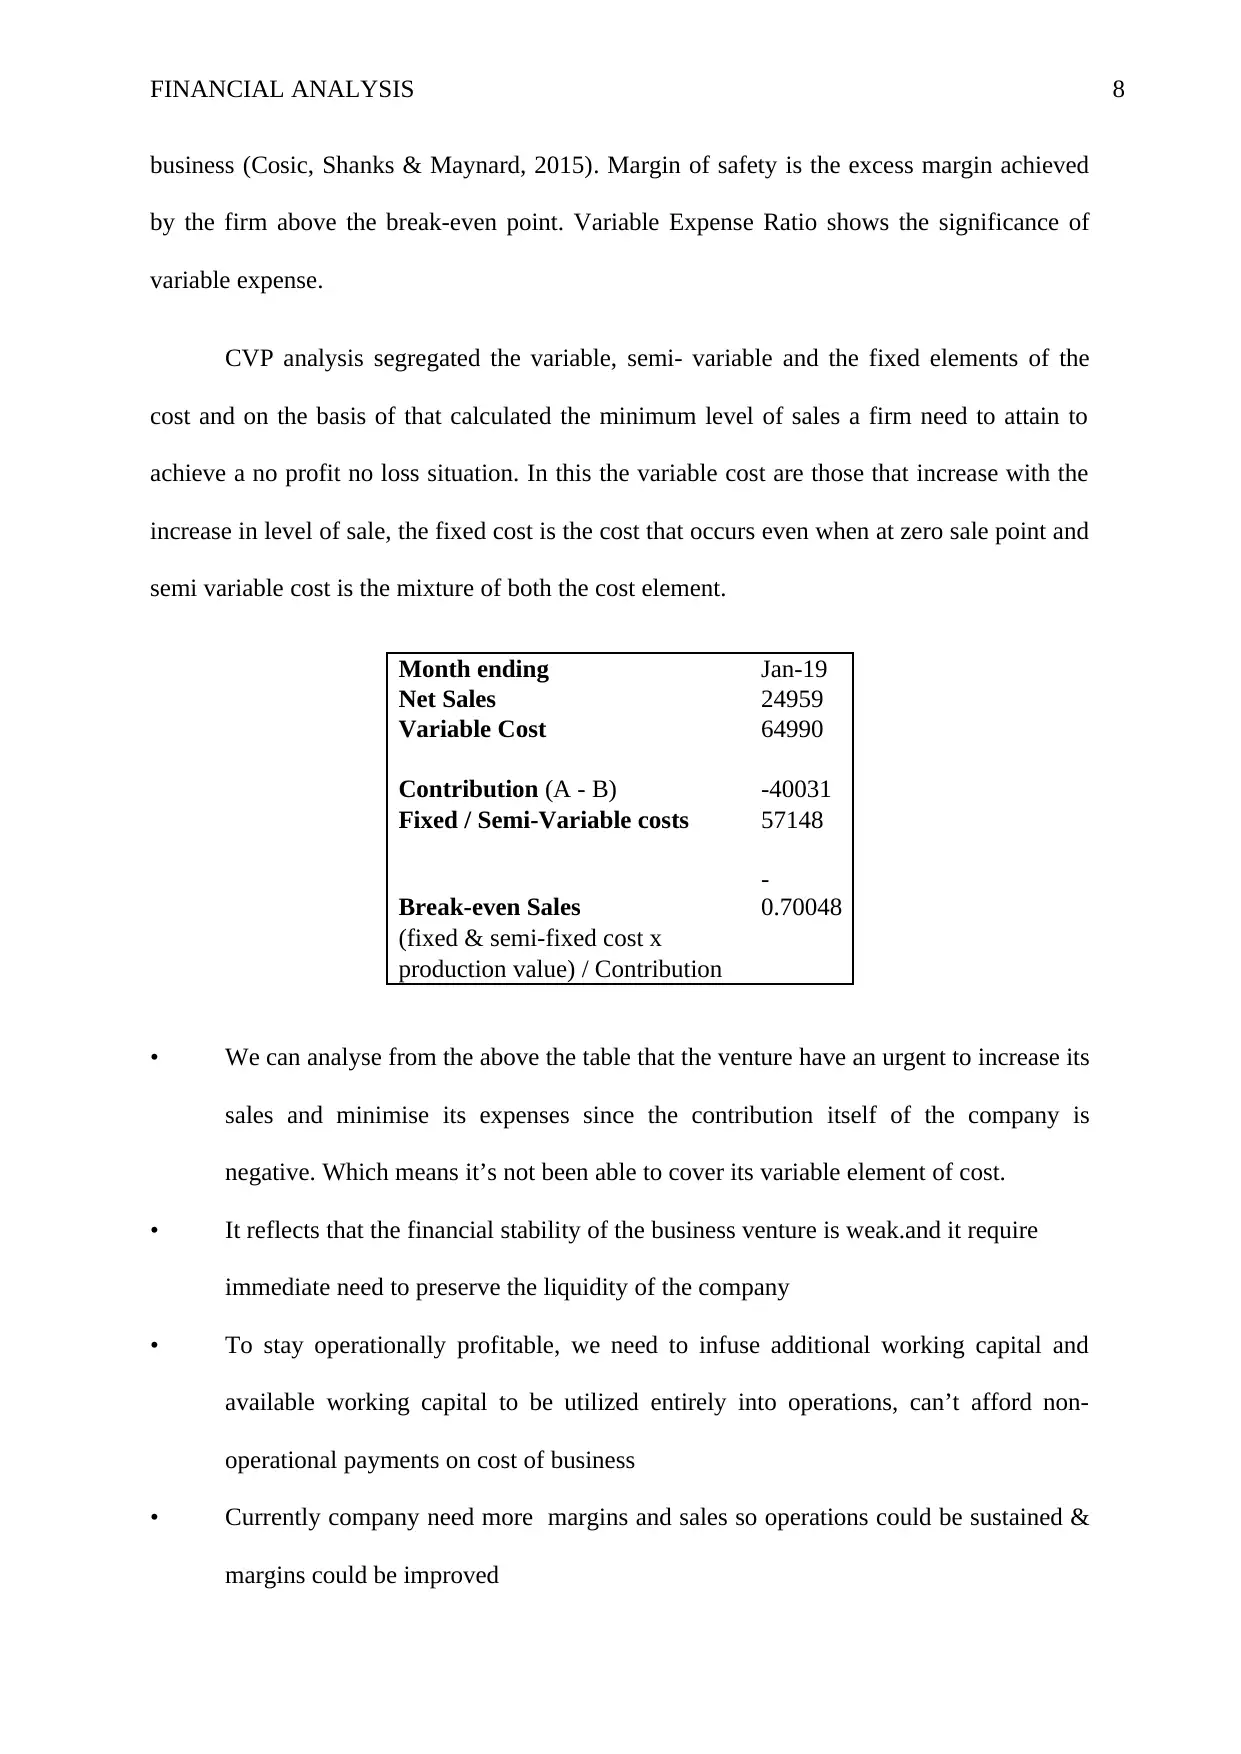
CVP analysis segregated the variable, semi- variable and the fixed elements of the
cost and on the basis of that calculated the minimum level of sales a firm need to attain to
achieve a no profit no loss situation. In this the variable cost are those that increase with the
increase in level of sale, the fixed cost is the cost that occurs even when at zero sale point and
semi variable cost is the mixture of both the cost element.
Month ending Jan-19
Net Sales 24959
Variable Cost 64990
Contribution (A - B) -40031
Fixed / Semi-Variable costs 57148
Break-even Sales
-
0.70048
(fixed & semi-fixed cost x
production value) / Contribution
• We can analyse from the above the table that the venture have an urgent to increase its
sales and minimise its expenses since the contribution itself of the company is
negative. Which means it’s not been able to cover its variable element of cost.
• It reflects that the financial stability of the business venture is weak.and it require
immediate need to preserve the liquidity of the company
• To stay operationally profitable, we need to infuse additional working capital and
available working capital to be utilized entirely into operations, can’t afford non-
operational payments on cost of business
• Currently company need more margins and sales so operations could be sustained &
margins could be improved
business (Cosic, Shanks & Maynard, 2015). Margin of safety is the excess margin achieved
by the firm above the break-even point. Variable Expense Ratio shows the significance of
variable expense.
CVP analysis segregated the variable, semi- variable and the fixed elements of the
cost and on the basis of that calculated the minimum level of sales a firm need to attain to
achieve a no profit no loss situation. In this the variable cost are those that increase with the
increase in level of sale, the fixed cost is the cost that occurs even when at zero sale point and
semi variable cost is the mixture of both the cost element.
Month ending Jan-19
Net Sales 24959
Variable Cost 64990
Contribution (A - B) -40031
Fixed / Semi-Variable costs 57148
Break-even Sales
-
0.70048
(fixed & semi-fixed cost x
production value) / Contribution
• We can analyse from the above the table that the venture have an urgent to increase its
sales and minimise its expenses since the contribution itself of the company is
negative. Which means it’s not been able to cover its variable element of cost.
• It reflects that the financial stability of the business venture is weak.and it require
immediate need to preserve the liquidity of the company
• To stay operationally profitable, we need to infuse additional working capital and
available working capital to be utilized entirely into operations, can’t afford non-
operational payments on cost of business
• Currently company need more margins and sales so operations could be sustained &
margins could be improved
⊘ This is a preview!⊘
Do you want full access?
Subscribe today to unlock all pages.
Trusted by 1+ million students worldwide

FINANCIAL ANALYSIS 9
Paraphrase This Document
Need a fresh take? Get an instant paraphrase of this document with our AI Paraphraser
FINANCIAL ANALYSIS 10
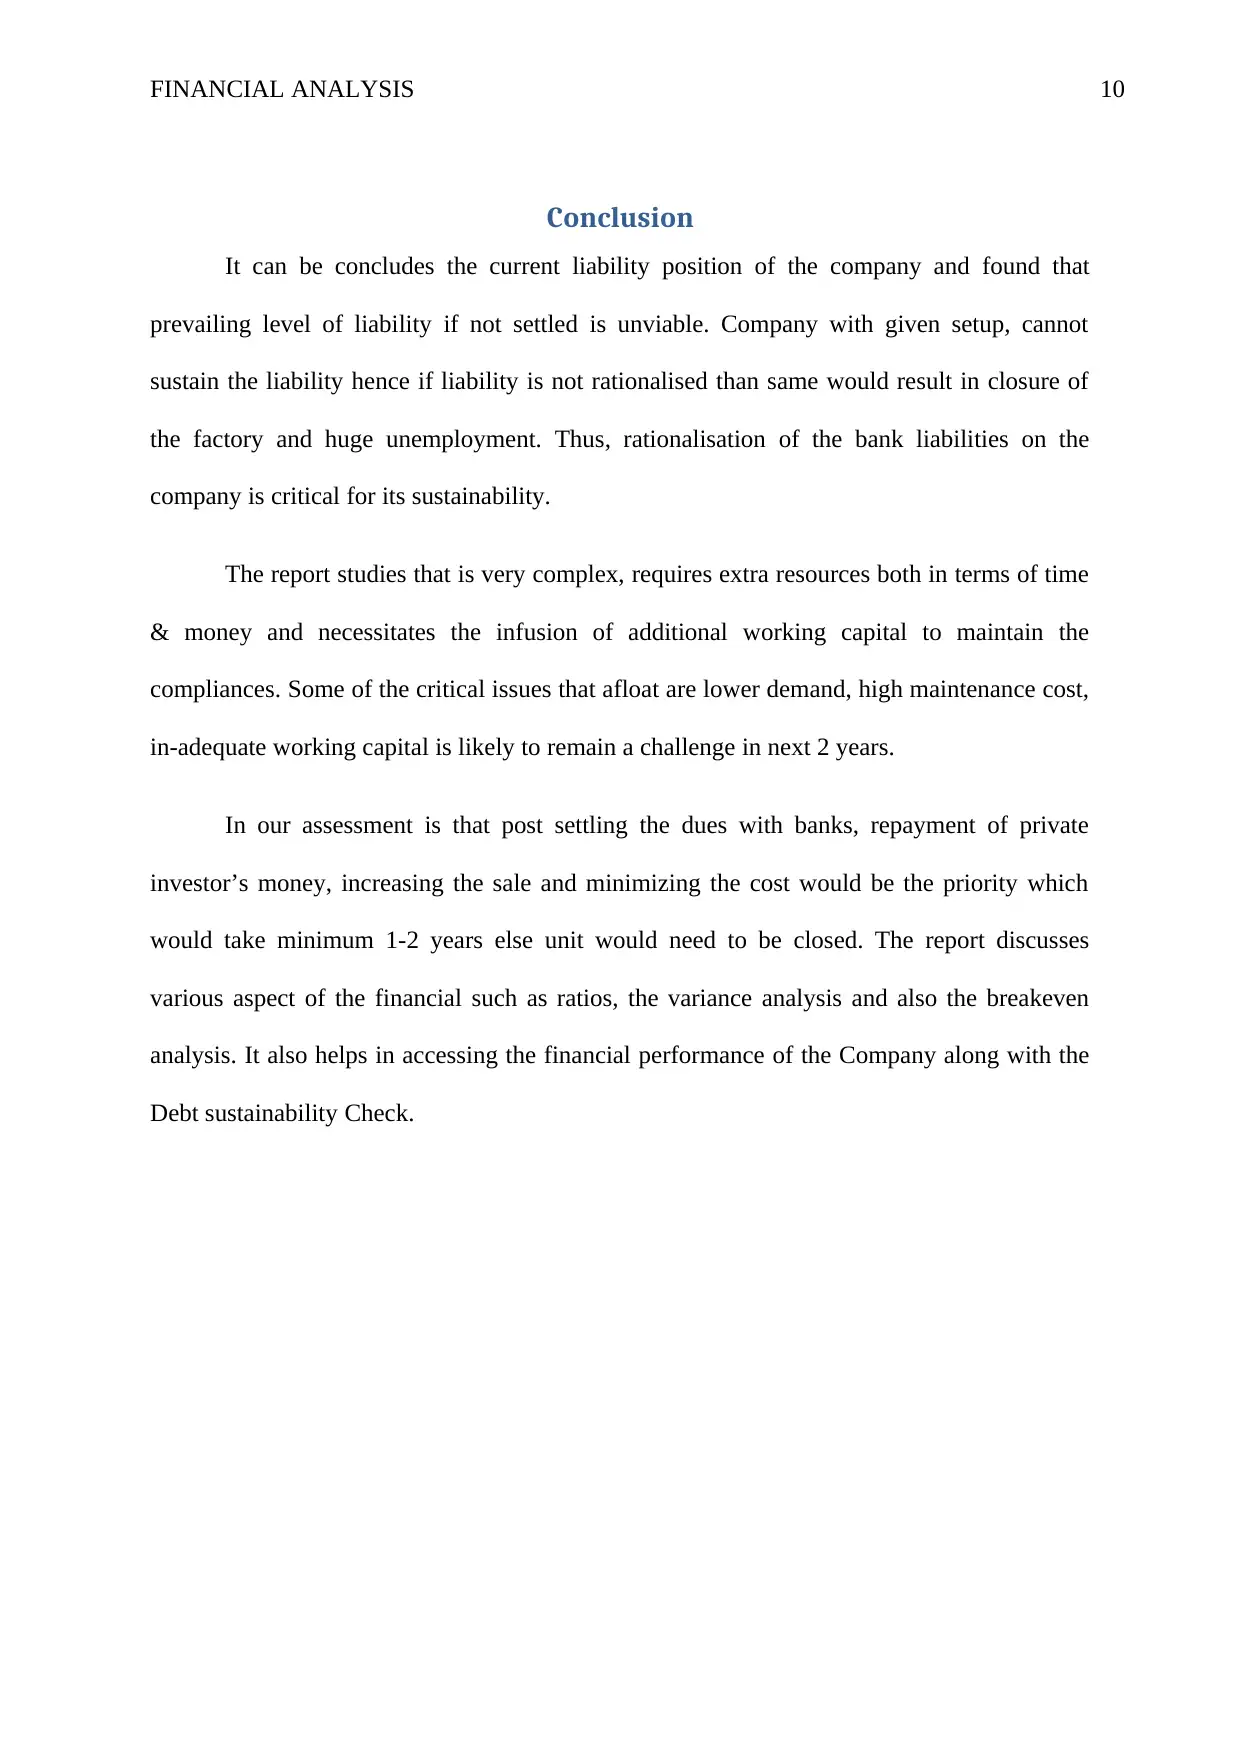
Conclusion
It can be concludes the current liability position of the company and found that
prevailing level of liability if not settled is unviable. Company with given setup, cannot
sustain the liability hence if liability is not rationalised than same would result in closure of
the factory and huge unemployment. Thus, rationalisation of the bank liabilities on the
company is critical for its sustainability.
The report studies that is very complex, requires extra resources both in terms of time
& money and necessitates the infusion of additional working capital to maintain the
compliances. Some of the critical issues that afloat are lower demand, high maintenance cost,
in-adequate working capital is likely to remain a challenge in next 2 years.
In our assessment is that post settling the dues with banks, repayment of private
investor’s money, increasing the sale and minimizing the cost would be the priority which
would take minimum 1-2 years else unit would need to be closed. The report discusses
various aspect of the financial such as ratios, the variance analysis and also the breakeven
analysis. It also helps in accessing the financial performance of the Company along with the
Debt sustainability Check.
FINANCIAL ANALYSIS 11
References
Babalola, Y. A., & Abiola, F. R. (2013). Financial ratio analysis of firms: A tool for decision
making. International journal of management sciences, 1(4), 132-137.
Beaver, W. H., Correia, M., & McNichols, M. F. (2011). Financial statement analysis and the
prediction of financial distress. Foundations and Trends® in Accounting, 5(2), 99-
173.
Cliffsnotes. (2019). Cost-Volume-Profit Analysis. Cliffsnotes.com. Retrieved from
https://www.cliffsnotes.com/study-guides/accounting/accounting-principles-ii/cost-
volume-profit-relationships/cost-volume-profit-analysis
Corporate Finance Institute. (2019). Analysis of Financial Statements - Free Financial
Analysis Guide. Corporate Finance Institute. Retrieved from
https://corporatefinanceinstitute.com/resources/knowledge/finance/analysis-of-
financial-statements/
Cosic, R., Shanks, G., & Maynard, S. B. (2015). A business analytics capability framework.
Australasian Journal of Information Systems, 19.
Investopedia. (2019). Financial Analysis. Investopedia. Retrieved from
https://www.investopedia.com/terms/f/financial-analysis.asp .
Smallbusiness.chron.com.. (2019). How to Determine the Financial Stability of a Small
Business. Smallbusiness.chron.com. Retrieved from
https://smallbusiness.chron.com/determine-financial-stability-small-business-
58597.html
Synergetics. (2019). Asset Utilization. Synergeticsww.com. Retrieved from
http://www.synergeticsww.com/problems-we-solve/return-on-assets/asset-utilization/
Tanninen, K., Puumalainen, K., & Sandström, J. (2010). The power of TQM: analysis of its
effects on profitability, productivity and customer satisfaction. Total Quality
Management, 21(2), 171-184.
Titman, S., Keown, A. J., Martin, J. D., & Martin, T. (2011). Financial management:
Principles and applications (Vol. 11). Boston: Prentice Hall.
⊘ This is a preview!⊘
Do you want full access?
Subscribe today to unlock all pages.
Trusted by 1+ million students worldwide
1 out of 13
Related Documents


Your All-in-One AI-Powered Toolkit for Academic Success.
+13062052269
info@desklib.com
Available 24*7 on WhatsApp / Email
![[object Object]](/_next/static/media/star-bottom.7253800d.svg)
Unlock your academic potential
Copyright © 2020–2026 A2Z Services. All Rights Reserved. Developed and managed by ZUCOL.