Detailed Financial Analysis Report: Life Health Care Group Company
VerifiedAdded on 2021/06/17
|23
|3628
|23
Report
AI Summary
This report presents a financial analysis of Life Health Care Group, a healthcare organization. It examines the company's governance structure, including key managerial personnel and ownership details. The analysis employs various financial tools, such as ratio analysis (short-term and long-term solvency, profitability, and market payout ratios) to assess the company's performance. The report also investigates share price movements, beta calculations, and the application of the CAPM method to determine the required rate of return. Furthermore, it explores the weighted average cost of capital (WACC), the implications of WACC on investment decisions, and the company's debt and dividend policies. The report concludes with recommendations for investors and a letter of recommendation, offering a comprehensive overview of Life Health Care Group's financial health and investment potential.
RUNNING HEAD: Financial analysis of Company 1
Name of the student
Topic- Financial analysis of Company
University name
Name of the student
Topic- Financial analysis of Company
University name
Paraphrase This Document
Need a fresh take? Get an instant paraphrase of this document with our AI Paraphraser
Life Health Care Group Company 2
Table of Contents
Introduction...........................................................................................................................................3
1. Details of Company....................................................................................................................3
2. Governance structure of Life Health Care Group Company...........................................................3
3. Ratio analysis of Life Health Care Group Company......................................................................6
Short term solvency...........................................................................................................................6
Long term solvency ratio...............................................................................................................7
Profitability ratio............................................................................................................................8
Market pay-out ratio.....................................................................................................................9
4. Share price movement of Life Health Care Group Company........................................................9
4.1 Graph Movement of Life Health Care Group Company..............................................................9
4.2 Comparison off the share price movement of Life Insurance Group Company with the all
ordinary index..................................................................................................................................10
Introduction.................................................................................................................................10
Conclusion...................................................................................................................................10
5. Announcements..........................................................................................................................11
6. Research via internet...................................................................................................................11
6.1 The value of beta is calculated from the data fetch from Yahoo finance i.e. .15.......................11
6.2 Computation of required rate of return by using CAPM method..............................................12
6.3 Determination of conservative investment...............................................................................13
7. Weighted Average Cost of Capital (WACC)..................................................................................13
7.1 Cost of equity (calculated above using CAPM......................................................................13
7.2 Implications that a higher WACC on investment decision...................................................13
8. Consideration of Debt ratio of Life Health care group.................................................................14
8.1 Increased financial leverage and debt portions in capital structure..............................................15
9. Divided policies of company........................................................................................................15
10. Letter of recommendation.......................................................................................................15
11. Conclusion...............................................................................................................................17
12. References...............................................................................................................................18
Life Health Care Group Company 3
Introduction
This report shows the financial analysis of the company. In this report, several
financial analysis tools have been used such as capital budgeting tool, Capital structure
analysis and ratio analysis. In this report, Life Health Care Group Company has been
selected. This report starts with the capital structure and governance of the company. After
that ratio analysis has been used. Afterwards, share price movement and beta analysis have
been used to identify the future growth of the business. After that, determination of the
dividend policy, letter of recommendation have been given to clients.
1. Details of Company
It is healthcare organization which is established as biggest private hospital having its
business in South Africa and owned by the Australian Departmental Stores.
2. Governance structure of Life Health Care Group
Company
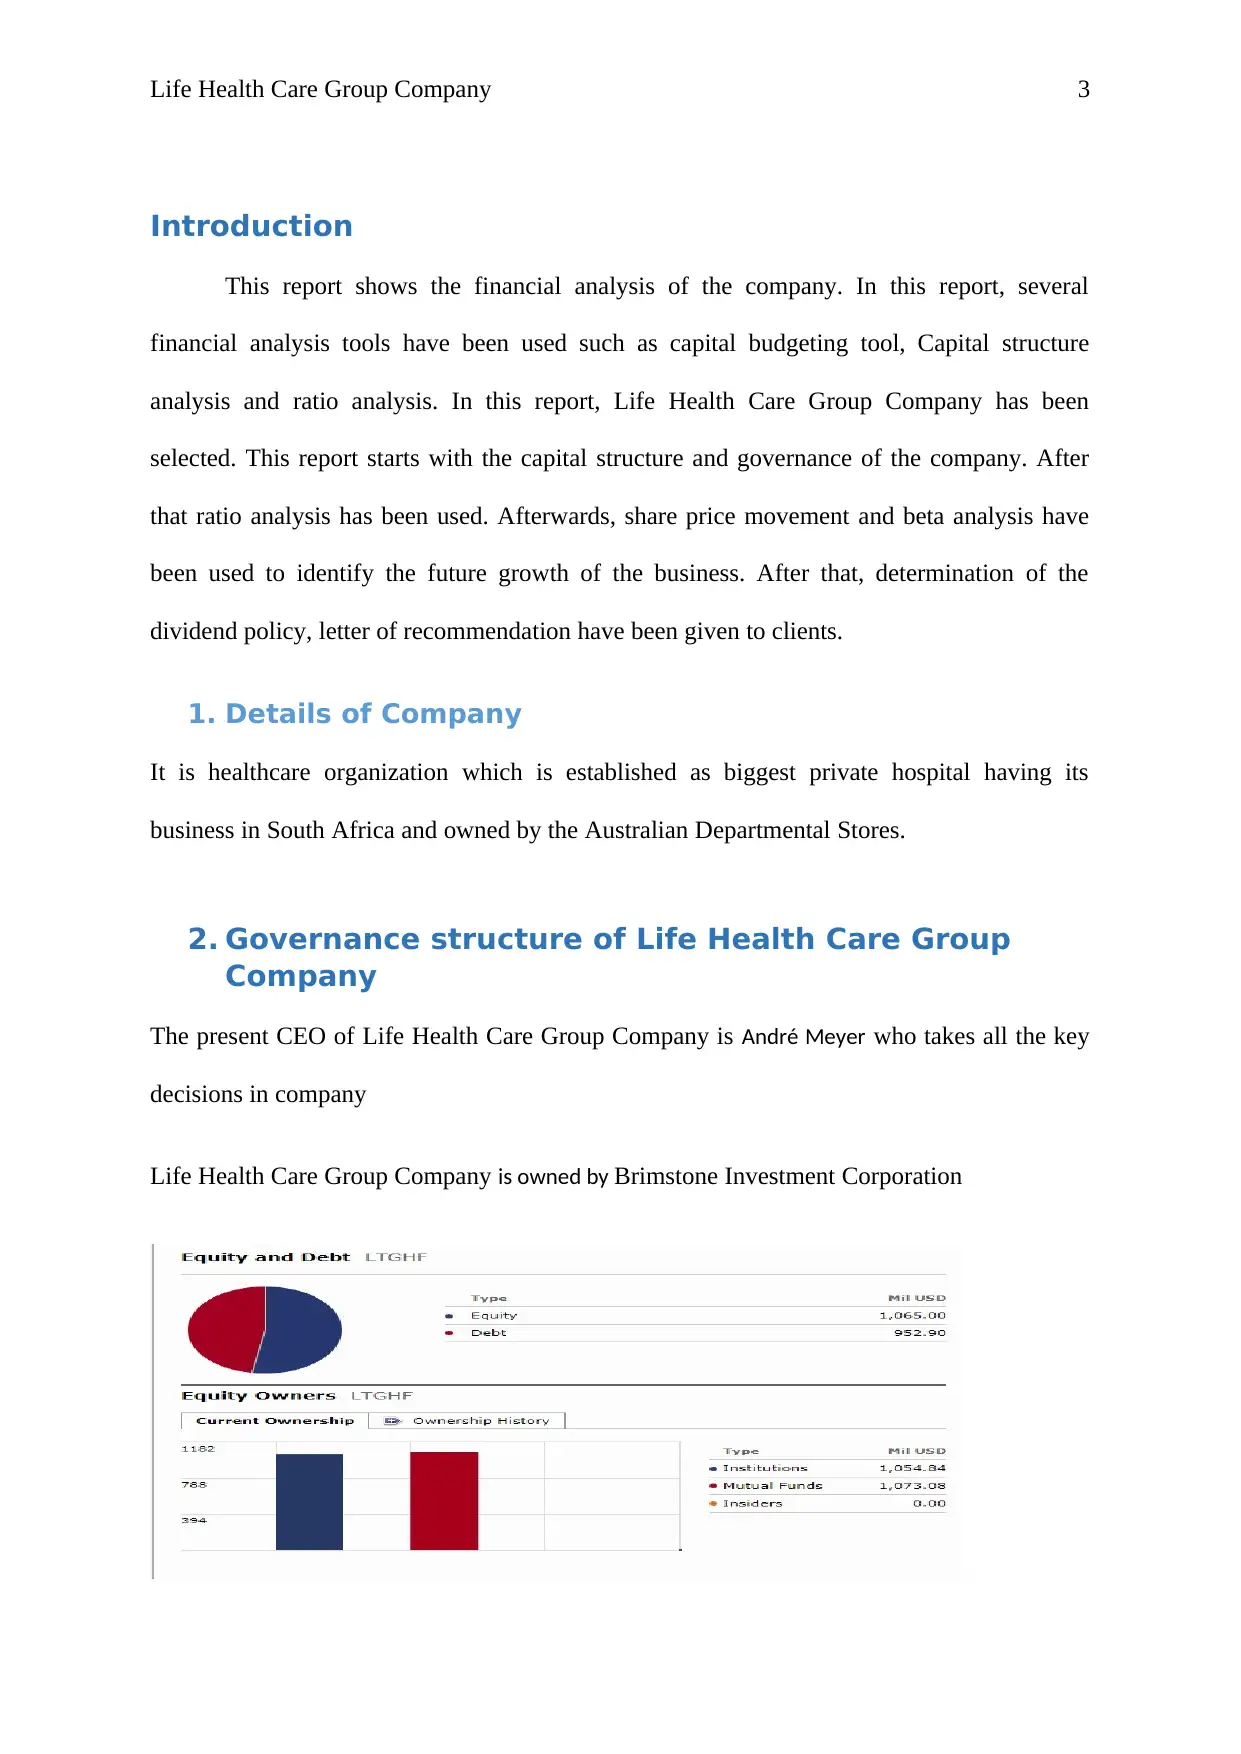
The present CEO of Life Health Care Group Company is André Meyer who takes all the key
decisions in company
Life Health Care Group Company is owned by Brimstone Investment Corporation
Introduction
This report shows the financial analysis of the company. In this report, several
financial analysis tools have been used such as capital budgeting tool, Capital structure
analysis and ratio analysis. In this report, Life Health Care Group Company has been
selected. This report starts with the capital structure and governance of the company. After
that ratio analysis has been used. Afterwards, share price movement and beta analysis have
been used to identify the future growth of the business. After that, determination of the
dividend policy, letter of recommendation have been given to clients.
1. Details of Company
It is healthcare organization which is established as biggest private hospital having its
business in South Africa and owned by the Australian Departmental Stores.
2. Governance structure of Life Health Care Group
Company
The present CEO of Life Health Care Group Company is André Meyer who takes all the key
decisions in company
Life Health Care Group Company is owned by Brimstone Investment Corporation
⊘ This is a preview!⊘
Do you want full access?
Subscribe today to unlock all pages.
Trusted by 1+ million students worldwide
Life Health Care Group Company 4
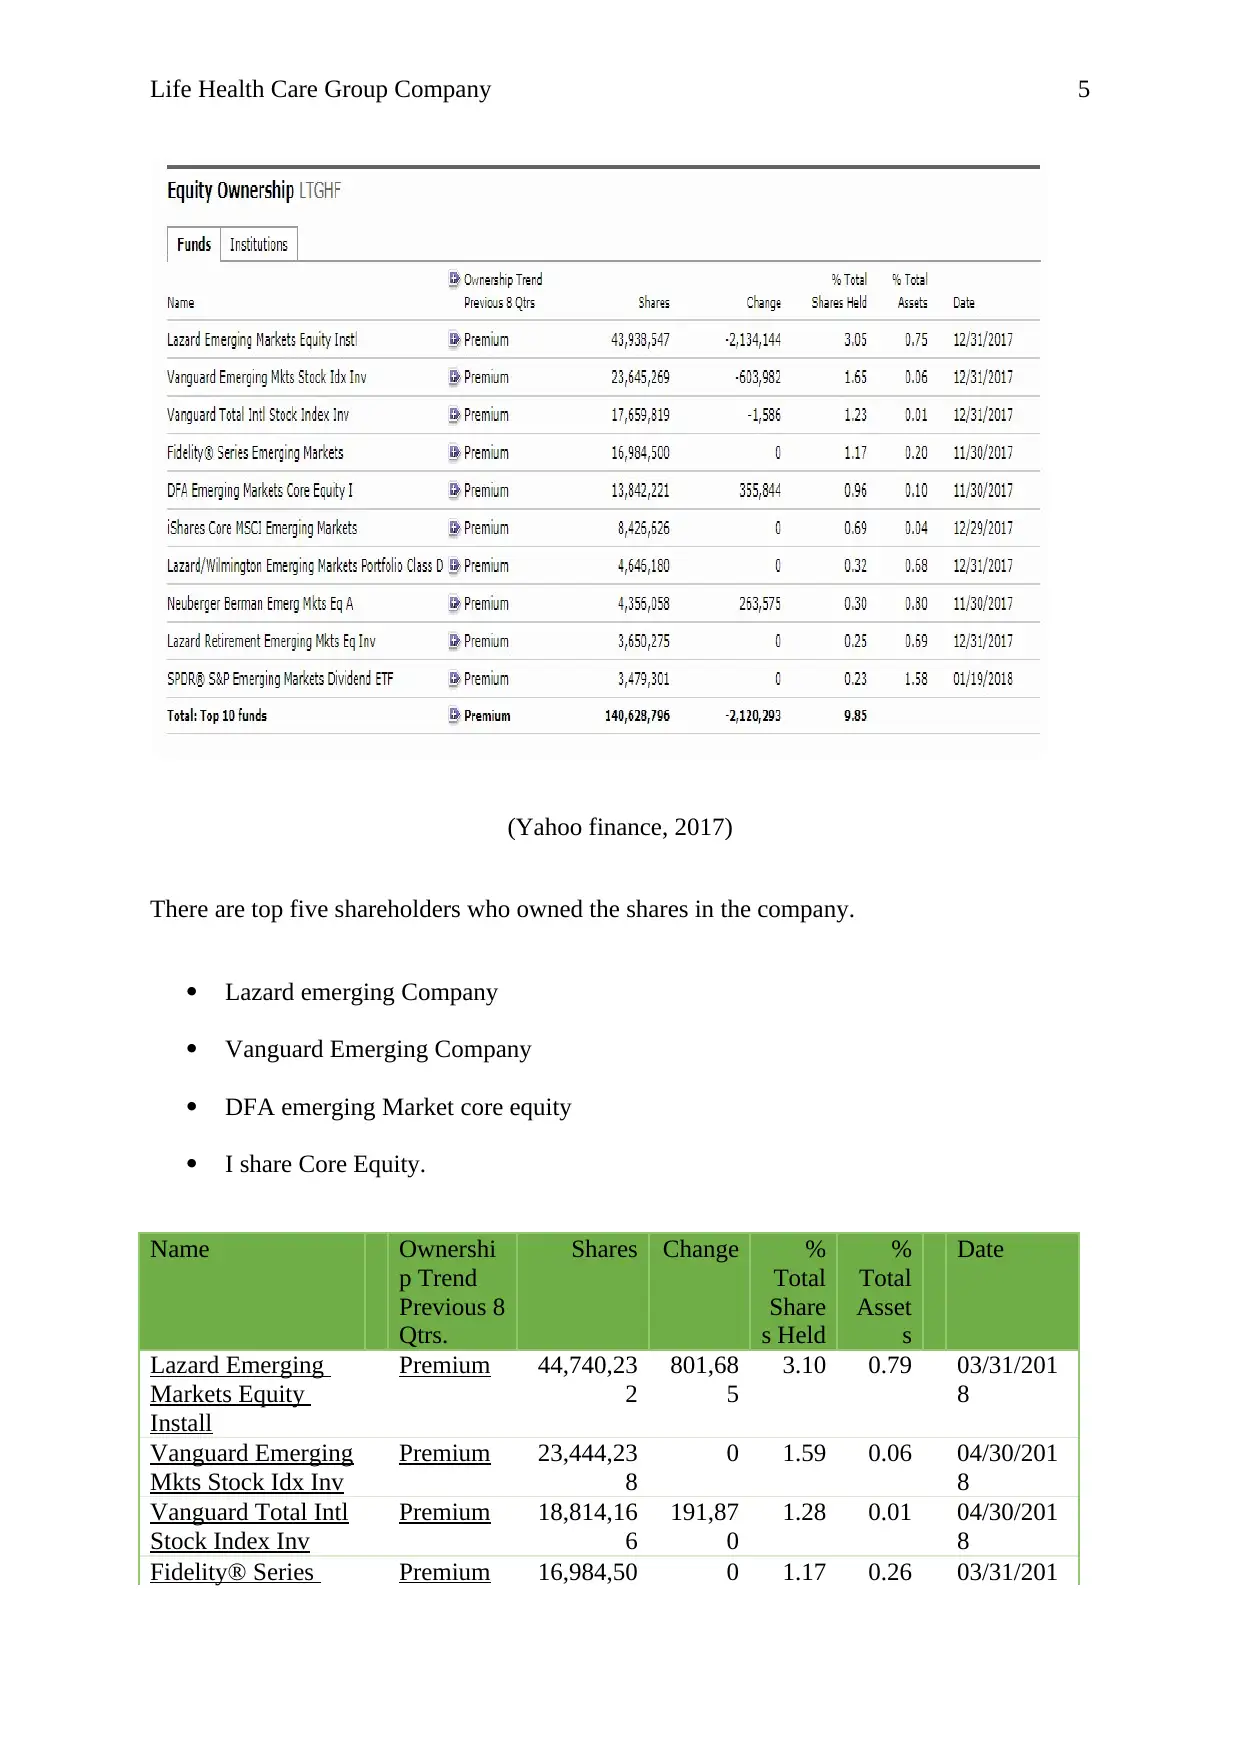
(Yahoo finance, 2017)
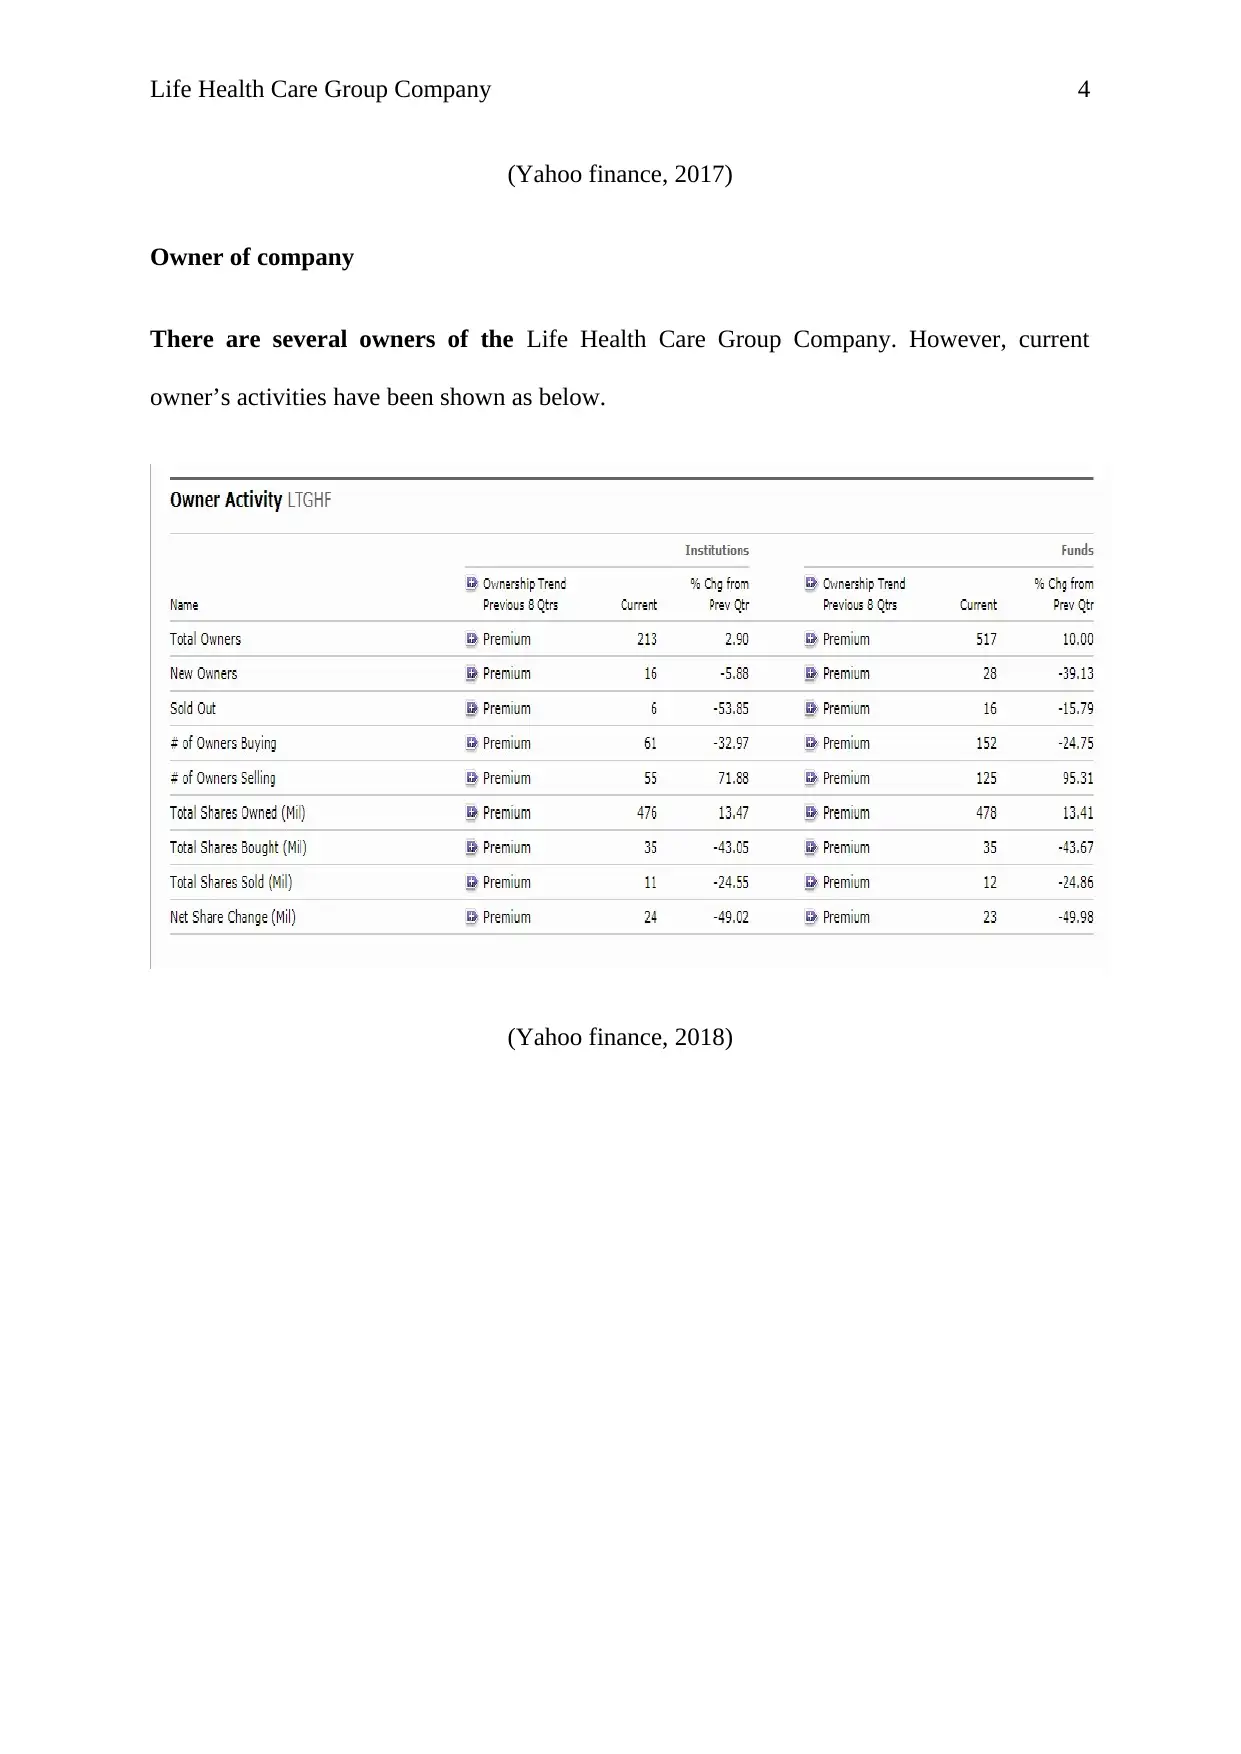
Owner of company
There are several owners of the Life Health Care Group Company. However, current
owner’s activities have been shown as below.
(Yahoo finance, 2018)
(Yahoo finance, 2017)
Owner of company
There are several owners of the Life Health Care Group Company. However, current
owner’s activities have been shown as below.
(Yahoo finance, 2018)
Paraphrase This Document
Need a fresh take? Get an instant paraphrase of this document with our AI Paraphraser
Life Health Care Group Company 5
(Yahoo finance, 2017)
There are top five shareholders who owned the shares in the company.
Lazard emerging Company
Vanguard Emerging Company
DFA emerging Market core equity
I share Core Equity.
Name Ownershi
p Trend
Previous 8
Qtrs.
Shares Change %
Total
Share
s Held
%
Total
Asset
s
Date
Lazard Emerging
Markets Equity
Install
Premium 44,740,23
2
801,68
5
3.10 0.79 03/31/201
8
Vanguard Emerging
Mkts Stock Idx Inv
Premium 23,444,23
8
0 1.59 0.06 04/30/201
8
Vanguard Total Intl
Stock Index Inv
Premium 18,814,16
6
191,87
0
1.28 0.01 04/30/201
8
Fidelity® Series Premium 16,984,50 0 1.17 0.26 03/31/201
Life Health Care Group Company 6
Emerging Markets 0 8
DFA Emerging
Markets Core
Premium 14,094,78
1
0 0.97 0.11 03/31/201
8
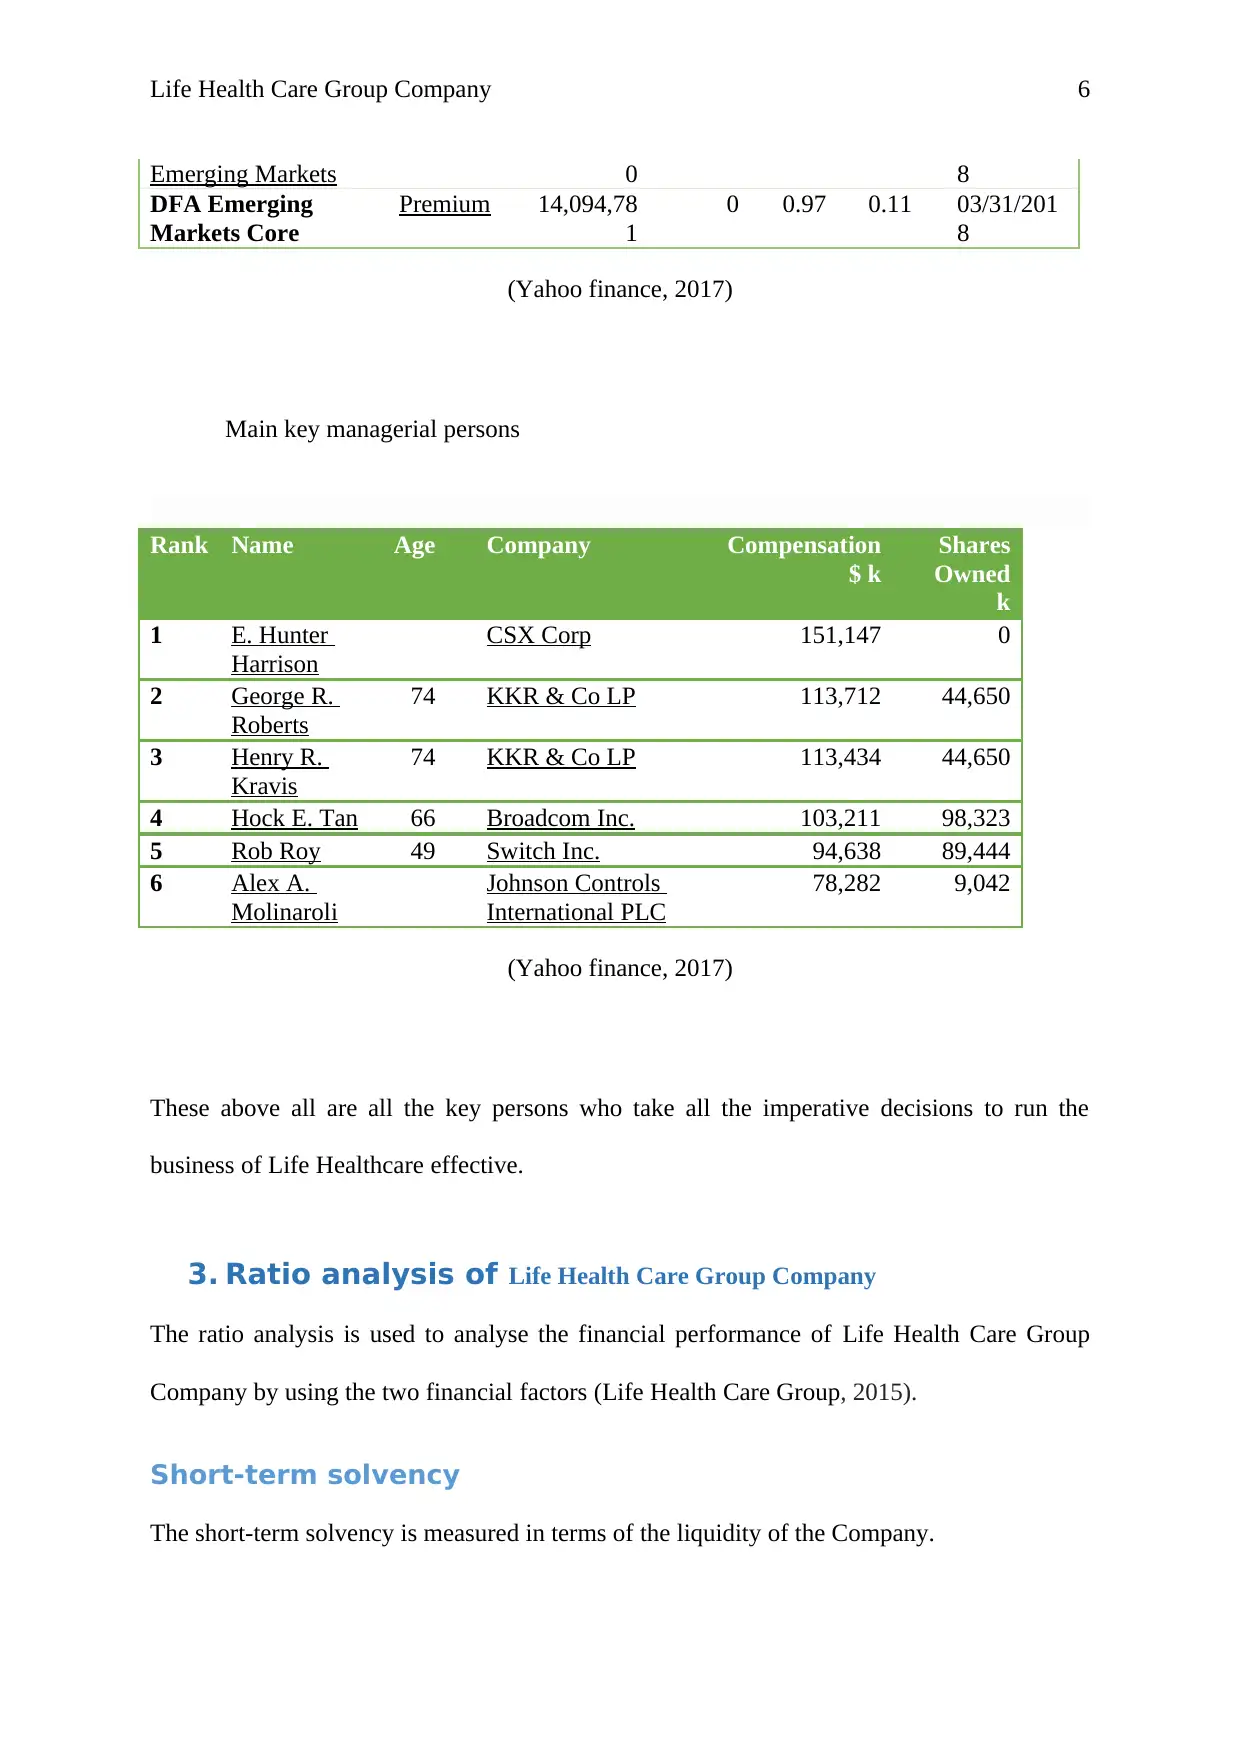
(Yahoo finance, 2017)
Main key managerial persons
Rank Name Age Company Compensation
$ k
Shares
Owned
k
1 E. Hunter
Harrison
CSX Corp 151,147 0
2 George R.
Roberts
74 KKR & Co LP 113,712 44,650
3 Henry R.
Kravis
74 KKR & Co LP 113,434 44,650
4 Hock E. Tan 66 Broadcom Inc. 103,211 98,323
5 Rob Roy 49 Switch Inc. 94,638 89,444
6 Alex A.
Molinaroli
Johnson Controls
International PLC
78,282 9,042
(Yahoo finance, 2017)
These above all are all the key persons who take all the imperative decisions to run the
business of Life Healthcare effective.
3. Ratio analysis of Life Health Care Group Company
The ratio analysis is used to analyse the financial performance of Life Health Care Group
Company by using the two financial factors (Life Health Care Group, 2015).
Short-term solvency
The short-term solvency is measured in terms of the liquidity of the Company.
Emerging Markets 0 8
DFA Emerging
Markets Core
Premium 14,094,78
1
0 0.97 0.11 03/31/201
8
(Yahoo finance, 2017)
Main key managerial persons
Rank Name Age Company Compensation
$ k
Shares
Owned
k
1 E. Hunter
Harrison
CSX Corp 151,147 0
2 George R.
Roberts
74 KKR & Co LP 113,712 44,650
3 Henry R.
Kravis
74 KKR & Co LP 113,434 44,650
4 Hock E. Tan 66 Broadcom Inc. 103,211 98,323
5 Rob Roy 49 Switch Inc. 94,638 89,444
6 Alex A.
Molinaroli
Johnson Controls
International PLC
78,282 9,042
(Yahoo finance, 2017)
These above all are all the key persons who take all the imperative decisions to run the
business of Life Healthcare effective.
3. Ratio analysis of Life Health Care Group Company
The ratio analysis is used to analyse the financial performance of Life Health Care Group
Company by using the two financial factors (Life Health Care Group, 2015).
Short-term solvency
The short-term solvency is measured in terms of the liquidity of the Company.
⊘ This is a preview!⊘
Do you want full access?
Subscribe today to unlock all pages.
Trusted by 1+ million students worldwide
Life Health Care Group Company 7
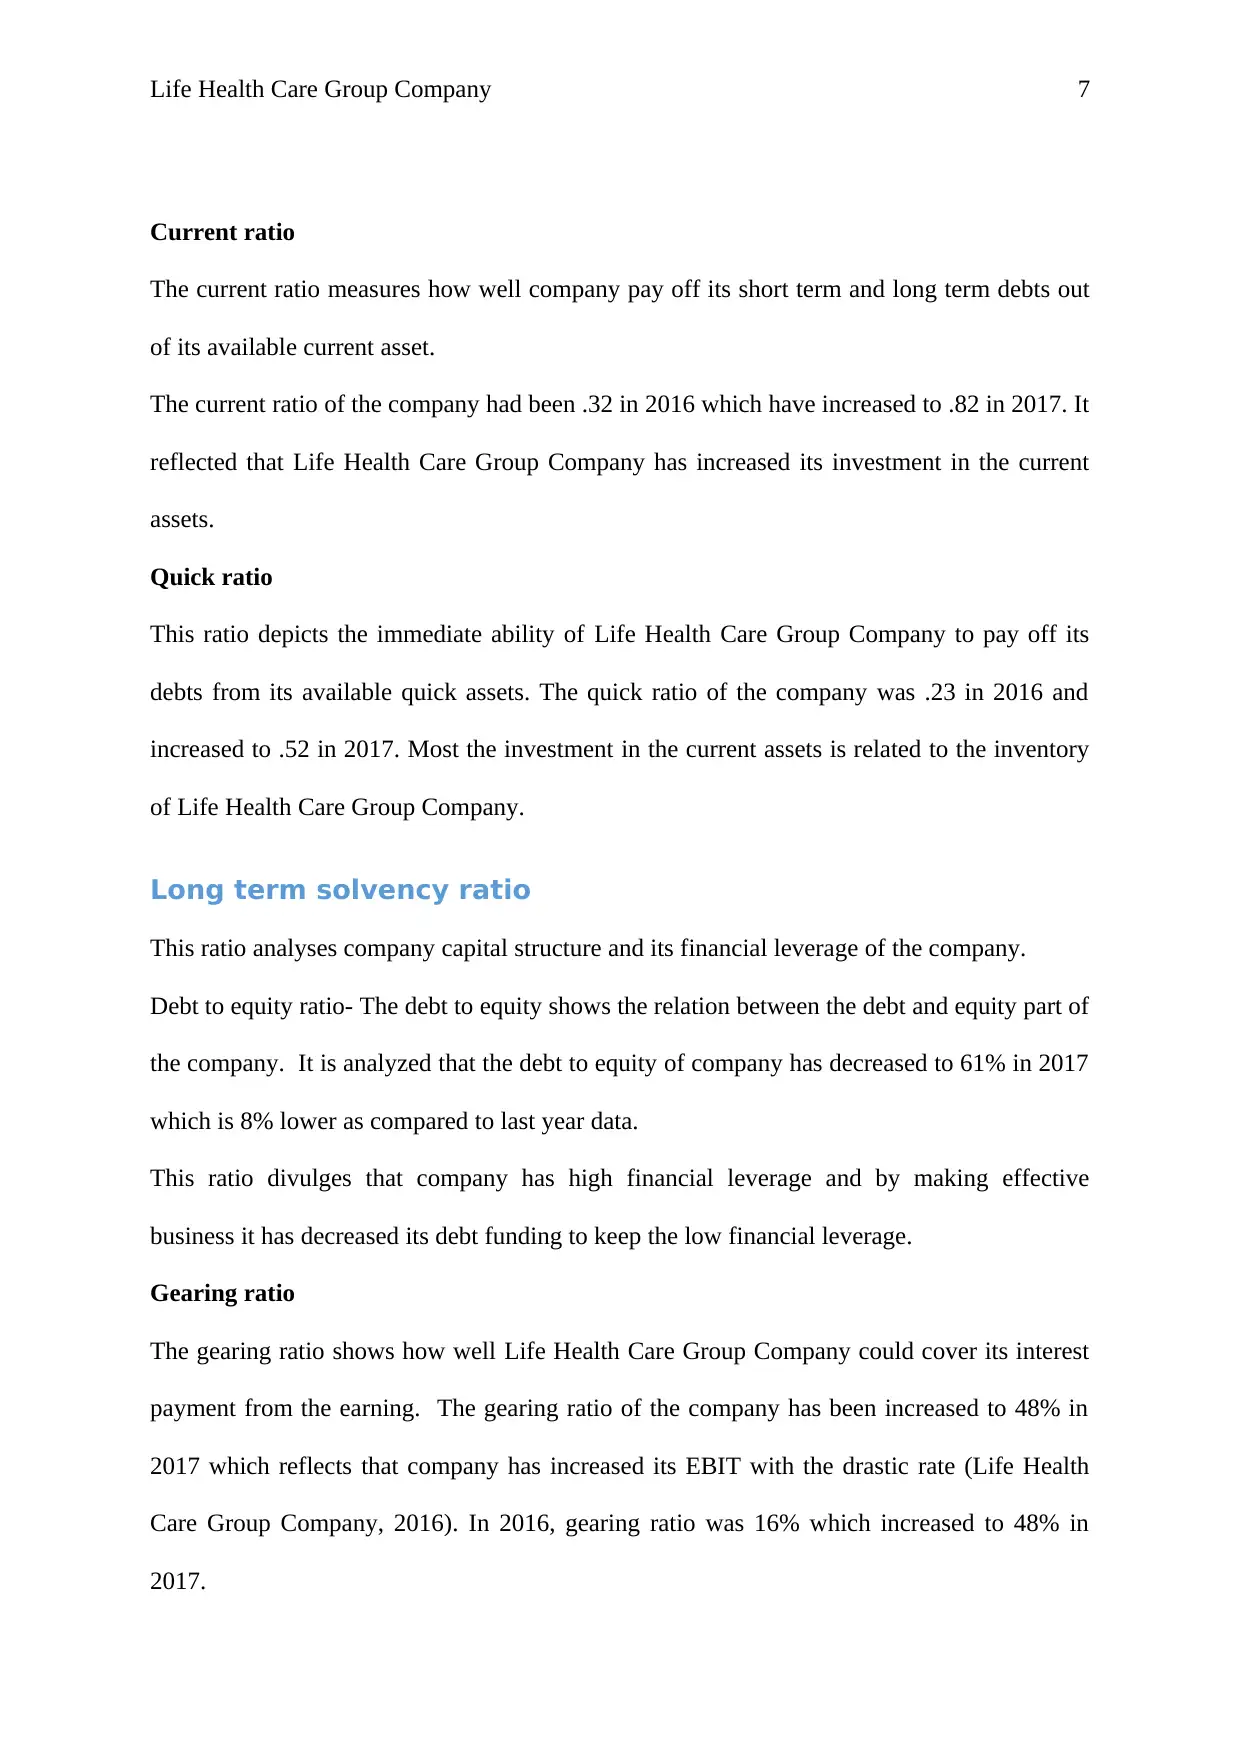
Current ratio
The current ratio measures how well company pay off its short term and long term debts out
of its available current asset.
The current ratio of the company had been .32 in 2016 which have increased to .82 in 2017. It
reflected that Life Health Care Group Company has increased its investment in the current
assets.
Quick ratio
This ratio depicts the immediate ability of Life Health Care Group Company to pay off its
debts from its available quick assets. The quick ratio of the company was .23 in 2016 and
increased to .52 in 2017. Most the investment in the current assets is related to the inventory
of Life Health Care Group Company.
Long term solvency ratio
This ratio analyses company capital structure and its financial leverage of the company.
Debt to equity ratio- The debt to equity shows the relation between the debt and equity part of
the company. It is analyzed that the debt to equity of company has decreased to 61% in 2017
which is 8% lower as compared to last year data.
This ratio divulges that company has high financial leverage and by making effective
business it has decreased its debt funding to keep the low financial leverage.
Gearing ratio
The gearing ratio shows how well Life Health Care Group Company could cover its interest
payment from the earning. The gearing ratio of the company has been increased to 48% in
2017 which reflects that company has increased its EBIT with the drastic rate (Life Health
Care Group Company, 2016). In 2016, gearing ratio was 16% which increased to 48% in
2017.
Paraphrase This Document
Need a fresh take? Get an instant paraphrase of this document with our AI Paraphraser
Life Health Care Group Company 8
Profitability ratio
The profitability ratio of the company shows its ability to create profit from its overall
turnover.
Return on assets
The return on assets of Life Health Care Group Company shows its assets ability to earn a
profit. The return on assets of Company has been decreasing since last three years. In 2017,
Life Health Care Group Company had 2% returns on equity which is 7% lower as compared
to last year data.
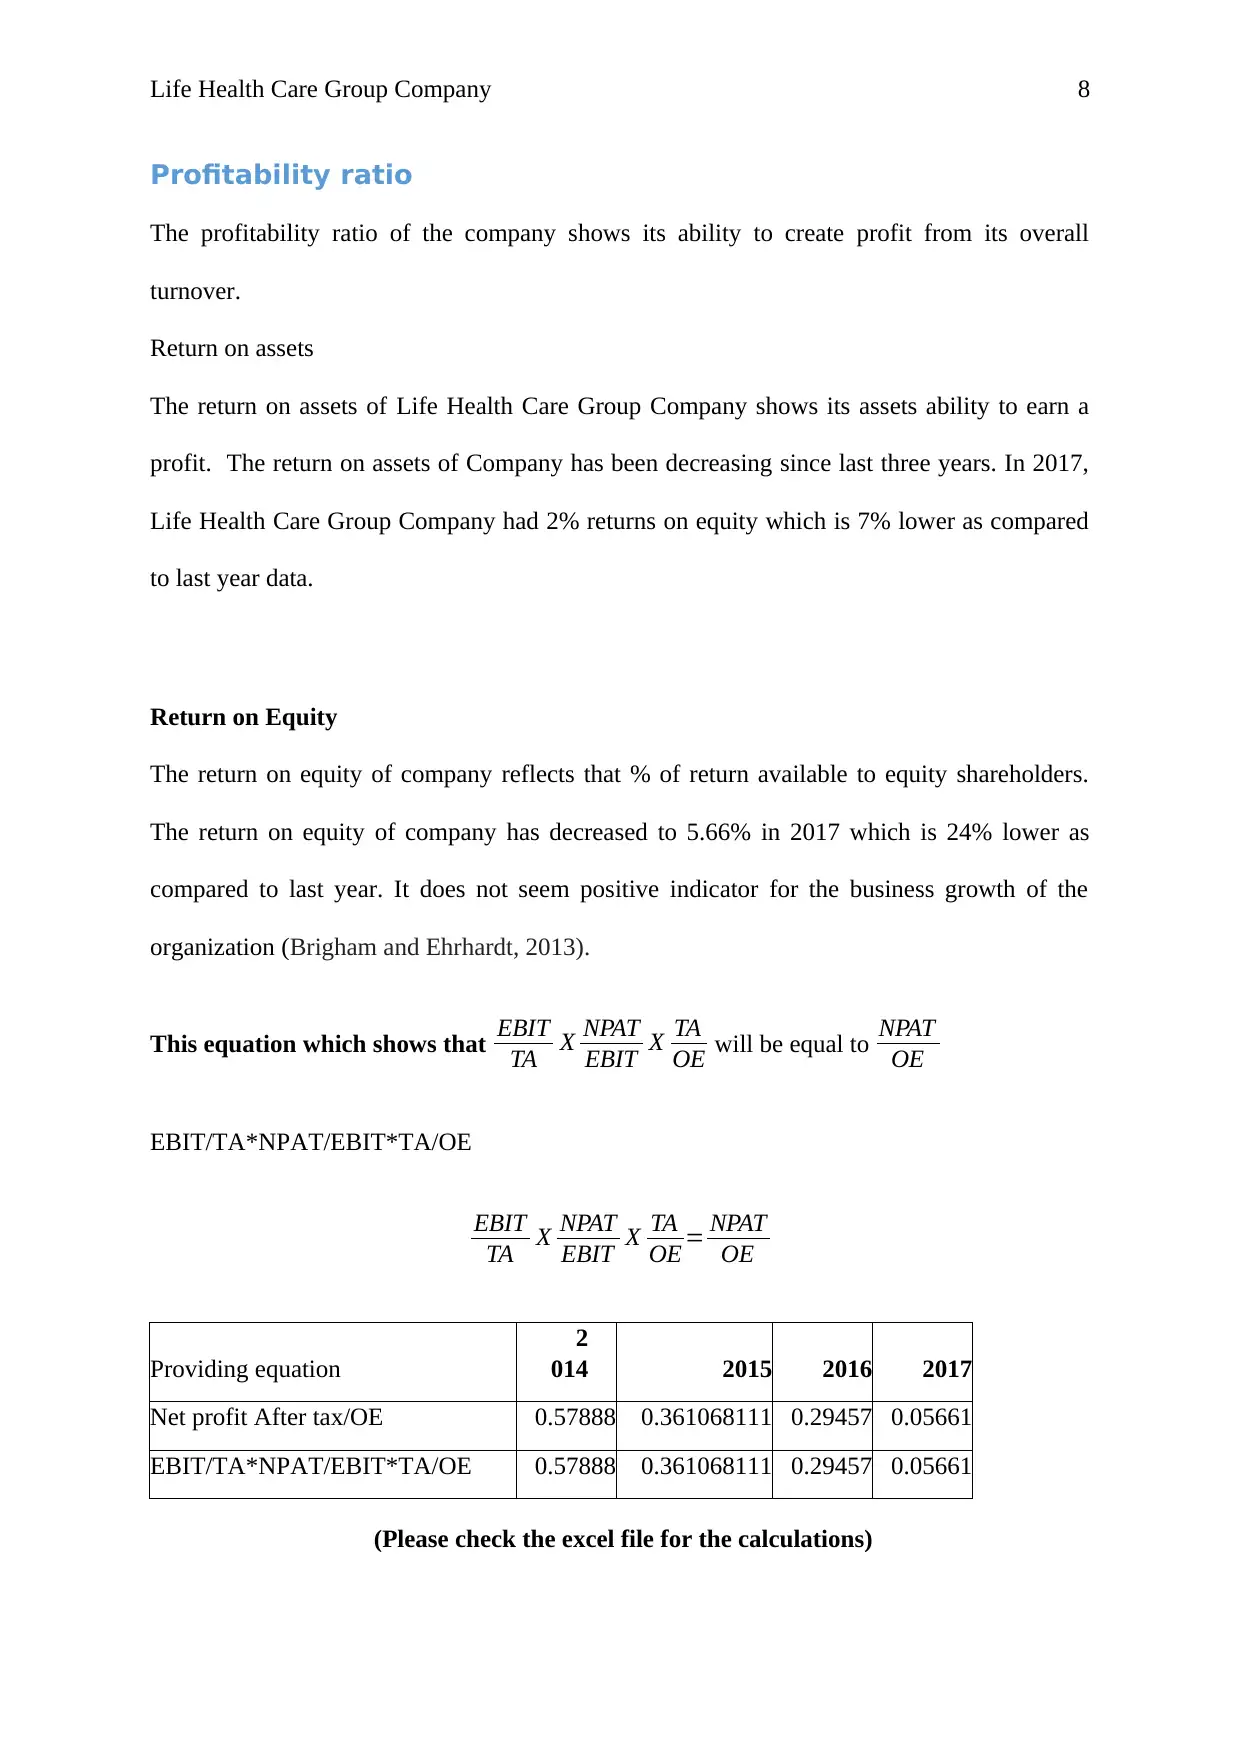
Return on Equity
The return on equity of company reflects that % of return available to equity shareholders.
The return on equity of company has decreased to 5.66% in 2017 which is 24% lower as
compared to last year. It does not seem positive indicator for the business growth of the
organization (Brigham and Ehrhardt, 2013).
This equation which shows that EBIT
TA X NPAT
EBIT X TA
OE will be equal to NPAT
OE
EBIT/TA*NPAT/EBIT*TA/OE
EBIT
TA X NPAT
EBIT X TA
OE = NPAT
OE
Providing equation
2
014 2015 2016 2017
Net profit After tax/OE 0.57888 0.361068111 0.29457 0.05661
EBIT/TA*NPAT/EBIT*TA/OE 0.57888 0.361068111 0.29457 0.05661
(Please check the excel file for the calculations)
Profitability ratio
The profitability ratio of the company shows its ability to create profit from its overall
turnover.
Return on assets
The return on assets of Life Health Care Group Company shows its assets ability to earn a
profit. The return on assets of Company has been decreasing since last three years. In 2017,
Life Health Care Group Company had 2% returns on equity which is 7% lower as compared
to last year data.
Return on Equity
The return on equity of company reflects that % of return available to equity shareholders.
The return on equity of company has decreased to 5.66% in 2017 which is 24% lower as
compared to last year. It does not seem positive indicator for the business growth of the
organization (Brigham and Ehrhardt, 2013).
This equation which shows that EBIT
TA X NPAT
EBIT X TA
OE will be equal to NPAT
OE
EBIT/TA*NPAT/EBIT*TA/OE
EBIT
TA X NPAT
EBIT X TA
OE = NPAT
OE
Providing equation
2
014 2015 2016 2017
Net profit After tax/OE 0.57888 0.361068111 0.29457 0.05661
EBIT/TA*NPAT/EBIT*TA/OE 0.57888 0.361068111 0.29457 0.05661
(Please check the excel file for the calculations)

Life Health Care Group Company 9
⊘ This is a preview!⊘
Do you want full access?
Subscribe today to unlock all pages.
Trusted by 1+ million students worldwide
Life Health Care Group Company 10
Market pay-out ratio
Price-earnings ratio
The price-earnings ratio of Company is .12 which is 10% higher as compared to last year
data.
Dividend payout ratio
The dividend payout ratio of the company is 27% in 2017 which is 12% higher as compared
to last year data.
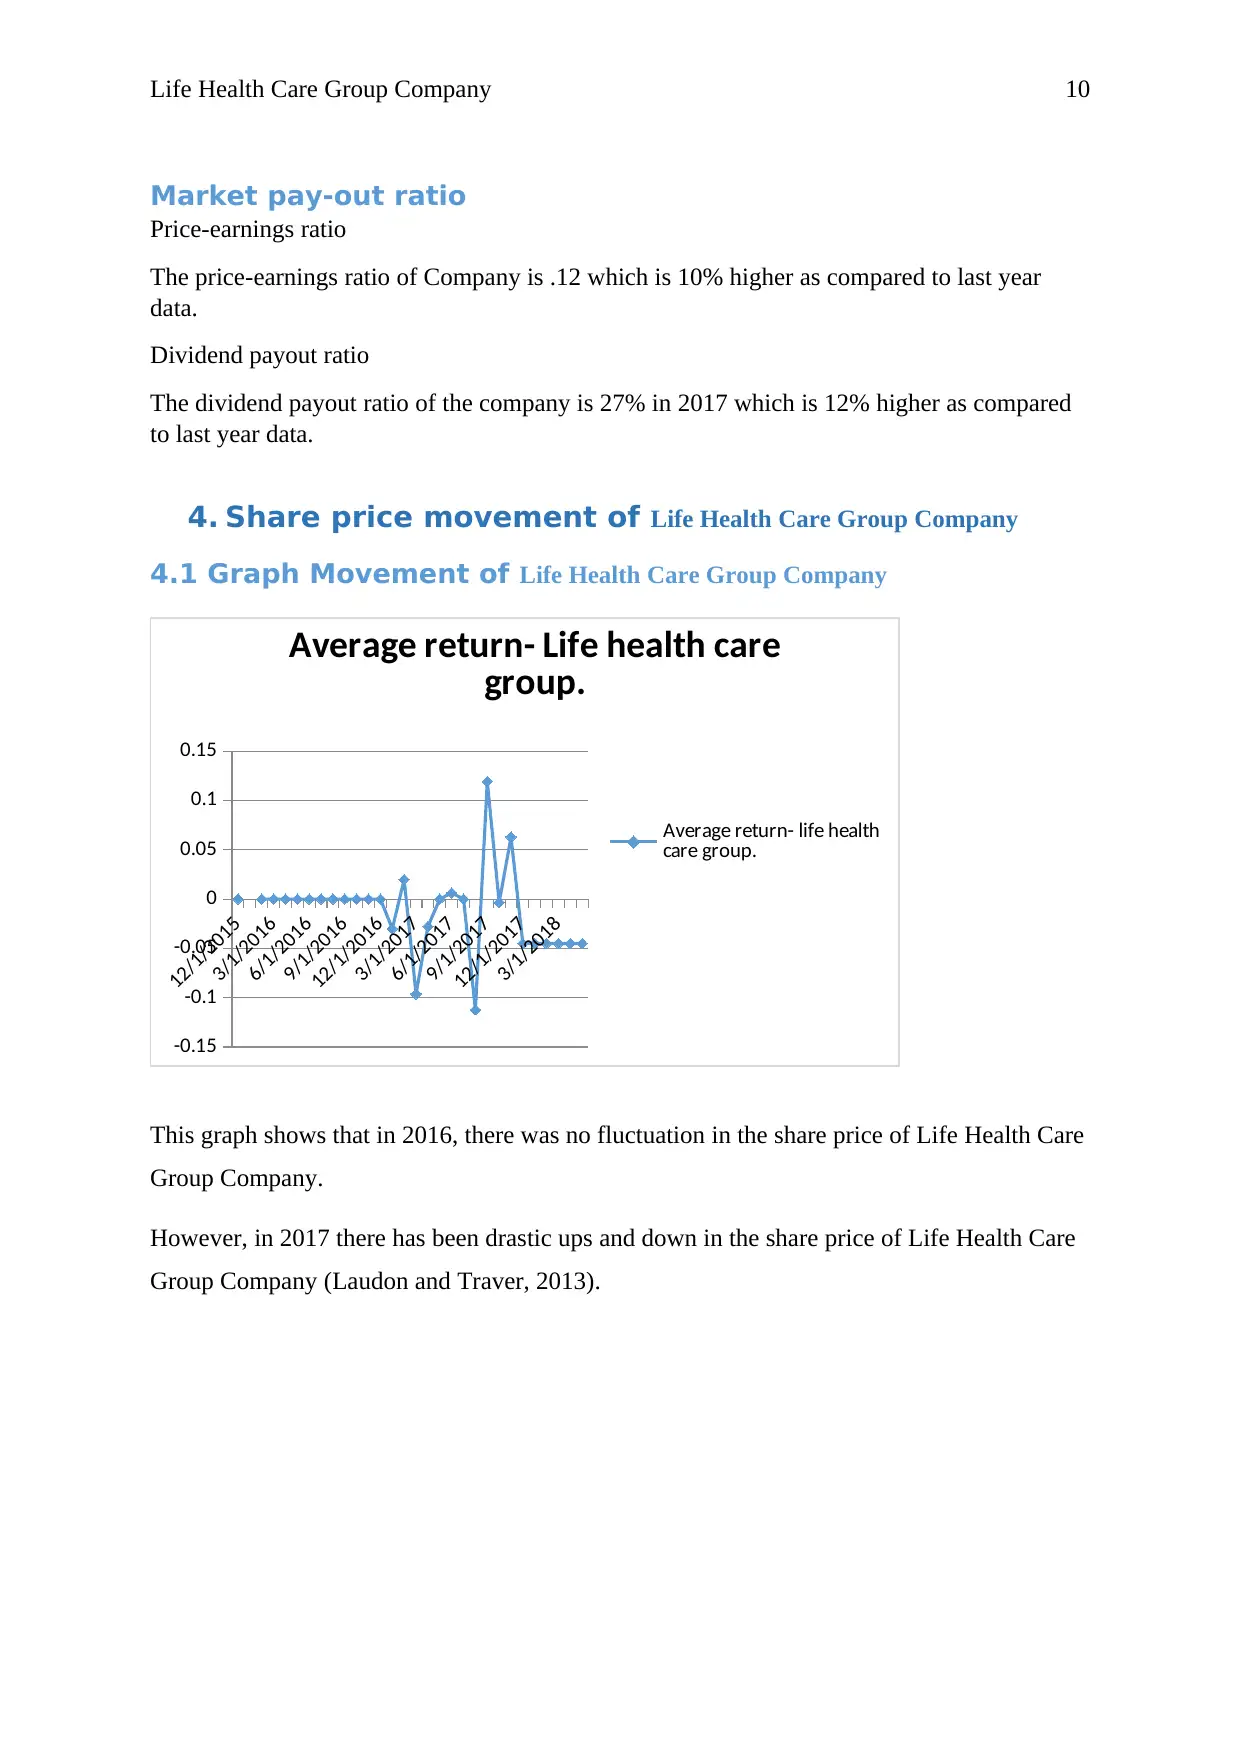
4. Share price movement of Life Health Care Group Company
4.1 Graph Movement of Life Health Care Group Company
12/1/2015
3/1/2016
6/1/2016
9/1/2016
12/1/2016
3/1/2017
6/1/2017
9/1/2017
12/1/2017
3/1/2018
-0.15
-0.1
-0.05
0
0.05
0.1
0.15
Average return- Life health care
group.
Average return- life health
care group.
This graph shows that in 2016, there was no fluctuation in the share price of Life Health Care
Group Company.
However, in 2017 there has been drastic ups and down in the share price of Life Health Care
Group Company (Laudon and Traver, 2013).
Market pay-out ratio
Price-earnings ratio
The price-earnings ratio of Company is .12 which is 10% higher as compared to last year
data.
Dividend payout ratio
The dividend payout ratio of the company is 27% in 2017 which is 12% higher as compared
to last year data.
4. Share price movement of Life Health Care Group Company
4.1 Graph Movement of Life Health Care Group Company
12/1/2015
3/1/2016
6/1/2016
9/1/2016
12/1/2016
3/1/2017
6/1/2017
9/1/2017
12/1/2017
3/1/2018
-0.15
-0.1
-0.05
0
0.05
0.1
0.15
Average return- Life health care
group.
Average return- life health
care group.
This graph shows that in 2016, there was no fluctuation in the share price of Life Health Care
Group Company.
However, in 2017 there has been drastic ups and down in the share price of Life Health Care
Group Company (Laudon and Traver, 2013).
Paraphrase This Document
Need a fresh take? Get an instant paraphrase of this document with our AI Paraphraser
Life Health Care Group Company 11
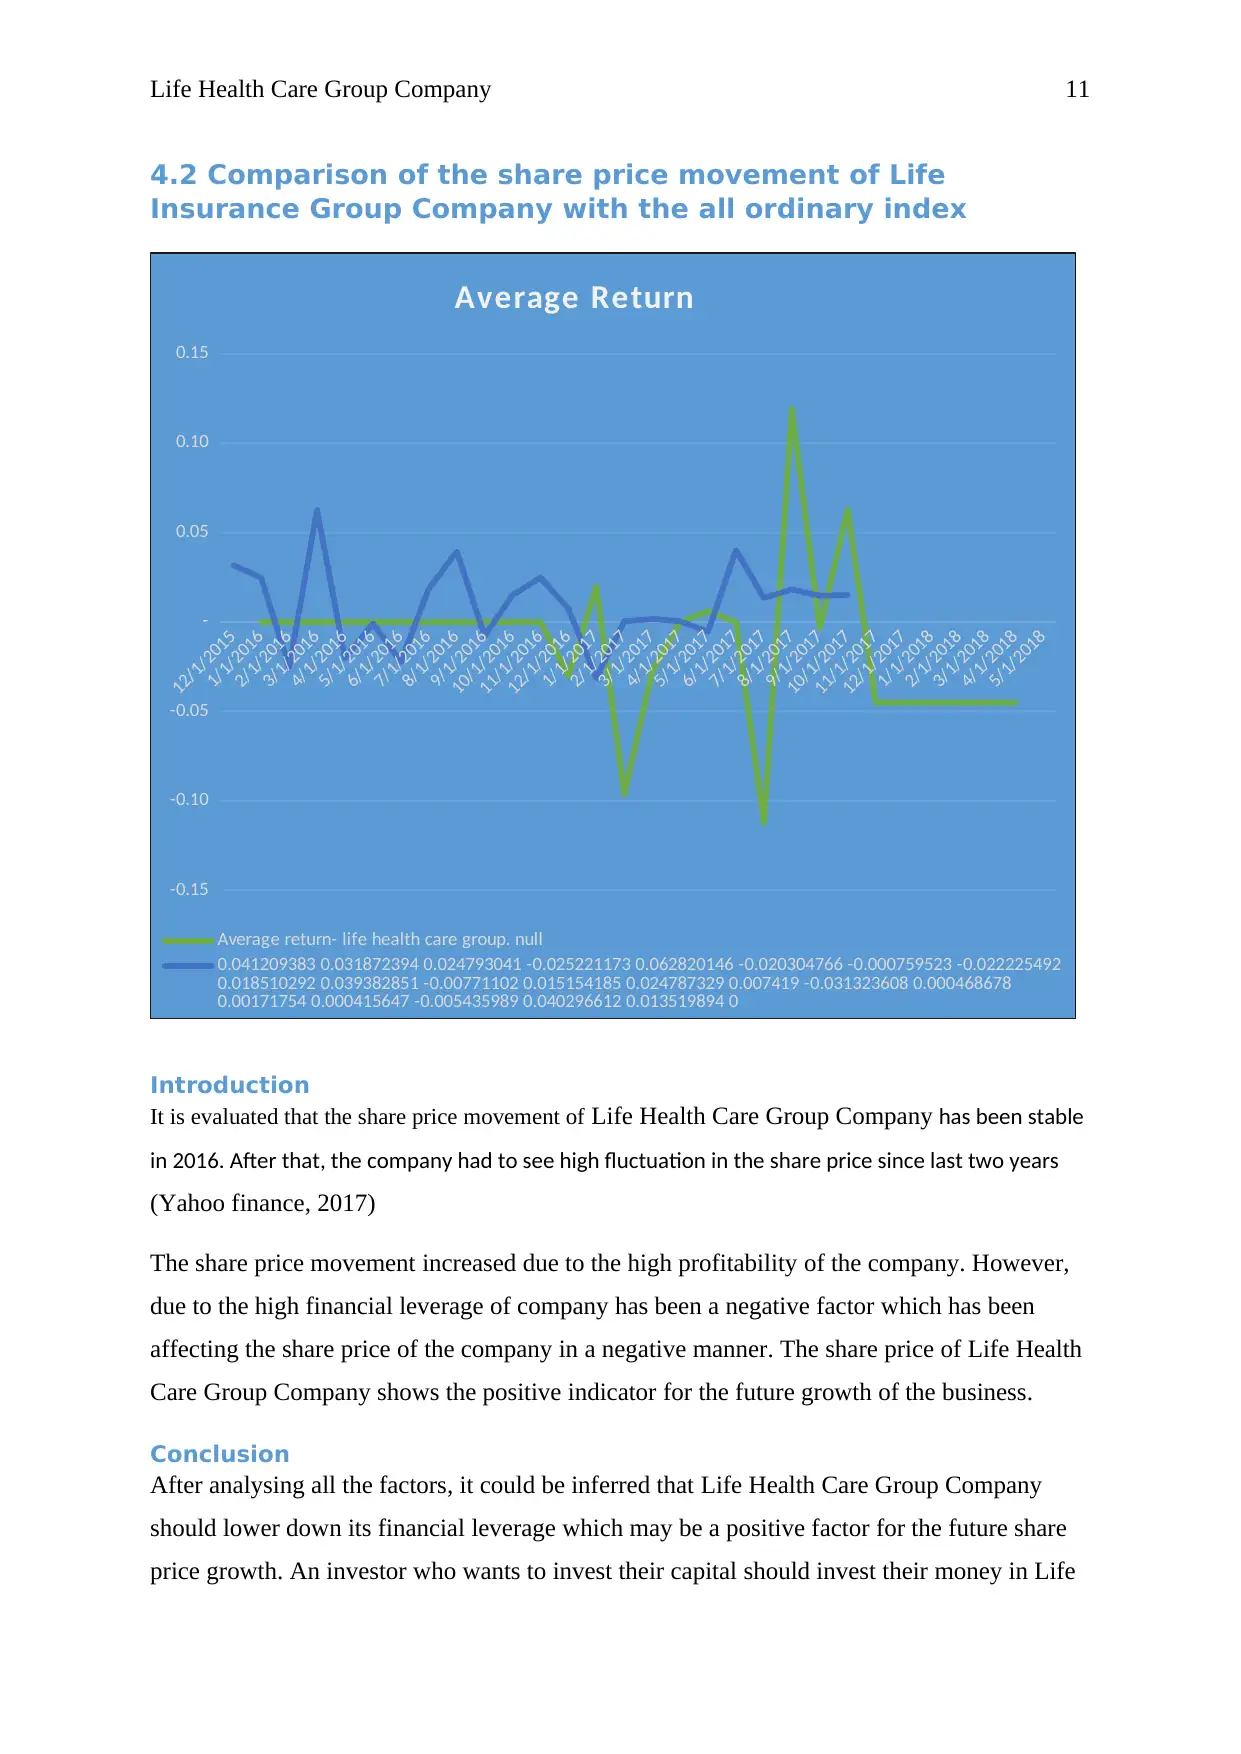
4.2 Comparison of the share price movement of Life
Insurance Group Company with the all ordinary index
12/1/2015
1/1/2016
2/1/2016
3/1/2016
4/1/2016
5/1/2016
6/1/2016
7/1/2016
8/1/2016
9/1/2016
10/1/2016
11/1/2016
12/1/2016
1/1/2017
2/1/2017
3/1/2017
4/1/2017
5/1/2017
6/1/2017
7/1/2017
8/1/2017
9/1/2017
10/1/2017
11/1/2017
12/1/2017
1/1/2018
2/1/2018
3/1/2018
4/1/2018
5/1/2018
-0.15
-0.10
-0.05
-
0.05
0.10
0.15
Average Return
Average return- life health care group. null
0.041209383 0.031872394 0.024793041 -0.025221173 0.062820146 -0.020304766 -0.000759523 -0.022225492
0.018510292 0.039382851 -0.00771102 0.015154185 0.024787329 0.007419 -0.031323608 0.000468678
0.00171754 0.000415647 -0.005435989 0.040296612 0.013519894 0
Introduction
It is evaluated that the share price movement of Life Health Care Group Company has been stable
in 2016. After that, the company had to see high fluctuation in the share price since last two years
(Yahoo finance, 2017)
The share price movement increased due to the high profitability of the company. However,
due to the high financial leverage of company has been a negative factor which has been
affecting the share price of the company in a negative manner. The share price of Life Health
Care Group Company shows the positive indicator for the future growth of the business.
Conclusion
After analysing all the factors, it could be inferred that Life Health Care Group Company
should lower down its financial leverage which may be a positive factor for the future share
price growth. An investor who wants to invest their capital should invest their money in Life
Life Health Care Group Company 12
Health Care Group Company for the long run only. Investing capital in Life Health Care
Group Company for short run will result in the destruction of business.
5. Announcements
There are several factors which have affected the share price of Life Health Care Group
Company.
1. Life Health Care Group Company invested AUD $ 1 million in its research and development
department.
2. The reduction in the return on capital employed will negatively impact the business growth
3. The company has planned to increase the employee’s strength by hiring more 100 employees.
4. The investment of Life Health Care Group Company has been high for the use of technologies
and system process which may increase the overall outcomes of business.
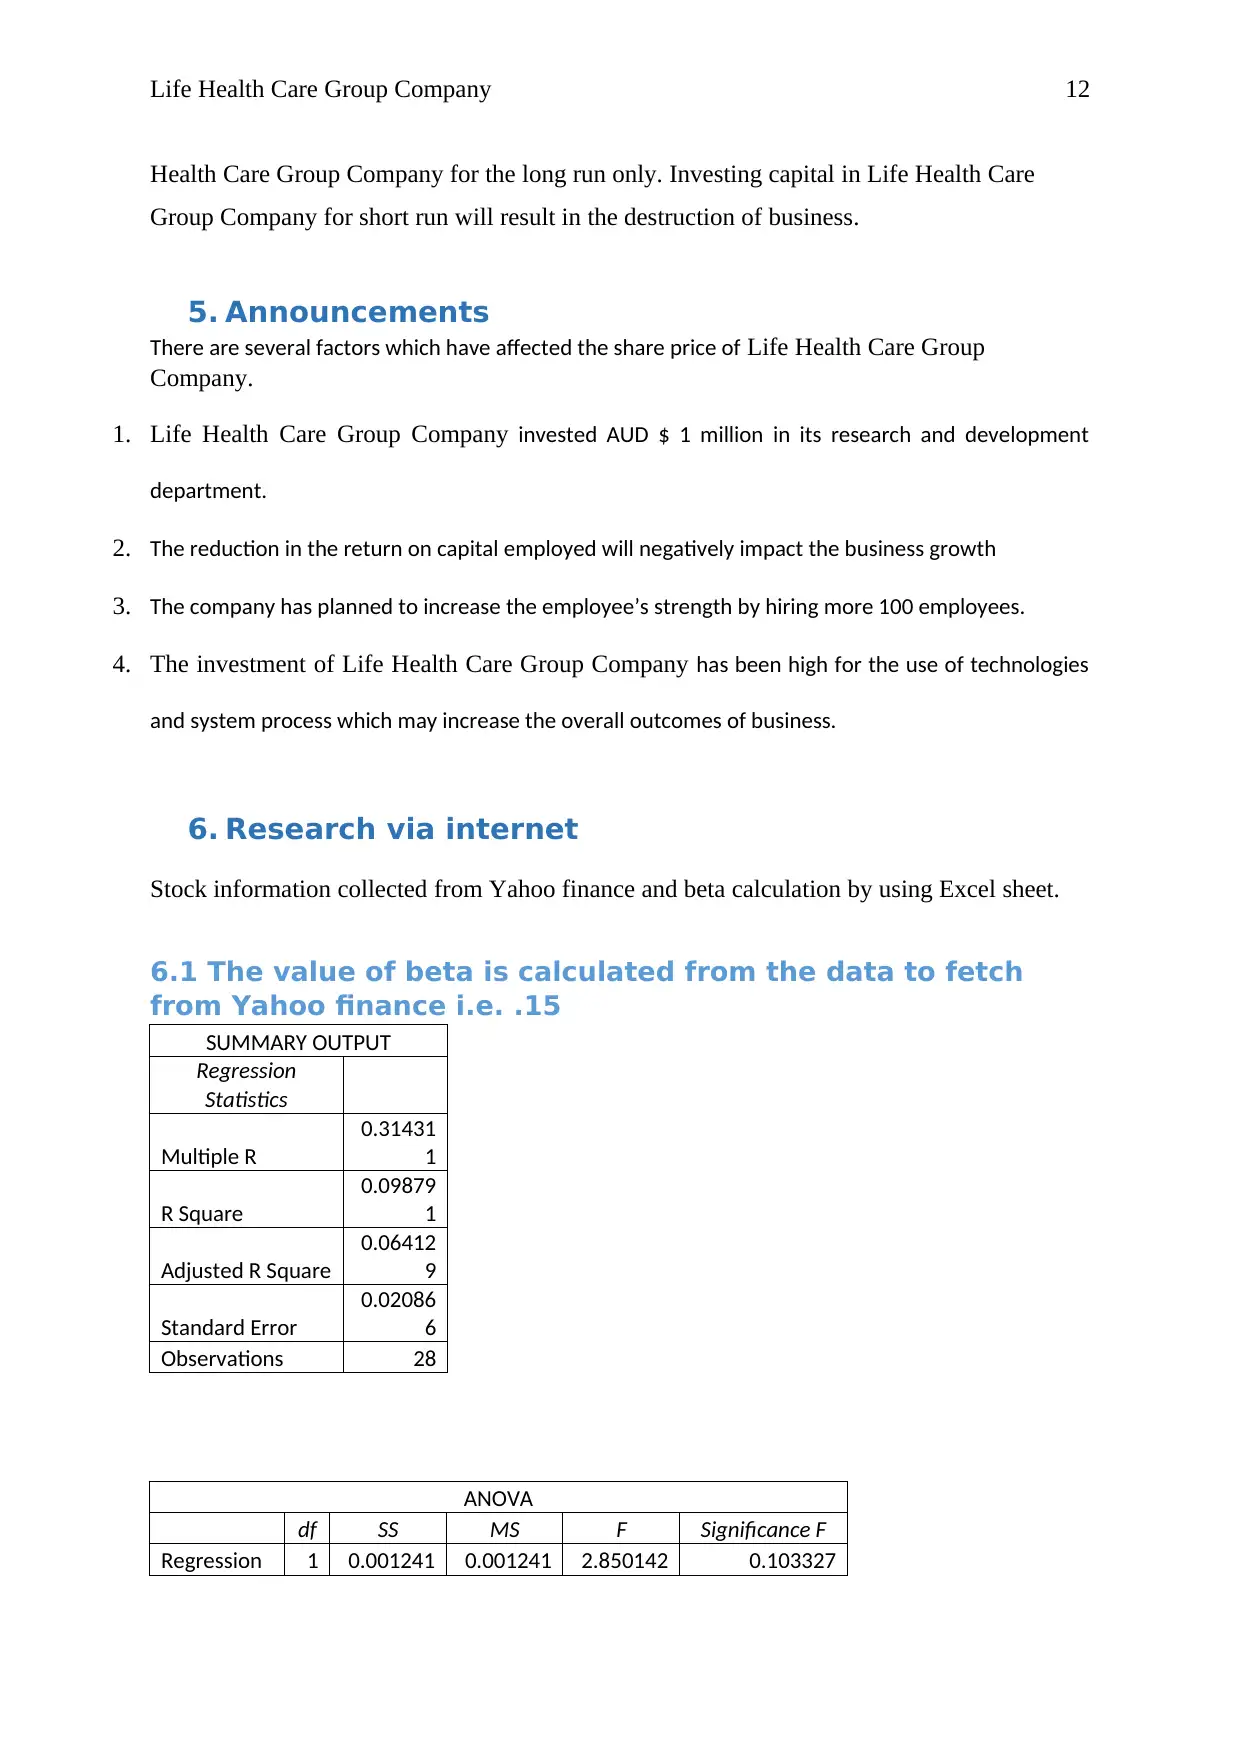
6. Research via internet
Stock information collected from Yahoo finance and beta calculation by using Excel sheet.
6.1 The value of beta is calculated from the data to fetch
from Yahoo finance i.e. .15
SUMMARY OUTPUT
Regression
Statistics
Multiple R
0.31431
1
R Square
0.09879
1
Adjusted R Square
0.06412
9
Standard Error
0.02086
6
Observations 28
ANOVA
df SS MS F Significance F
Regression 1 0.001241 0.001241 2.850142 0.103327
Health Care Group Company for the long run only. Investing capital in Life Health Care
Group Company for short run will result in the destruction of business.
5. Announcements
There are several factors which have affected the share price of Life Health Care Group
Company.
1. Life Health Care Group Company invested AUD $ 1 million in its research and development
department.
2. The reduction in the return on capital employed will negatively impact the business growth
3. The company has planned to increase the employee’s strength by hiring more 100 employees.
4. The investment of Life Health Care Group Company has been high for the use of technologies
and system process which may increase the overall outcomes of business.
6. Research via internet
Stock information collected from Yahoo finance and beta calculation by using Excel sheet.
6.1 The value of beta is calculated from the data to fetch
from Yahoo finance i.e. .15
SUMMARY OUTPUT
Regression
Statistics
Multiple R
0.31431
1
R Square
0.09879
1
Adjusted R Square
0.06412
9
Standard Error
0.02086
6
Observations 28
ANOVA
df SS MS F Significance F
Regression 1 0.001241 0.001241 2.850142 0.103327
⊘ This is a preview!⊘
Do you want full access?
Subscribe today to unlock all pages.
Trusted by 1+ million students worldwide
1 out of 23
Related Documents


Your All-in-One AI-Powered Toolkit for Academic Success.
+13062052269
info@desklib.com
Available 24*7 on WhatsApp / Email
![[object Object]](/_next/static/media/star-bottom.7253800d.svg)
Unlock your academic potential
Copyright © 2020–2026 A2Z Services. All Rights Reserved. Developed and managed by ZUCOL.