JCU BX2014 Financial Management Report: Origin Energy Analysis

Verified

Added on  2022/11/01

|8
|1369
|104
Report
AI Summary
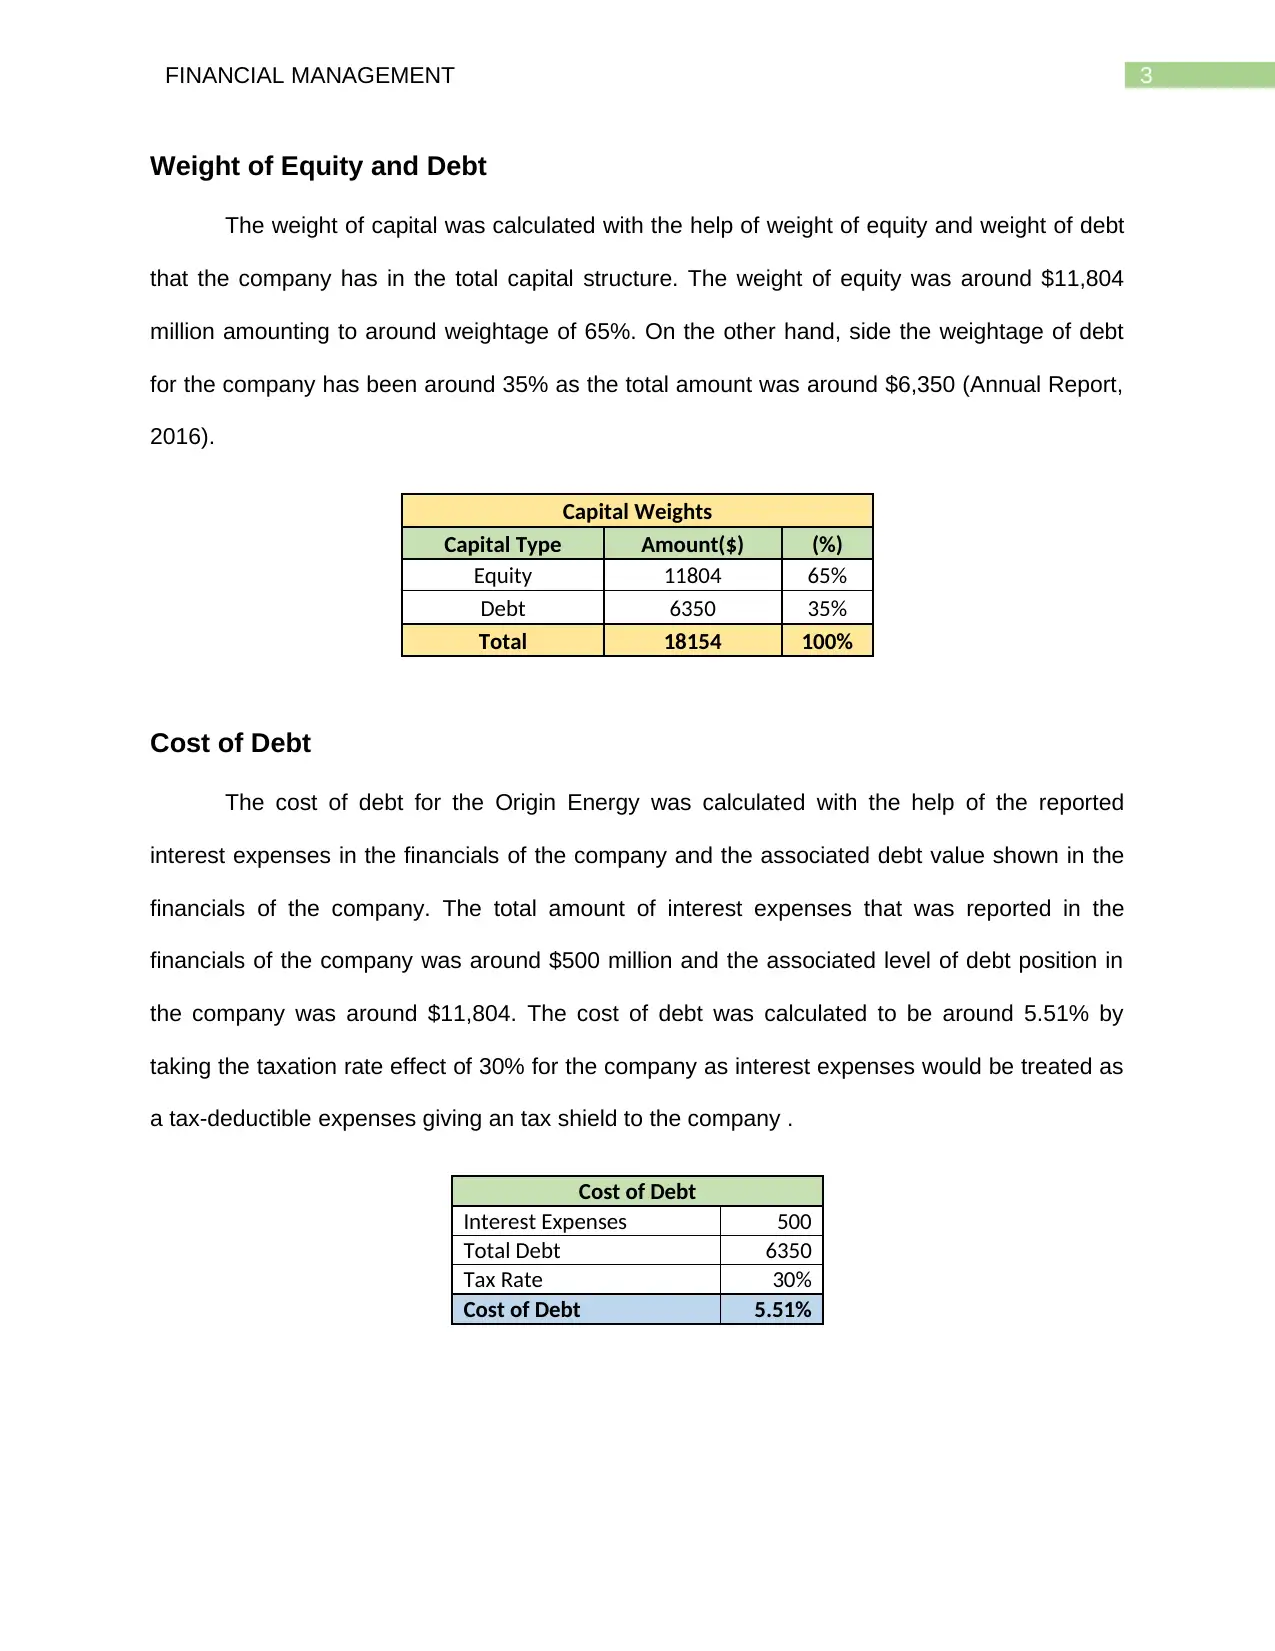
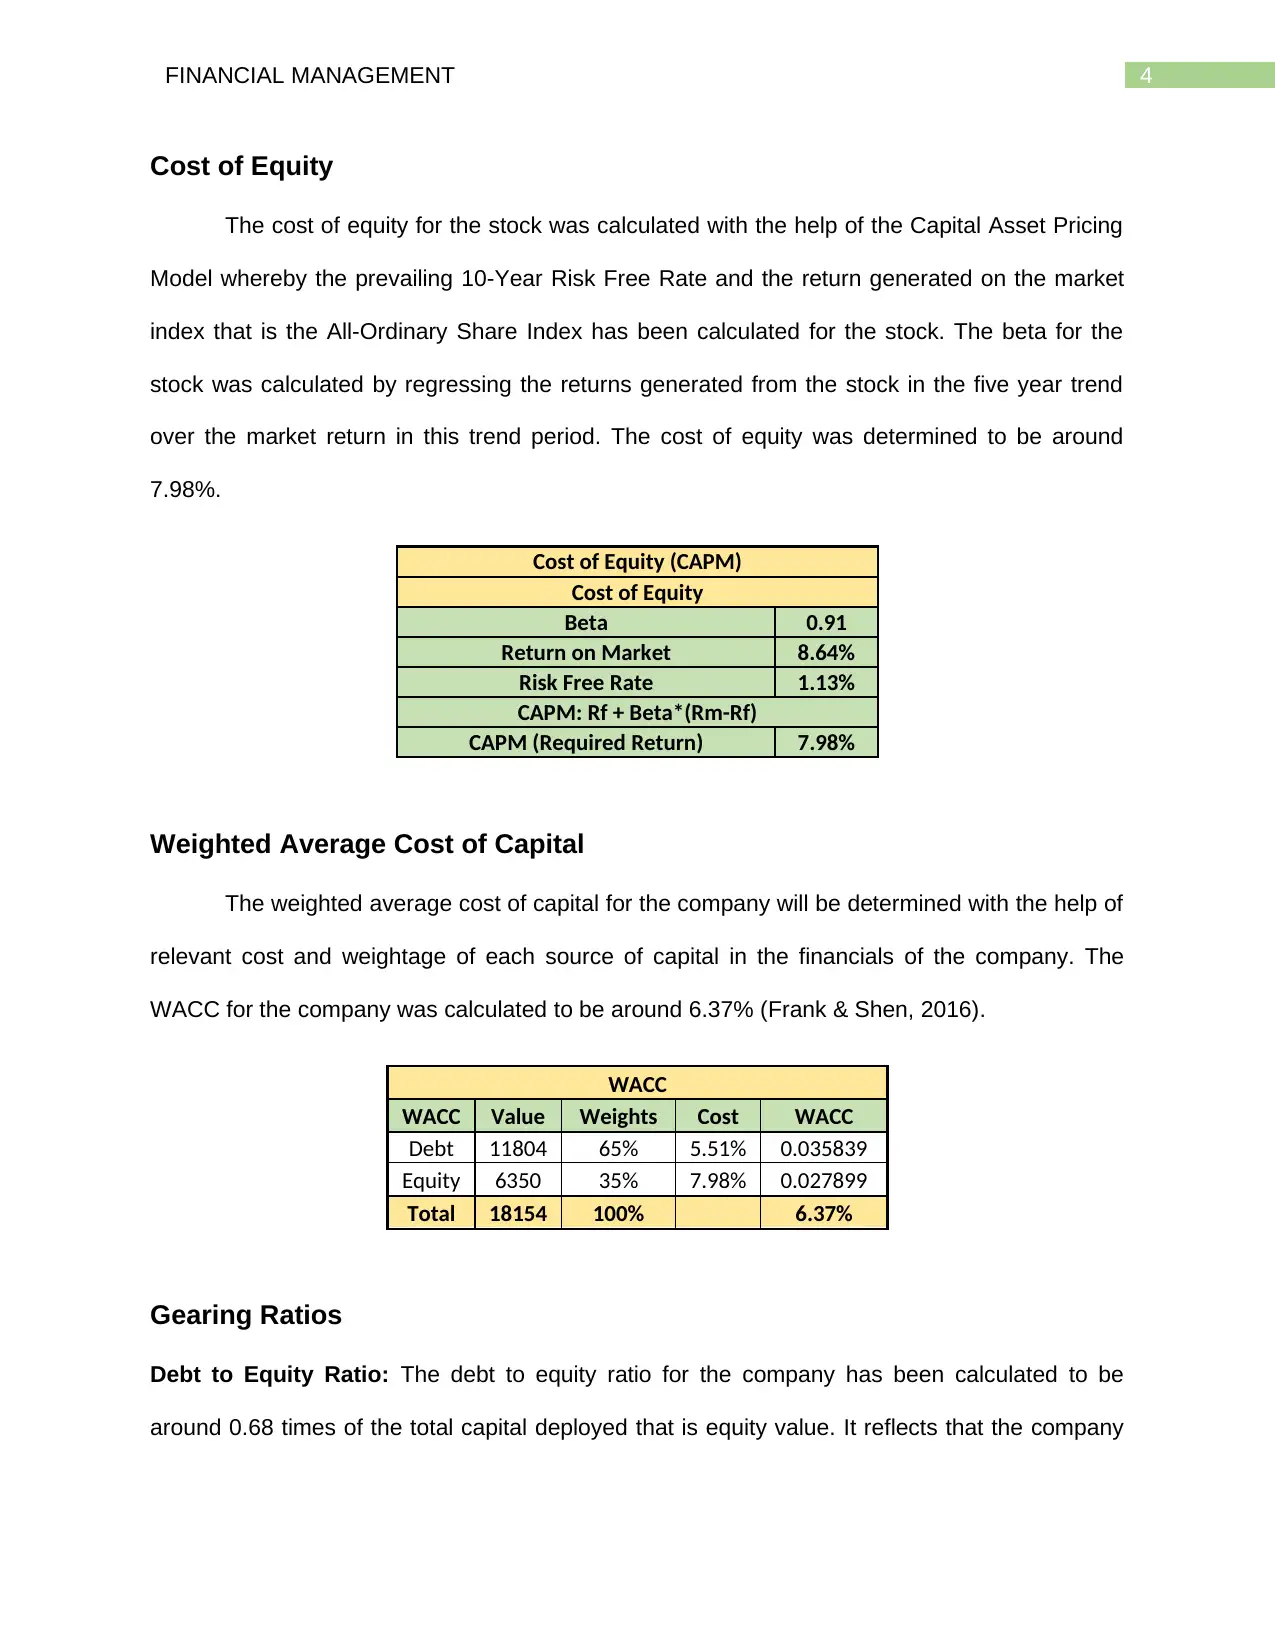
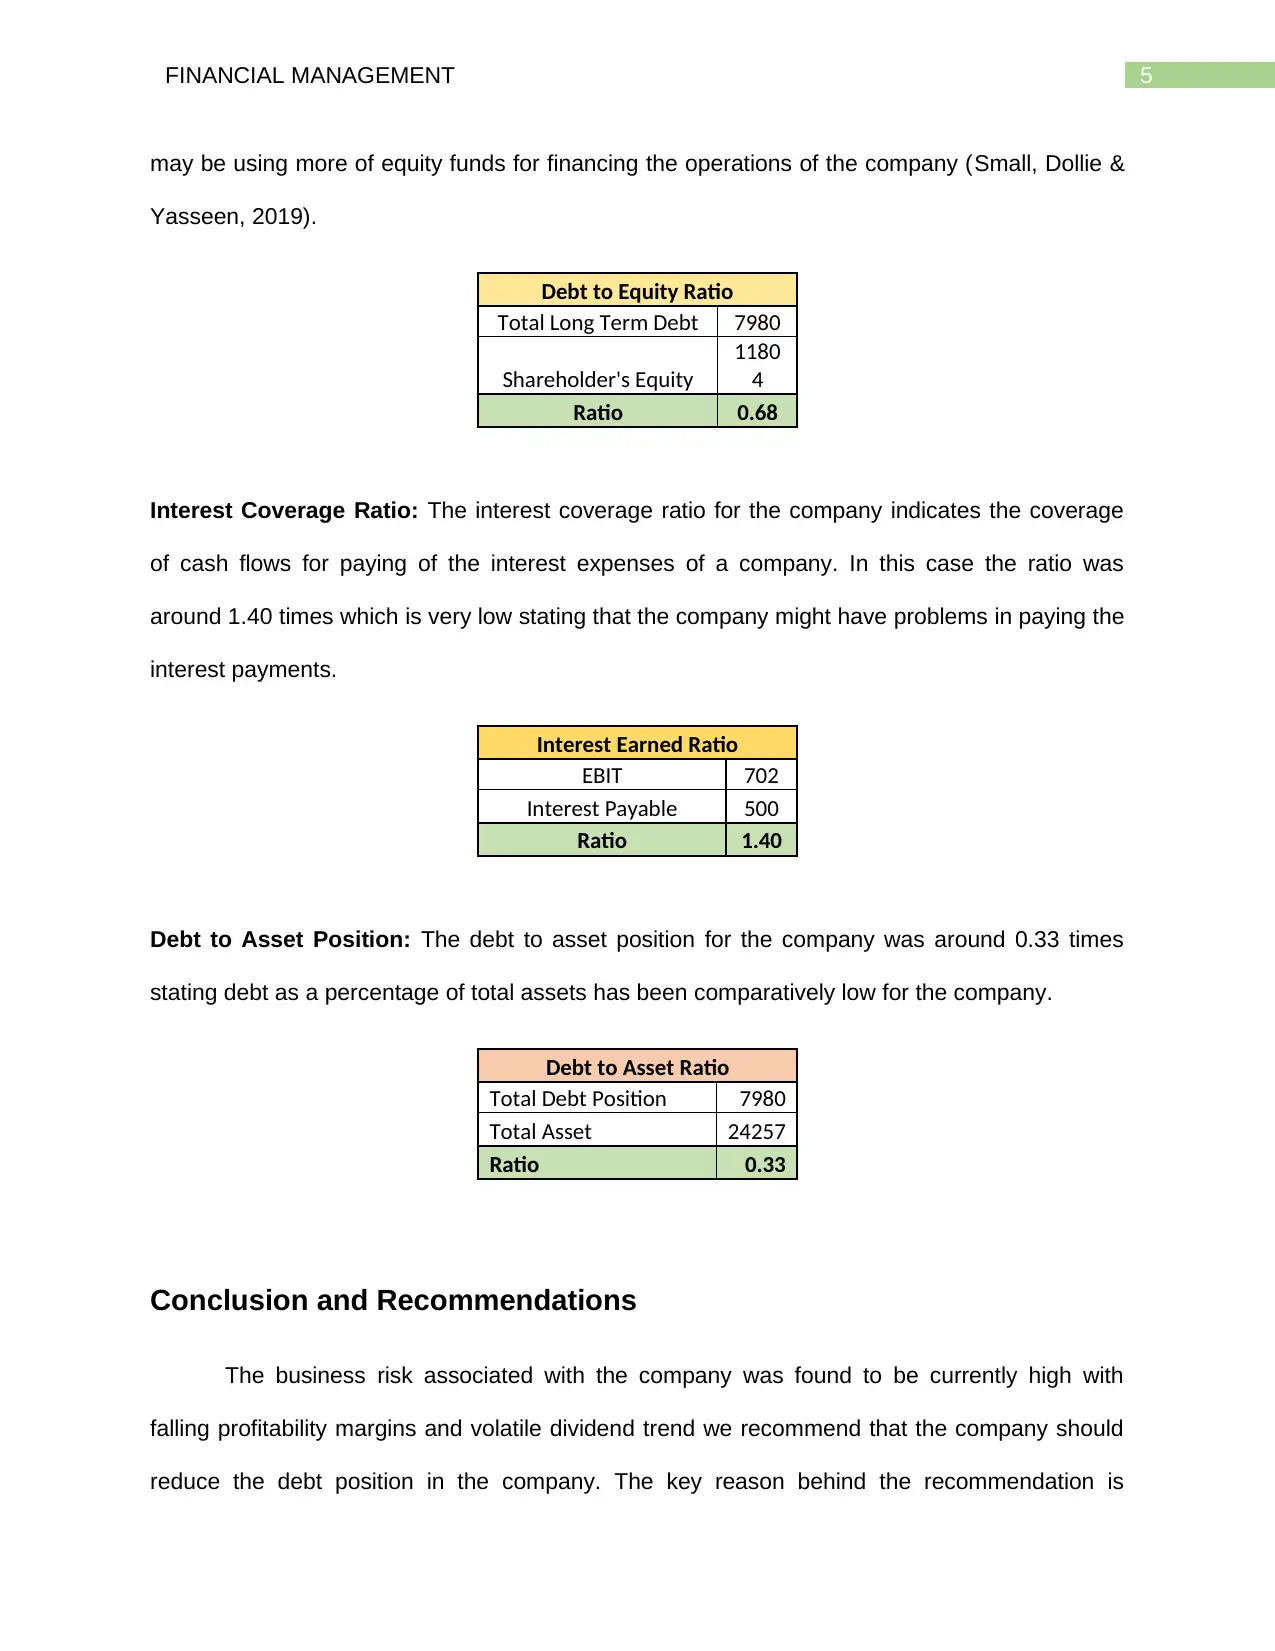
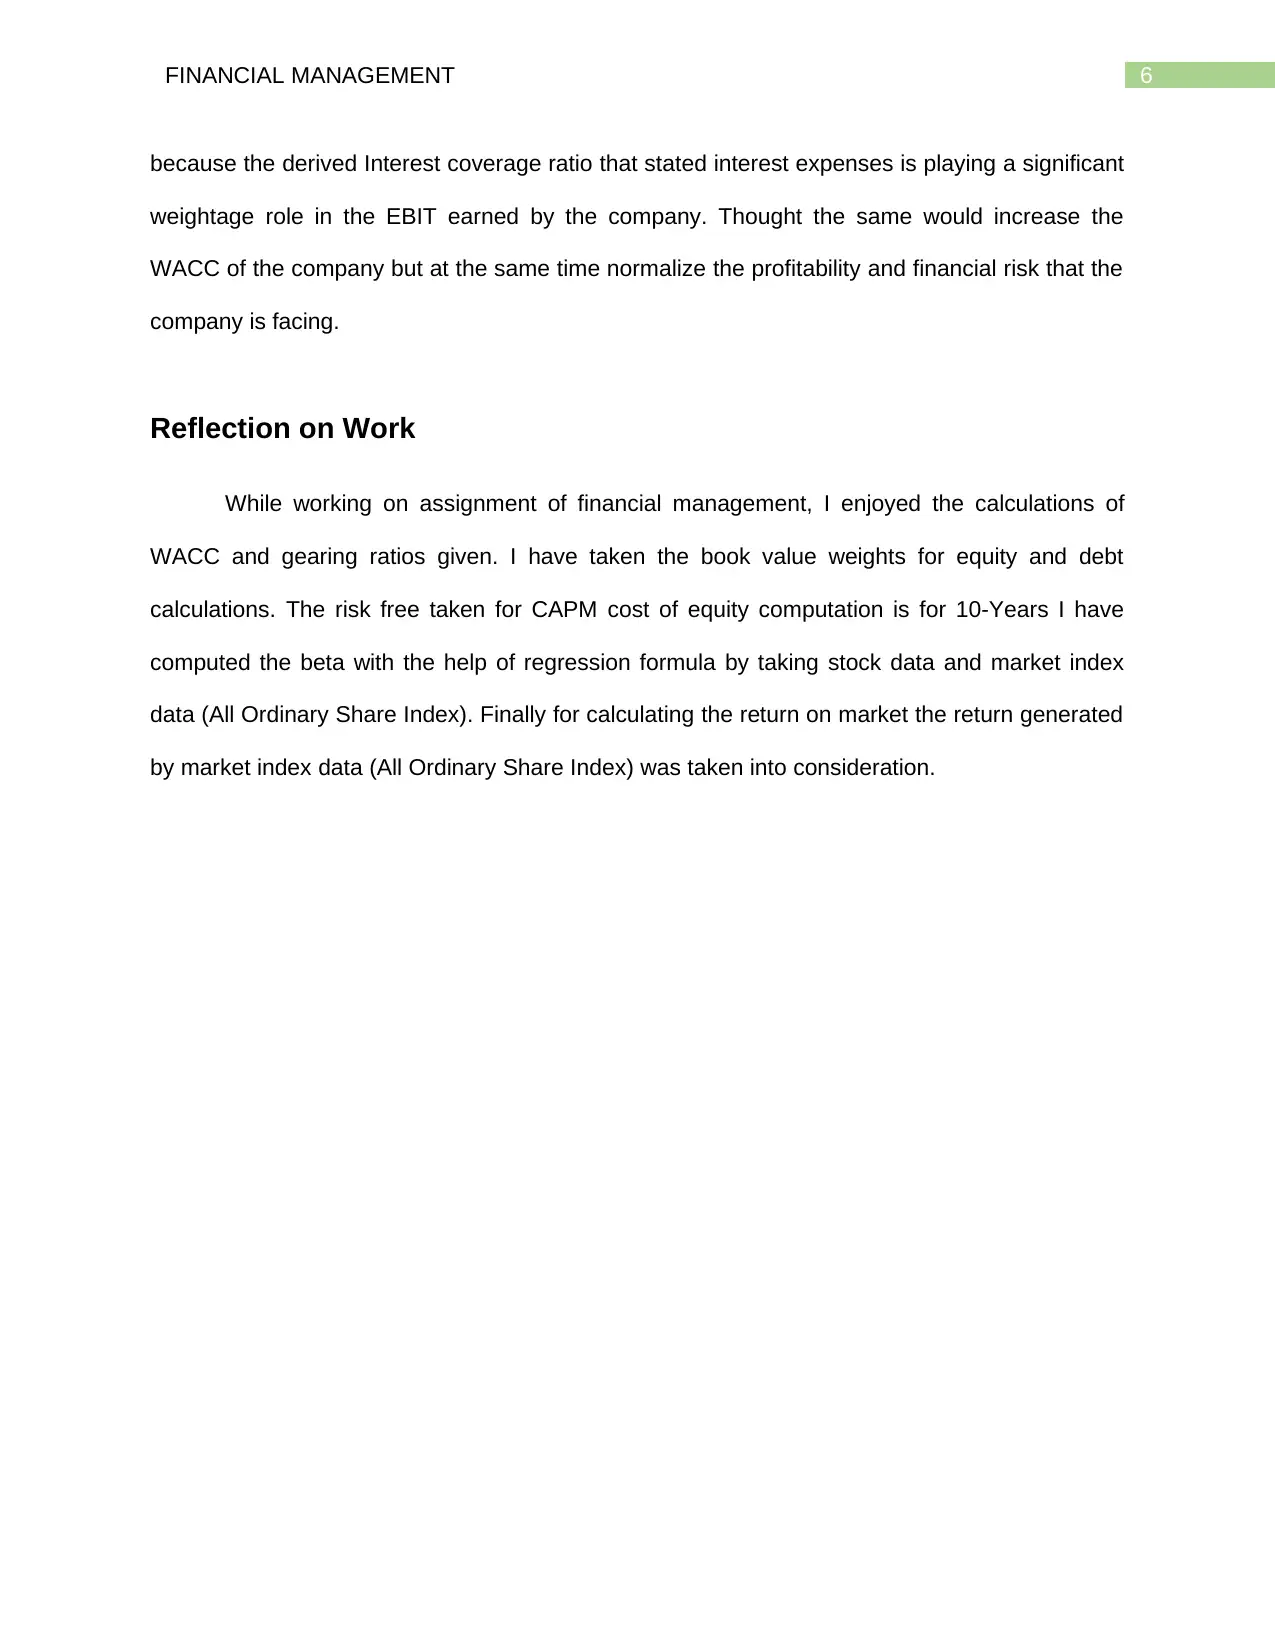
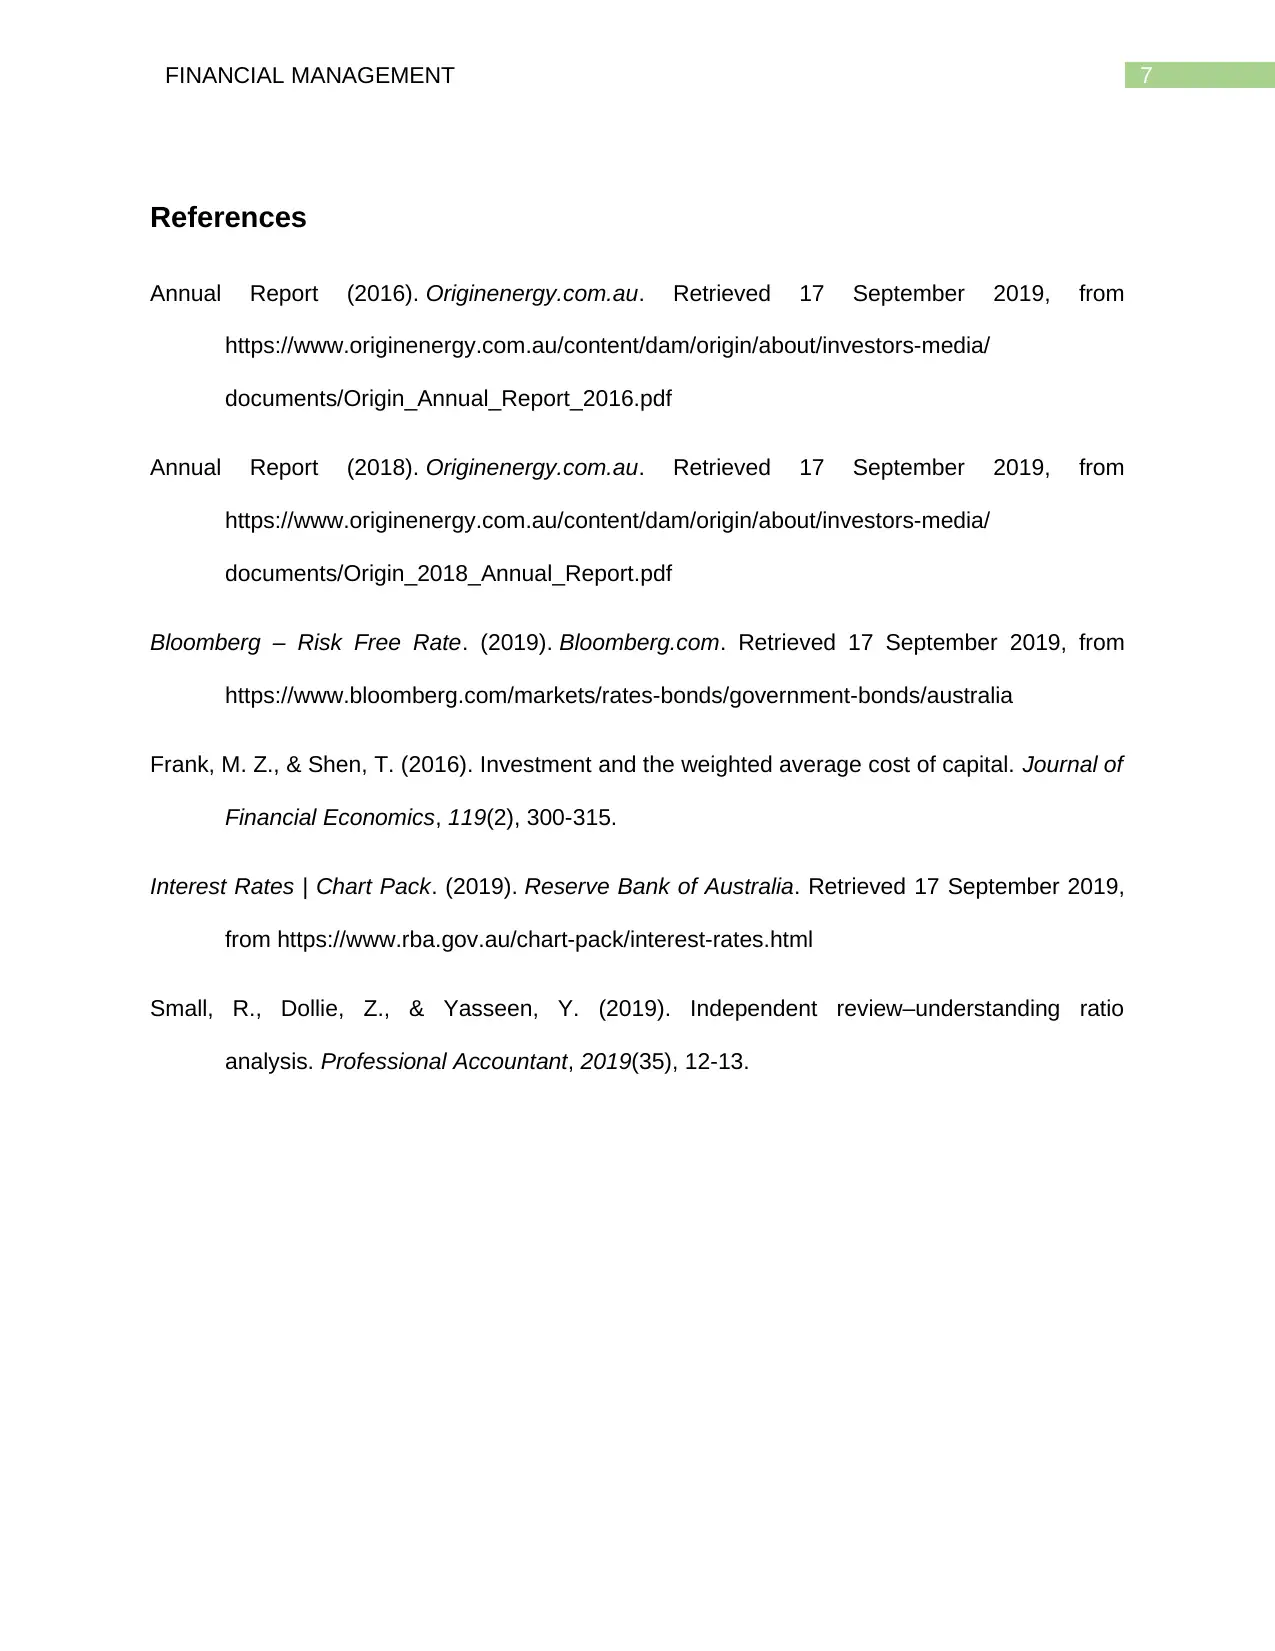
This financial report analyzes Origin Energy, an Australian energy company. It calculates the company's Weighted Average Cost of Capital (WACC), incorporating the cost of debt and equity, determined using CAPM and the Dividend Growth Model (DGM). The report also examines gearing ratios, including debt-to-equity, return on capital employed, and debt-to-asset ratios, to assess the company's financial leverage and risk. The analysis includes the beta of the stock, the current risk-free rate, and the weights of equity and debt in the capital structure. Based on the financial analysis, recommendations regarding the company's capital structure are provided, with a focus on reducing debt to mitigate financial risk. The report concludes with a reflection on the work and a list of references.
tabler-icon-diamond-filled.svg

Contribute Materials

Your contribution can guide someone’s learning journey. Share your documents today.
Document Page
Running head: FINANCIAL MANAGEMENT
Financial Management
Name of the Student:
Name of the University:
Author’s Note:
tabler-icon-diamond-filled.svg

Secure Best Marks with AI Grader

Need help grading? Try our AI Grader for instant feedback on your assignments.
Document Page
1FINANCIAL MANAGEMENT
Table of Contents
Introduction.................................................................................................................................. 2
Discussion and Analysis.............................................................................................................. 2
Beta and Current Risk Free Rate.............................................................................................2
Weight of Equity and Debt........................................................................................................3
Cost of Debt............................................................................................................................. 3
Cost of Equity........................................................................................................................... 4
Weighted Average Cost of Capital...........................................................................................4
Gearing Ratios......................................................................................................................... 4
Conclusion and Recommendations.............................................................................................5
Reflection on Work...................................................................................................................... 6
References.................................................................................................................................. 7
Document Page
2FINANCIAL MANAGEMENT
Introduction
Origin Energy is an Australian listed public energy company having its headquarter in
Sydney, Australia. The key products and services that is offered by the company belongs in
electricity, natural gas and LPG sections. The Origin Energy Company operates as one of the
biggest power generation portfolio that is having a capacity of around 6,010 MW of capacity.
The company is listed and traded in the “Australian Stock Exchange” with the trading symbol
ORG”. The financial analysis of the company has been specifically done in the field of the beta
value of the company and the respective market return generated by the stock for the current
period time. The weighted average cost of capital for the company was calculated for the stock
with the help of appropriate weights and cost of each source of capital deployed (Annual Report,
2018). The cost of equity for the company on the other hand, was calculated with the help of the
Capital Asset pricing Model. Further the gearing ratio’s was also calculated for the stock by the
help of the debt and equity position in the company and the respective recommendation were
provided to the board regarding the adequate capital structure that should be adhered by the
company.
Discussion and Analysis
Beta and Current Risk Free Rate
The beta of the Origin Energy Stock was calculated with the help of regressing the stock
returns over the market index which is All for the stock (Bloomberg – Risk Free Rate, 2019).
The beta for the stock was calculated to be around 0.91 times and the current risk free rate
taken for the purpose of analysis is the 10-Year Government Bond Yield that is around 1.13%
(Interest Rates | Chart Pack, 2019).
Document Page
3FINANCIAL MANAGEMENT
Weight of Equity and Debt
The weight of capital was calculated with the help of weight of equity and weight of debt
that the company has in the total capital structure. The weight of equity was around $11,804
million amounting to around weightage of 65%. On the other hand, side the weightage of debt
for the company has been around 35% as the total amount was around $6,350 (Annual Report,
2016).
Capital Weights
Capital Type Amount($) (%)
Equity 11804 65%
Debt 6350 35%
Total 18154 100%
Cost of Debt
The cost of debt for the Origin Energy was calculated with the help of the reported
interest expenses in the financials of the company and the associated debt value shown in the
financials of the company. The total amount of interest expenses that was reported in the
financials of the company was around $500 million and the associated level of debt position in
the company was around $11,804. The cost of debt was calculated to be around 5.51% by
taking the taxation rate effect of 30% for the company as interest expenses would be treated as
a tax-deductible expenses giving an tax shield to the company .
Cost of Debt
Interest Expenses 500
Total Debt 6350
Tax Rate 30%
Cost of Debt 5.51%
tabler-icon-diamond-filled.svg

Secure Best Marks with AI Grader

Need help grading? Try our AI Grader for instant feedback on your assignments.
Document Page
4FINANCIAL MANAGEMENT
Cost of Equity
The cost of equity for the stock was calculated with the help of the Capital Asset Pricing
Model whereby the prevailing 10-Year Risk Free Rate and the return generated on the market
index that is the All-Ordinary Share Index has been calculated for the stock. The beta for the
stock was calculated by regressing the returns generated from the stock in the five year trend
over the market return in this trend period. The cost of equity was determined to be around
7.98%.
Cost of Equity (CAPM)
Cost of Equity
Beta 0.91
Return on Market 8.64%
Risk Free Rate 1.13%
CAPM: Rf + Beta*(Rm-Rf)
CAPM (Required Return) 7.98%
Weighted Average Cost of Capital
The weighted average cost of capital for the company will be determined with the help of
relevant cost and weightage of each source of capital in the financials of the company. The
WACC for the company was calculated to be around 6.37% (Frank & Shen, 2016).
WACC
WACC Value Weights Cost WACC
Debt 11804 65% 5.51% 0.035839
Equity 6350 35% 7.98% 0.027899
Total 18154 100% 6.37%
Gearing Ratios
Debt to Equity Ratio: The debt to equity ratio for the company has been calculated to be
around 0.68 times of the total capital deployed that is equity value. It reflects that the company
Document Page
5FINANCIAL MANAGEMENT
may be using more of equity funds for financing the operations of the company (Small, Dollie &
Yasseen, 2019).
Debt to Equity Ratio
Total Long Term Debt 7980
Shareholder's Equity
1180
4
Ratio 0.68
Interest Coverage Ratio: The interest coverage ratio for the company indicates the coverage
of cash flows for paying of the interest expenses of a company. In this case the ratio was
around 1.40 times which is very low stating that the company might have problems in paying the
interest payments.
Interest Earned Ratio
EBIT 702
Interest Payable 500
Ratio 1.40
Debt to Asset Position: The debt to asset position for the company was around 0.33 times
stating debt as a percentage of total assets has been comparatively low for the company.
Debt to Asset Ratio
Total Debt Position 7980
Total Asset 24257
Ratio 0.33
Conclusion and Recommendations
The business risk associated with the company was found to be currently high with
falling profitability margins and volatile dividend trend we recommend that the company should
reduce the debt position in the company. The key reason behind the recommendation is
Document Page
6FINANCIAL MANAGEMENT
because the derived Interest coverage ratio that stated interest expenses is playing a significant
weightage role in the EBIT earned by the company. Thought the same would increase the
WACC of the company but at the same time normalize the profitability and financial risk that the
company is facing.
Reflection on Work
While working on assignment of financial management, I enjoyed the calculations of
WACC and gearing ratios given. I have taken the book value weights for equity and debt
calculations. The risk free taken for CAPM cost of equity computation is for 10-Years I have
computed the beta with the help of regression formula by taking stock data and market index
data (All Ordinary Share Index). Finally for calculating the return on market the return generated
by market index data (All Ordinary Share Index) was taken into consideration.
tabler-icon-diamond-filled.svg

Paraphrase This Document

Need a fresh take? Get an instant paraphrase of this document with our AI Paraphraser
Document Page
7FINANCIAL MANAGEMENT
References
Annual Report (2016). Originenergy.com.au. Retrieved 17 September 2019, from
https://www.originenergy.com.au/content/dam/origin/about/investors-media/
documents/Origin_Annual_Report_2016.pdf
Annual Report (2018). Originenergy.com.au. Retrieved 17 September 2019, from
https://www.originenergy.com.au/content/dam/origin/about/investors-media/
documents/Origin_2018_Annual_Report.pdf
Bloomberg – Risk Free Rate. (2019). Bloomberg.com. Retrieved 17 September 2019, from
https://www.bloomberg.com/markets/rates-bonds/government-bonds/australia
Frank, M. Z., & Shen, T. (2016). Investment and the weighted average cost of capital. Journal of
Financial Economics, 119(2), 300-315.
Interest Rates | Chart Pack. (2019). Reserve Bank of Australia. Retrieved 17 September 2019,
from https://www.rba.gov.au/chart-pack/interest-rates.html
Small, R., Dollie, Z., & Yasseen, Y. (2019). Independent review–understanding ratio
analysis. Professional Accountant, 2019(35), 12-13.
chevron_up_icon
1 out of 8
circle_padding
hide_on_mobile
zoom_out_icon
logo.png

Your All-in-One AI-Powered Toolkit for Academic Success.

Available 24*7 on WhatsApp / Email

[object Object]