ACC100 T1: Financial Analysis and Report on Origin Energy (ASX)
VerifiedAdded on 2023/03/31
|7
|862
|314
Report
AI Summary
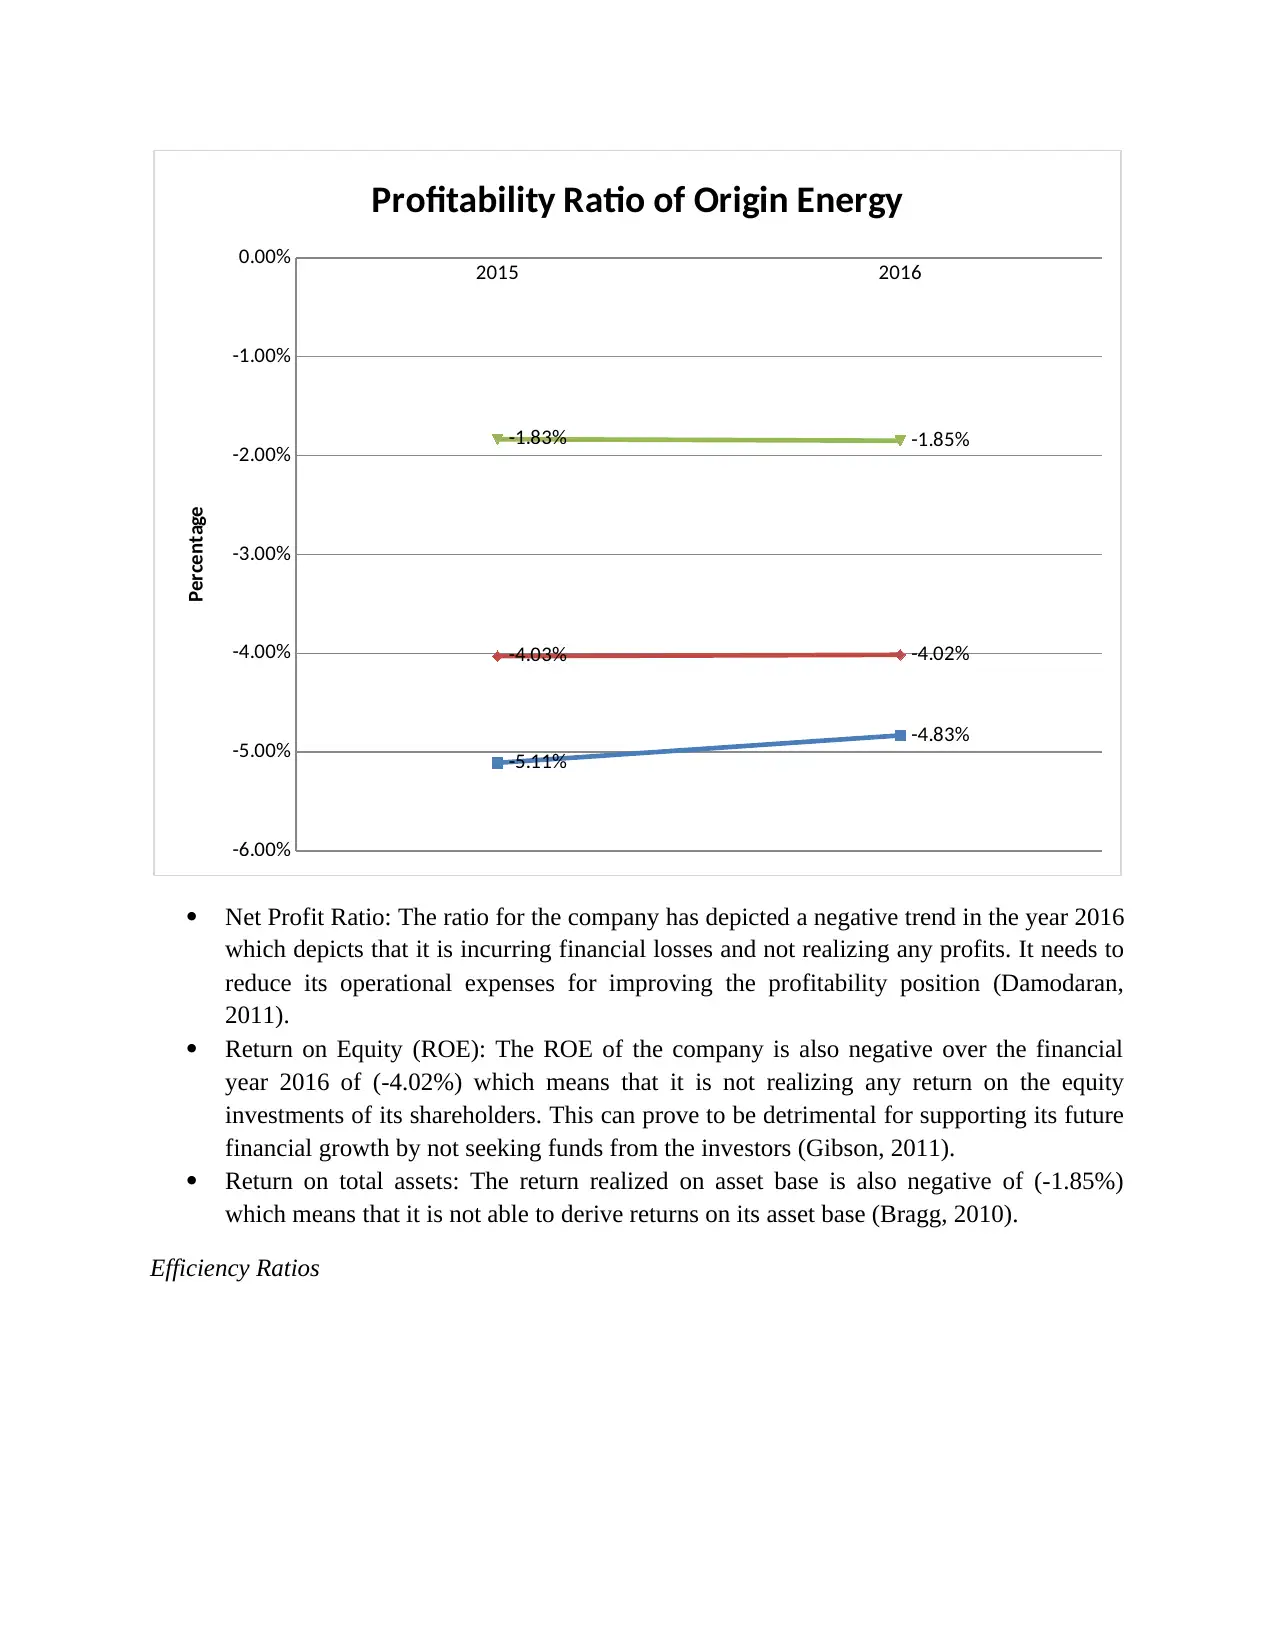
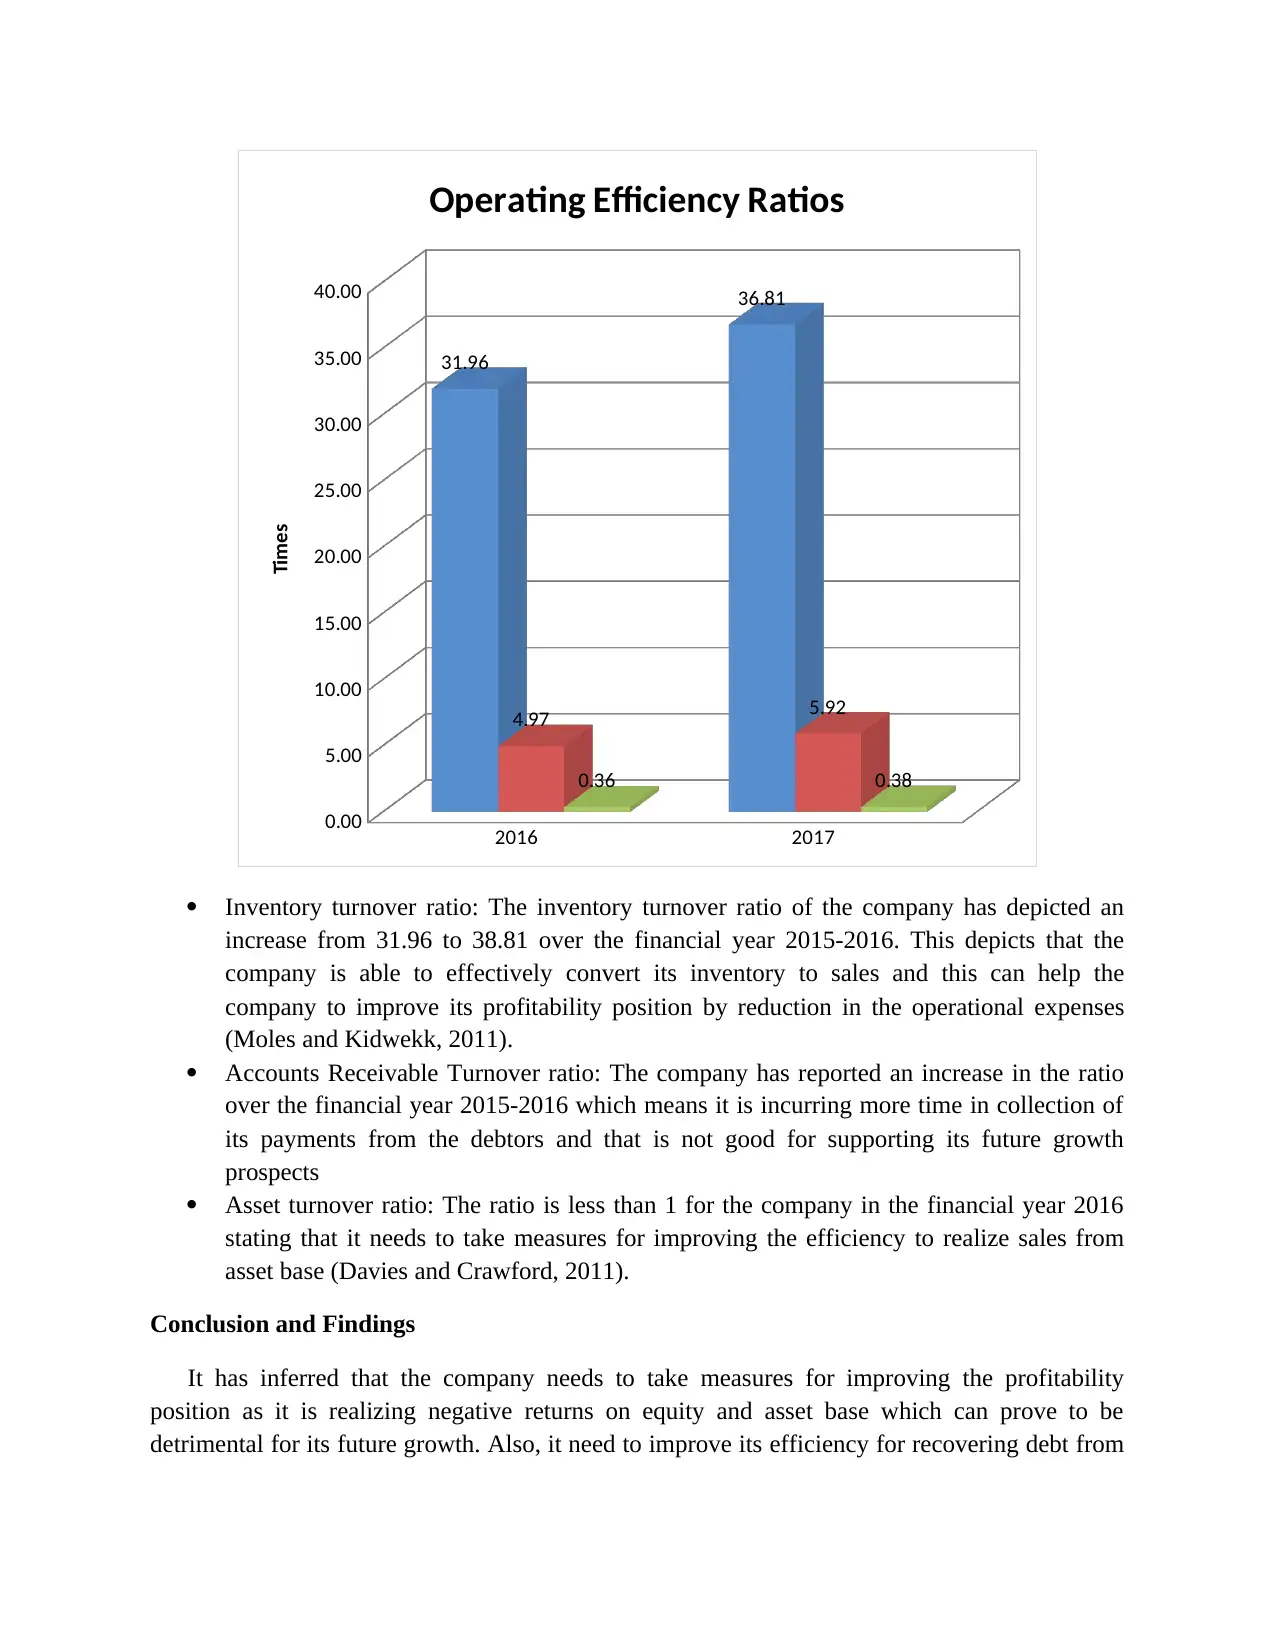
This report presents a financial analysis of Origin Energy, an ASX-listed company, focusing on its profitability and efficiency using ratio analysis for the financial year 2016. The analysis reveals negative trends in profitability ratios such as net profit ratio, return on equity, and return on total assets, indicating financial losses and poor returns on investments. Efficiency ratios, including inventory turnover, accounts receivable turnover, and asset turnover, show mixed results, with improvements in inventory turnover but concerns regarding debt collection and asset utilization. The report concludes that Origin Energy needs to improve its profitability and efficiency to ensure future growth and recommends potential investors to be cautious based on the company's 2016 financial performance. The analysis uses data from Origin Energy's 2016 Annual Report and references various sources on financial analysis and corporate finance.

Part B: Financial Analysis of Origin Energy –ASX Listed Company
Paraphrase This Document
Need a fresh take? Get an instant paraphrase of this document with our AI Paraphraser

Part B
Company Background
The company selected for analysis purpose is Origin Energy, an ASX listed entity that is
involved in production and exploration of energy resources for meeting the domestic and
commercial consumption of electricity within Australia. The major business functions of the
company include generation of energy products such as electricity, natural gas, LPG and other
renewable sources for meeting the power requirements of people within the country. It is
regarded as a major energy company of Australia.
Ratio Analysis
The profitability and efficiency performance of the company has been analyzed by the
use of calculating the following ratios for the financial year 2016:
Profitability Ratios
Financial Items 2014 2015 2016
Net profit after tax (590.00)$ (576.00)$
Net Sales 11,550.00$ 11,923.00$
Shareholder's equity 15,129 14,159.00$ 14,530.00$
Average shareholder's equity 14,644.00$ 14,344.50$
Total Assets 30,941 33,367.00$ 28,898.00$
Average total assets 32,154.00$ 31,132.50$
Financial Data used to calculate profitability ratio
Amount in $ Million
Ratios Formula 2015 2016
Net profit ratio Net profit/Sales -5.11% -4.83%
Return on equity
Net profit after
tax/Average
shareholder's equity
-4.03% -4.02%
Return on total assets Net profit after
tax/Average total assets -1.83% -1.85%
Profitability Ratio
(Origin Energy, 2016)

2015 2016
-6.00%
-5.00%
-4.00%
-3.00%
-2.00%
-1.00%
0.00%
-5.11%
-4.83%
-4.03% -4.02%
-1.83% -1.85%
Profitability Ratio of Origin Energy
Percentage
Net Profit Ratio: The ratio for the company has depicted a negative trend in the year 2016
which depicts that it is incurring financial losses and not realizing any profits. It needs to
reduce its operational expenses for improving the profitability position (Damodaran,
2011).
Return on Equity (ROE): The ROE of the company is also negative over the financial
year 2016 of (-4.02%) which means that it is not realizing any return on the equity
investments of its shareholders. This can prove to be detrimental for supporting its future
financial growth by not seeking funds from the investors (Gibson, 2011).
Return on total assets: The return realized on asset base is also negative of (-1.85%)
which means that it is not able to derive returns on its asset base (Bragg, 2010).
Efficiency Ratios
⊘ This is a preview!⊘
Do you want full access?
Subscribe today to unlock all pages.

Trusted by 1+ million students worldwide

Financial Items 2014 2015 2016
Net Sales 11,550.00$ 11,923.00$
Account Receivables 2,565.00$ 2,085.00$ 1,945.00$
Average account receivable 2,325.00$ 2,015.00$
Total Assets 30,941.00$ 33,367.00$ 28,898.00$
Average total assets 32,154.00$ 31,132.50$
Cost of Goods Sold 8,406.00$ 8,964.00$
Inventory 287.00$ 239.00$ 248.00$
Average Inventory 263.00$ 243.50$
Financial Data used to calculate operating efficiency ratio
Amount in $ Million
Ratios Formula 2016 2017
Inventory Tunover ratio Cost of goods
sold/Average inventory 31.96 36.81
Account Receivable tunrover
ratio
Net sales/Average
account receivables 4.97 5.92
Asset Turnover ratio Net Sales/Average total
assets 0.36 0.38
Operating Efficiency Ratios
(Origin Energy, 2016)
Paraphrase This Document
Need a fresh take? Get an instant paraphrase of this document with our AI Paraphraser

2016 2017
0.00
5.00
10.00
15.00
20.00
25.00
30.00
35.00
40.00
31.96
36.81
4.97 5.92
0.36 0.38
Operating Efficiency Ratios
Times
Inventory turnover ratio: The inventory turnover ratio of the company has depicted an
increase from 31.96 to 38.81 over the financial year 2015-2016. This depicts that the
company is able to effectively convert its inventory to sales and this can help the
company to improve its profitability position by reduction in the operational expenses
(Moles and Kidwekk, 2011).
Accounts Receivable Turnover ratio: The company has reported an increase in the ratio
over the financial year 2015-2016 which means it is incurring more time in collection of
its payments from the debtors and that is not good for supporting its future growth
prospects
Asset turnover ratio: The ratio is less than 1 for the company in the financial year 2016
stating that it needs to take measures for improving the efficiency to realize sales from
asset base (Davies and Crawford, 2011).
Conclusion and Findings
It has inferred that the company needs to take measures for improving the profitability
position as it is realizing negative returns on equity and asset base which can prove to be
detrimental for its future growth. Also, it need to improve its efficiency for recovering debt from

its debtors and realizing sales from the effective use of its asset base to maintain adequate flow
of cash for meeting its operational requirements.
Recommendations
It is recommended to a potential investor to not to invest within the company on the basis
of its financial performance of the year 2016. The company is incurring financial losses and
therefore not expected to show sign of improvement in the future context (Krantz, 2016).
⊘ This is a preview!⊘
Do you want full access?
Subscribe today to unlock all pages.

Trusted by 1+ million students worldwide

References
Bragg, S. 2010. Business Ratios and Formulas: A Comprehensive Guide. US: John Wiley &
Sons.
Damodaran, A. 2011. Applied corporate finance. USA: John Wiley & sons.
Davies, T. and Crawford, I. 2011. Business accounting and finance. USA: Pearson.
Gibson, C. 2011. Financial Reporting and Analysis: Using Financial Accounting Information.
Australia: Cengage Learning.
Krantz, M. 2016. Fundamental Analysis for Dummies. USA: John Wiley & Sons.
Moles, P. and Kidwekk, D. 2011. Corporate finance. USA: John Wiley &sons.
Origin Energy. 2016. Annual Report. [Online]. Available at:
https://www.originenergy.com.au/content/dam/origin/about/investorsmedia/documents/
Origin_Annual_Report_2016.pdf [Accessed on: 29 May 219].
1 out of 7
Related Documents

Your All-in-One AI-Powered Toolkit for Academic Success.
+13062052269
info@desklib.com
Available 24*7 on WhatsApp / Email
Unlock your academic potential
Copyright © 2020–2025 A2Z Services. All Rights Reserved. Developed and managed by ZUCOL.