Comprehensive Finance Report: Prime Media Group Limited
VerifiedAdded on 2020/05/16
|14
|3027
|27
Report
AI Summary
This finance report provides a detailed analysis of Prime Media Group Limited, examining its financial performance from 2014 to 2017. The report includes a description of the company, its ownership and governance structure, and calculations of key performance ratios such as Return on Assets (ROA), Return on Equity (ROE), and debt ratios. It analyzes the significant factors influencing the share price, calculates beta values and the expected rate of returns, and determines the weighted average cost of capital (WACC). The report also reviews the debt ratios for the past two years and discusses the company's dividend policy. The analysis includes a letter of recommendation and a comprehensive reference list. The report concludes that Prime Media's leverage has improved, and its efficiency and profitability are increasing, though 2016 saw a temporary disruption.

Running head: FINANCE FOR BUSINESS
Finance for Business
Name of the university
Name of the student
Authors note
Finance for Business
Name of the university
Name of the student
Authors note
Paraphrase This Document
Need a fresh take? Get an instant paraphrase of this document with our AI Paraphraser
1
FINANCE FOR BUSINESS
Table of Contents
Description of company:..................................................................................................................2
Ownership and governance structure of company:.........................................................................2
Calculation of performance ratios:..................................................................................................3
Graph with the description of results:..............................................................................................5
Significant factors influencing the share price of Prime Media group limited:..............................6
Calculation of Beta values and expected rate of returns:................................................................7
Weighted average cost of capital:....................................................................................................7
Debt ratios for the past two years:...................................................................................................8
Dividend policy:..............................................................................................................................9
Letter recommendation:.................................................................................................................10
References list:...............................................................................................................................12
2
FINANCE FOR BUSINESS
Description of company:
Prime Media is a media corporation that owns regional television network covering
region southern and northern New South Wales, Victoria, Australia capital territory, Western
Australia and Gold area of Southeastern Queensland. Company was established in year 1986
after which television license was acquired in Western Australia. It is one of the leading
television networks in the broadcast market that has evolved by making considerable investments
in local news programming (Primemedia.com.au 2018). It also helps in assisting and supporting
community endeavors by providing valuable airtime sponsorship. Revenues are sourced by
Prime limited from television advertising airtime and they have the most influential advertising
opportunity in regional Australia. Free to air commercial television license is owned by Prime
limited in regional Western Australia and Mildura where nine entertainment programming is
broadcasted. Some other services are iShopTv and data casting television service that are owned
by Prime Media limited (Primemedia.com.au 2018).
Ownership and governance structure of company:
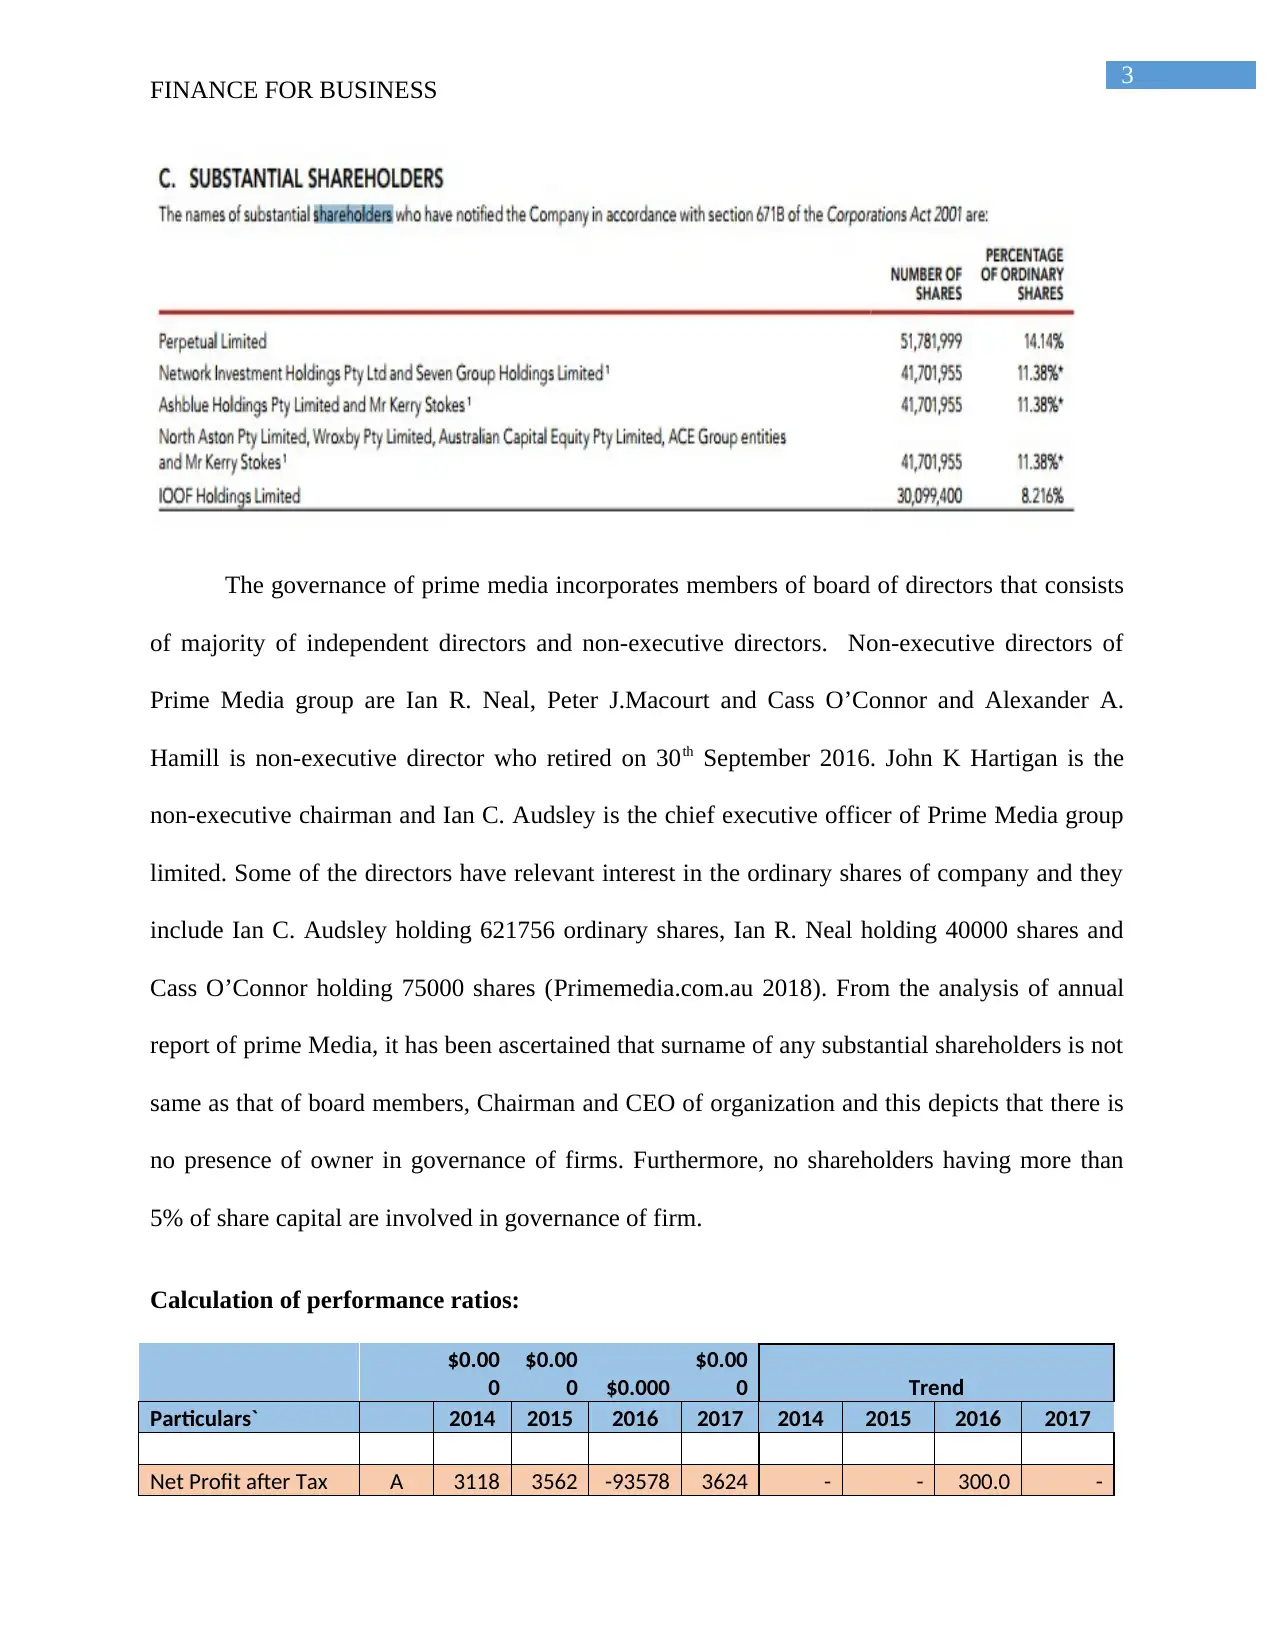
The group has reported the name of substantial shareholders according to section 671B of
the Corporation Act, 2001. Largest registered shareholder holding 21.22% of ordinary shares is
HSBC Custody Nominees Australia Limited and all the substantial shareholders have more than
5% of shareholdings. Substantial shareholders having shareholding higher than 5% of
shareholding includes Perpetual limited having 14.14% shareholdings, Network investment
holdings having shareholding of 11.38%, Ash blue Holding Pty limited having 11.38% of
shareholdings, North Aston Pty limited having 11.38% of shareholdings and IOOF holdings
limited having 8.216% of shareholdings (Primemedia.com.au 2018).
.
FINANCE FOR BUSINESS
Description of company:
Prime Media is a media corporation that owns regional television network covering
region southern and northern New South Wales, Victoria, Australia capital territory, Western
Australia and Gold area of Southeastern Queensland. Company was established in year 1986
after which television license was acquired in Western Australia. It is one of the leading
television networks in the broadcast market that has evolved by making considerable investments
in local news programming (Primemedia.com.au 2018). It also helps in assisting and supporting
community endeavors by providing valuable airtime sponsorship. Revenues are sourced by
Prime limited from television advertising airtime and they have the most influential advertising
opportunity in regional Australia. Free to air commercial television license is owned by Prime
limited in regional Western Australia and Mildura where nine entertainment programming is
broadcasted. Some other services are iShopTv and data casting television service that are owned
by Prime Media limited (Primemedia.com.au 2018).
Ownership and governance structure of company:
The group has reported the name of substantial shareholders according to section 671B of
the Corporation Act, 2001. Largest registered shareholder holding 21.22% of ordinary shares is
HSBC Custody Nominees Australia Limited and all the substantial shareholders have more than
5% of shareholdings. Substantial shareholders having shareholding higher than 5% of
shareholding includes Perpetual limited having 14.14% shareholdings, Network investment
holdings having shareholding of 11.38%, Ash blue Holding Pty limited having 11.38% of
shareholdings, North Aston Pty limited having 11.38% of shareholdings and IOOF holdings
limited having 8.216% of shareholdings (Primemedia.com.au 2018).
.
⊘ This is a preview!⊘
Do you want full access?
Subscribe today to unlock all pages.
Trusted by 1+ million students worldwide
3
FINANCE FOR BUSINESS
The governance of prime media incorporates members of board of directors that consists
of majority of independent directors and non-executive directors. Non-executive directors of
Prime Media group are Ian R. Neal, Peter J.Macourt and Cass O’Connor and Alexander A.
Hamill is non-executive director who retired on 30th September 2016. John K Hartigan is the
non-executive chairman and Ian C. Audsley is the chief executive officer of Prime Media group
limited. Some of the directors have relevant interest in the ordinary shares of company and they
include Ian C. Audsley holding 621756 ordinary shares, Ian R. Neal holding 40000 shares and
Cass O’Connor holding 75000 shares (Primemedia.com.au 2018). From the analysis of annual
report of prime Media, it has been ascertained that surname of any substantial shareholders is not
same as that of board members, Chairman and CEO of organization and this depicts that there is
no presence of owner in governance of firms. Furthermore, no shareholders having more than
5% of share capital are involved in governance of firm.
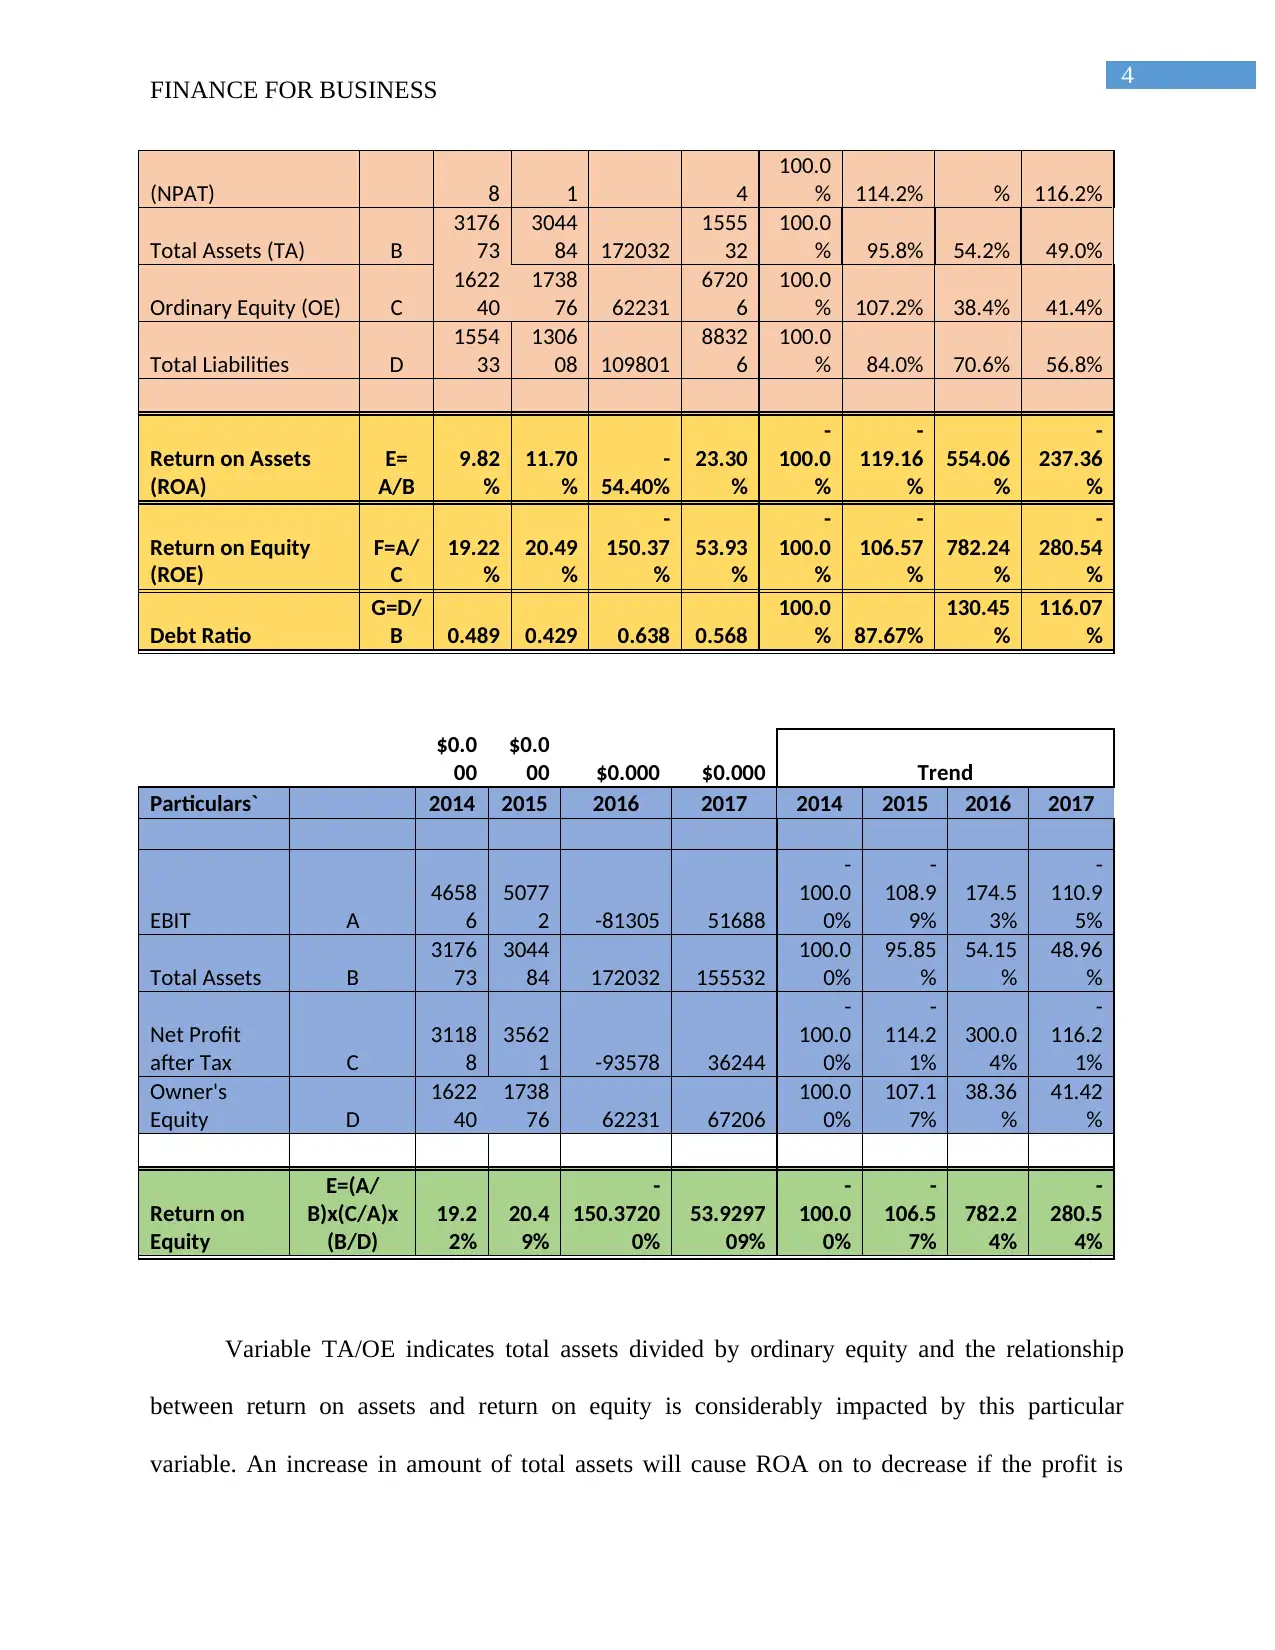
Calculation of performance ratios:
$0.00
0
$0.00
0 $0.000
$0.00
0 Trend
Particulars` 2014 2015 2016 2017 2014 2015 2016 2017
Net Profit after Tax A 3118 3562 -93578 3624 - - 300.0 -
FINANCE FOR BUSINESS
The governance of prime media incorporates members of board of directors that consists
of majority of independent directors and non-executive directors. Non-executive directors of
Prime Media group are Ian R. Neal, Peter J.Macourt and Cass O’Connor and Alexander A.
Hamill is non-executive director who retired on 30th September 2016. John K Hartigan is the
non-executive chairman and Ian C. Audsley is the chief executive officer of Prime Media group
limited. Some of the directors have relevant interest in the ordinary shares of company and they
include Ian C. Audsley holding 621756 ordinary shares, Ian R. Neal holding 40000 shares and
Cass O’Connor holding 75000 shares (Primemedia.com.au 2018). From the analysis of annual
report of prime Media, it has been ascertained that surname of any substantial shareholders is not
same as that of board members, Chairman and CEO of organization and this depicts that there is
no presence of owner in governance of firms. Furthermore, no shareholders having more than
5% of share capital are involved in governance of firm.
Calculation of performance ratios:
$0.00
0
$0.00
0 $0.000
$0.00
0 Trend
Particulars` 2014 2015 2016 2017 2014 2015 2016 2017
Net Profit after Tax A 3118 3562 -93578 3624 - - 300.0 -
Paraphrase This Document
Need a fresh take? Get an instant paraphrase of this document with our AI Paraphraser
4
FINANCE FOR BUSINESS
(NPAT) 8 1 4
100.0
% 114.2% % 116.2%
Total Assets (TA) B
3176
73
3044
84 172032
1555
32
100.0
% 95.8% 54.2% 49.0%
Ordinary Equity (OE) C
1622
40
1738
76 62231
6720
6
100.0
% 107.2% 38.4% 41.4%
Total Liabilities D
1554
33
1306
08 109801
8832
6
100.0
% 84.0% 70.6% 56.8%
Return on Assets
(ROA)
E=
A/B
9.82
%
11.70
%
-
54.40%
23.30
%
-
100.0
%
-
119.16
%
554.06
%
-
237.36
%
Return on Equity
(ROE)
F=A/
C
19.22
%
20.49
%
-
150.37
%
53.93
%
-
100.0
%
-
106.57
%
782.24
%
-
280.54
%
Debt Ratio
G=D/
B 0.489 0.429 0.638 0.568
100.0
% 87.67%
130.45
%
116.07
%
$0.0
00
$0.0
00 $0.000 $0.000 Trend
Particulars` 2014 2015 2016 2017 2014 2015 2016 2017
EBIT A
4658
6
5077
2 -81305 51688
-
100.0
0%
-
108.9
9%
174.5
3%
-
110.9
5%
Total Assets B
3176
73
3044
84 172032 155532
100.0
0%
95.85
%
54.15
%
48.96
%
Net Profit
after Tax C
3118
8
3562
1 -93578 36244
-
100.0
0%
-
114.2
1%
300.0
4%
-
116.2
1%
Owner's
Equity D
1622
40
1738
76 62231 67206
100.0
0%
107.1
7%
38.36
%
41.42
%
Return on
Equity
E=(A/
B)x(C/A)x
(B/D)
19.2
2%
20.4
9%
-
150.3720
0%
53.9297
09%
-
100.0
0%
-
106.5
7%
782.2
4%
-
280.5
4%
Variable TA/OE indicates total assets divided by ordinary equity and the relationship
between return on assets and return on equity is considerably impacted by this particular
variable. An increase in amount of total assets will cause ROA on to decrease if the profit is
5
FINANCE FOR BUSINESS
remaining constant. However, an increase in profits will cause ROA to increase if the magnitude
of increase in profits is more than increase in total assets amount. Return on equity on other
hand, will increase when there is increase in amount of profits reported along with increase in
total equity (Brotherson et al. 2015). However, magnitude of increase in profits should be more
than that of total equity reported.
From the computation of ROA and ROE, it can be inferred from the figures that ROE is
more than ROA throughout the year of analysis. ROE is significantly higher than ROA for two
consecutive years that is 2014 and 2015 because the amount of ordinary assets increased and
total assets amount decreased (Gotze et al. 2015). For financial year 2016, value of ordinary
equity has reduced drastically compared to total assets that had led to lower value of ROE as
against ROA. Value of ROE in the current financial year is more than that of ROA.
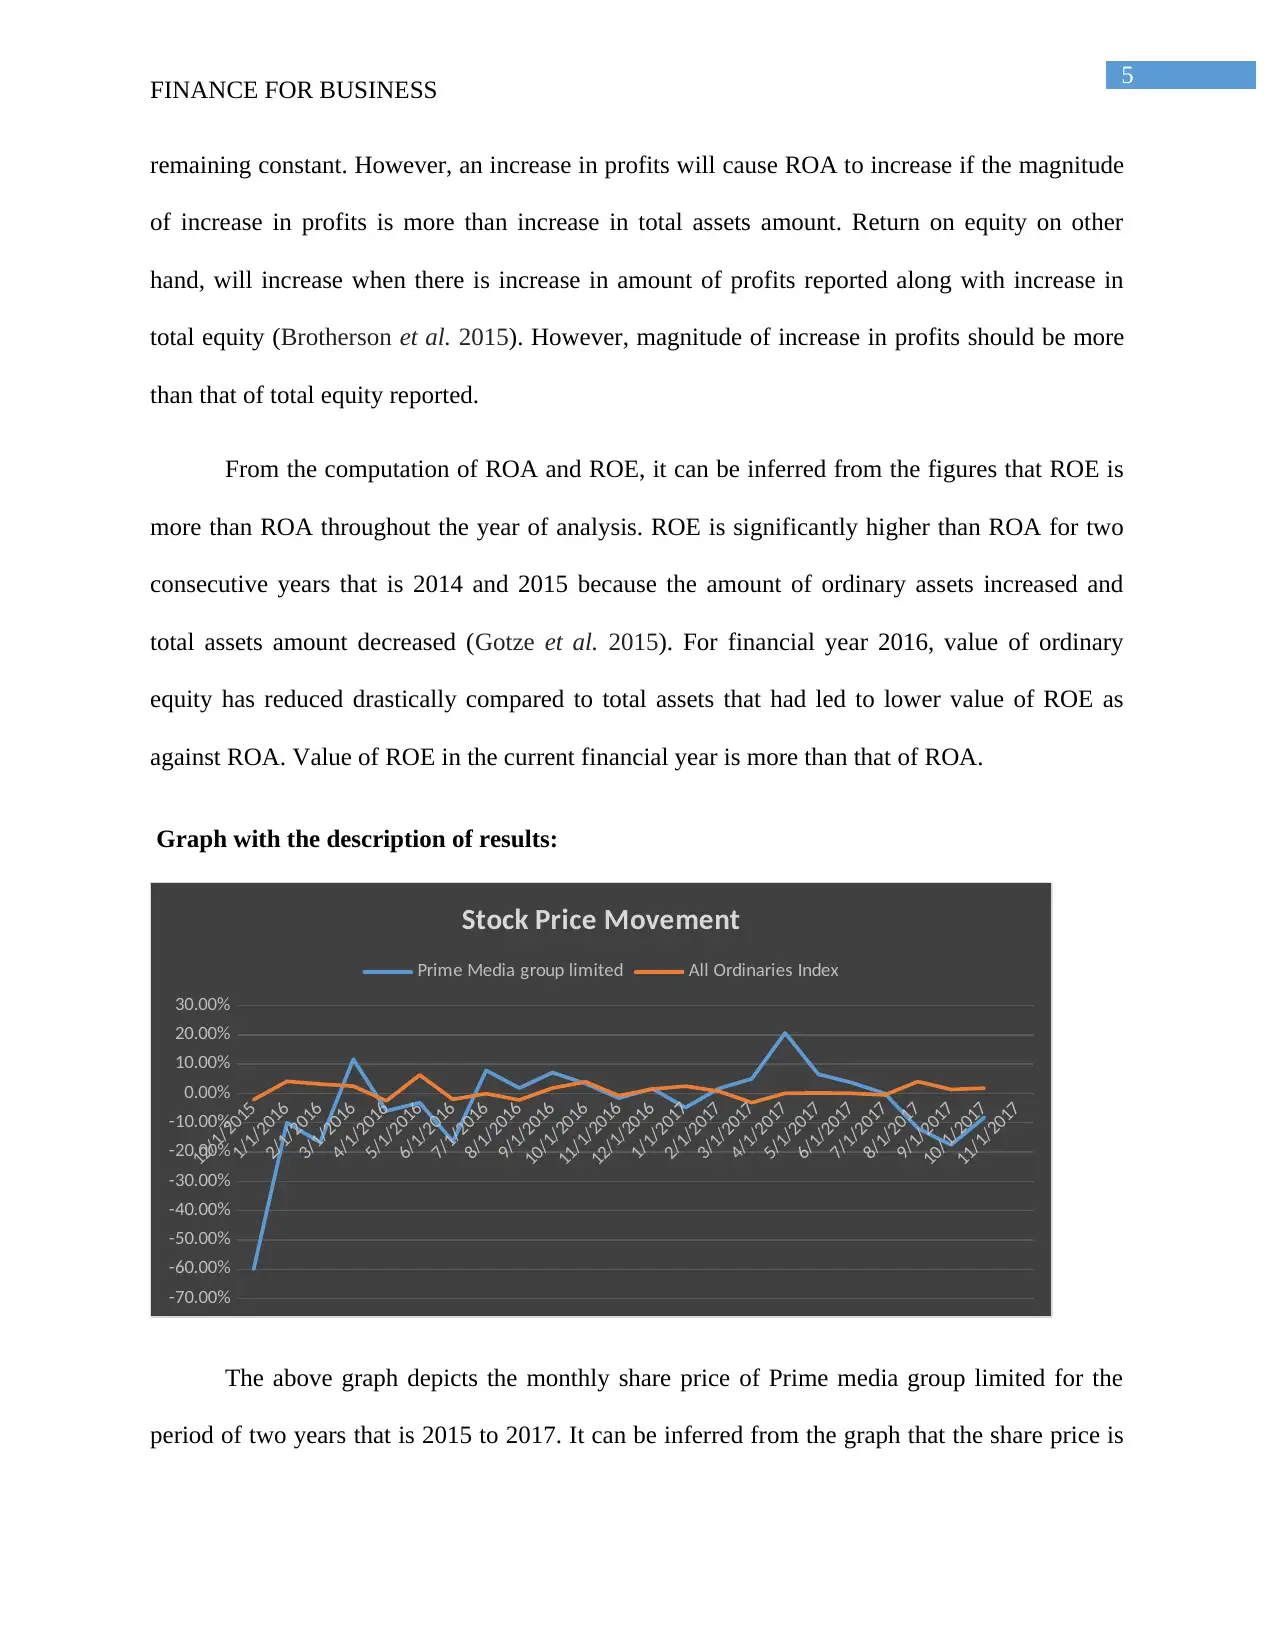
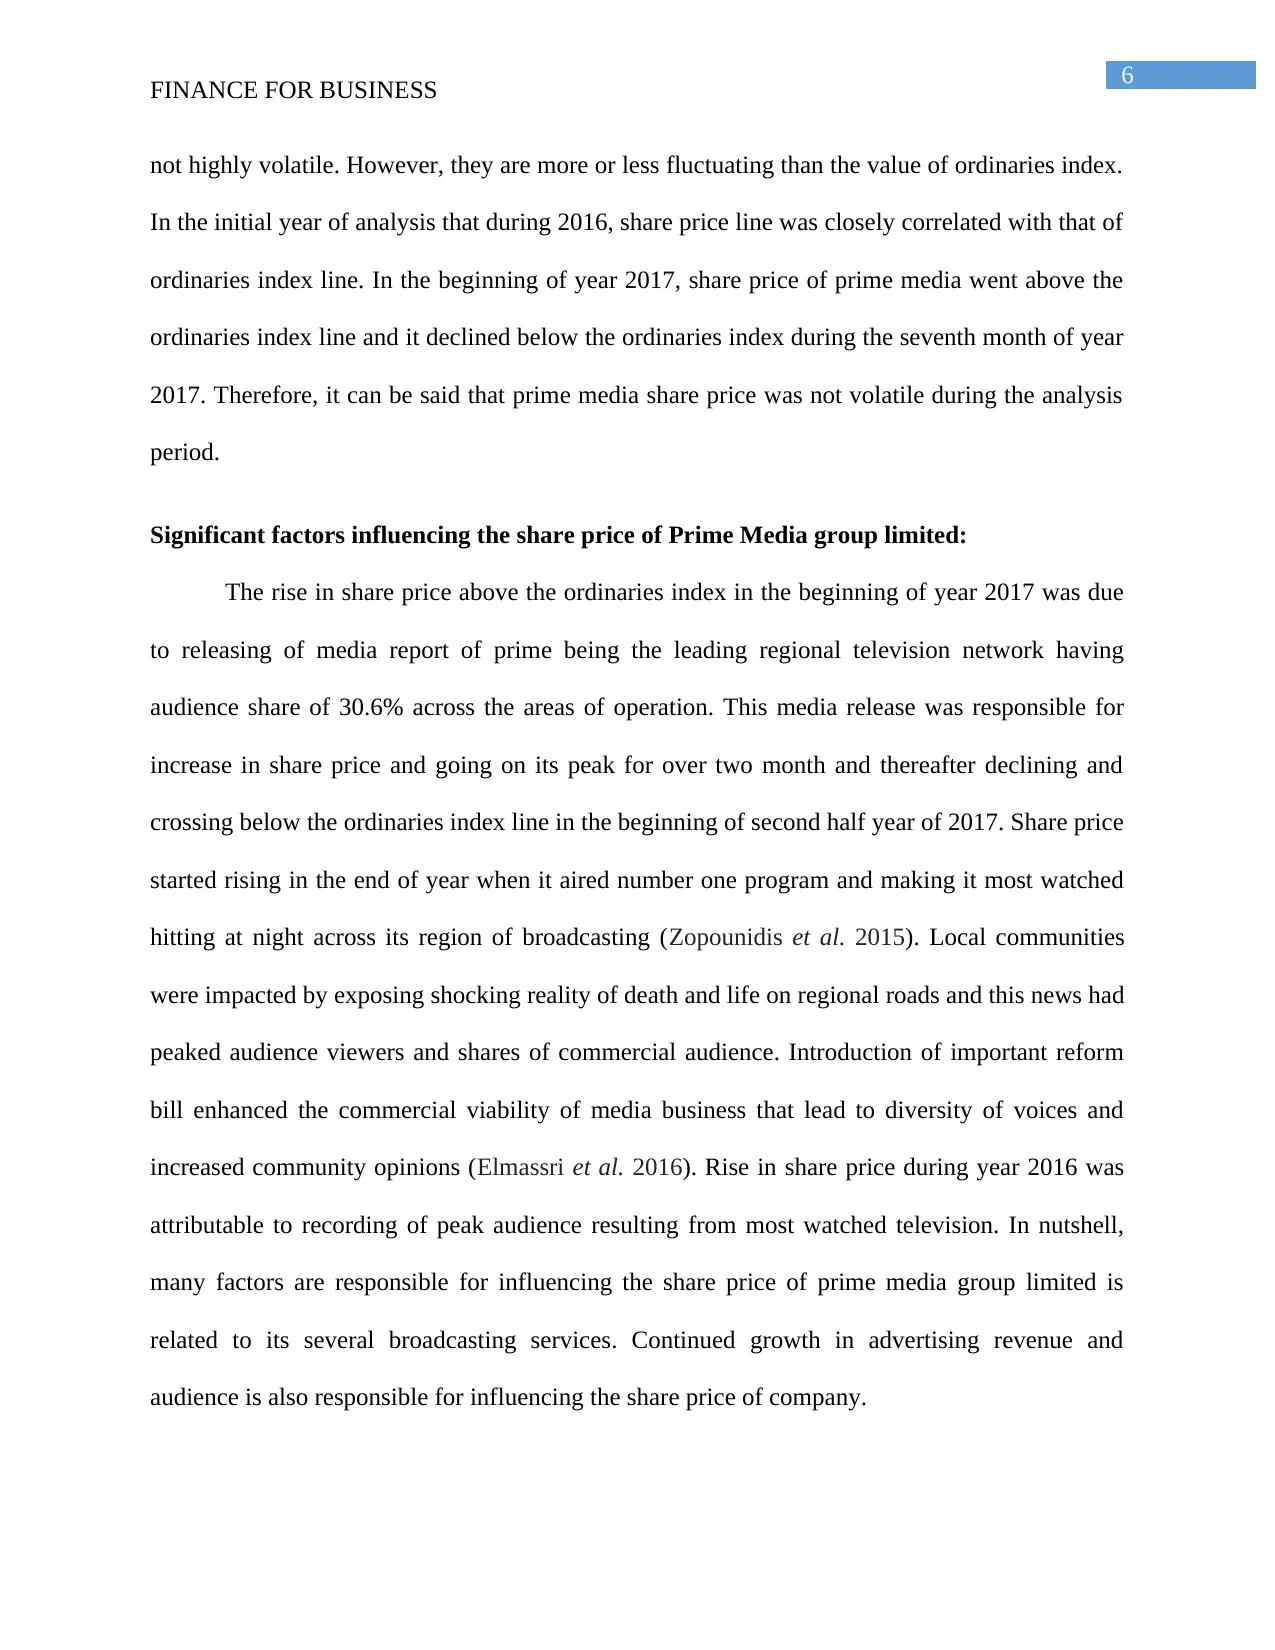
Graph with the description of results:
12/1/2015
1/1/2016
2/1/2016
3/1/2016
4/1/2016
5/1/2016
6/1/2016
7/1/2016
8/1/2016
9/1/2016
10/1/2016
11/1/2016
12/1/2016
1/1/2017
2/1/2017
3/1/2017
4/1/2017
5/1/2017
6/1/2017
7/1/2017
8/1/2017
9/1/2017
10/1/2017
11/1/2017
-70.00%
-60.00%
-50.00%
-40.00%
-30.00%
-20.00%
-10.00%
0.00%
10.00%
20.00%
30.00%
Stock Price Movement
Prime Media group limited All Ordinaries Index
The above graph depicts the monthly share price of Prime media group limited for the
period of two years that is 2015 to 2017. It can be inferred from the graph that the share price is
FINANCE FOR BUSINESS
remaining constant. However, an increase in profits will cause ROA to increase if the magnitude
of increase in profits is more than increase in total assets amount. Return on equity on other
hand, will increase when there is increase in amount of profits reported along with increase in
total equity (Brotherson et al. 2015). However, magnitude of increase in profits should be more
than that of total equity reported.
From the computation of ROA and ROE, it can be inferred from the figures that ROE is
more than ROA throughout the year of analysis. ROE is significantly higher than ROA for two
consecutive years that is 2014 and 2015 because the amount of ordinary assets increased and
total assets amount decreased (Gotze et al. 2015). For financial year 2016, value of ordinary
equity has reduced drastically compared to total assets that had led to lower value of ROE as
against ROA. Value of ROE in the current financial year is more than that of ROA.
Graph with the description of results:
12/1/2015
1/1/2016
2/1/2016
3/1/2016
4/1/2016
5/1/2016
6/1/2016
7/1/2016
8/1/2016
9/1/2016
10/1/2016
11/1/2016
12/1/2016
1/1/2017
2/1/2017
3/1/2017
4/1/2017
5/1/2017
6/1/2017
7/1/2017
8/1/2017
9/1/2017
10/1/2017
11/1/2017
-70.00%
-60.00%
-50.00%
-40.00%
-30.00%
-20.00%
-10.00%
0.00%
10.00%
20.00%
30.00%
Stock Price Movement
Prime Media group limited All Ordinaries Index
The above graph depicts the monthly share price of Prime media group limited for the
period of two years that is 2015 to 2017. It can be inferred from the graph that the share price is
⊘ This is a preview!⊘
Do you want full access?
Subscribe today to unlock all pages.
Trusted by 1+ million students worldwide
6
FINANCE FOR BUSINESS
not highly volatile. However, they are more or less fluctuating than the value of ordinaries index.
In the initial year of analysis that during 2016, share price line was closely correlated with that of
ordinaries index line. In the beginning of year 2017, share price of prime media went above the
ordinaries index line and it declined below the ordinaries index during the seventh month of year
2017. Therefore, it can be said that prime media share price was not volatile during the analysis
period.
Significant factors influencing the share price of Prime Media group limited:
The rise in share price above the ordinaries index in the beginning of year 2017 was due
to releasing of media report of prime being the leading regional television network having
audience share of 30.6% across the areas of operation. This media release was responsible for
increase in share price and going on its peak for over two month and thereafter declining and
crossing below the ordinaries index line in the beginning of second half year of 2017. Share price
started rising in the end of year when it aired number one program and making it most watched
hitting at night across its region of broadcasting (Zopounidis et al. 2015). Local communities
were impacted by exposing shocking reality of death and life on regional roads and this news had
peaked audience viewers and shares of commercial audience. Introduction of important reform
bill enhanced the commercial viability of media business that lead to diversity of voices and
increased community opinions (Elmassri et al. 2016). Rise in share price during year 2016 was
attributable to recording of peak audience resulting from most watched television. In nutshell,
many factors are responsible for influencing the share price of prime media group limited is
related to its several broadcasting services. Continued growth in advertising revenue and
audience is also responsible for influencing the share price of company.
Paraphrase This Document
Need a fresh take? Get an instant paraphrase of this document with our AI Paraphraser
7
FINANCE FOR BUSINESS
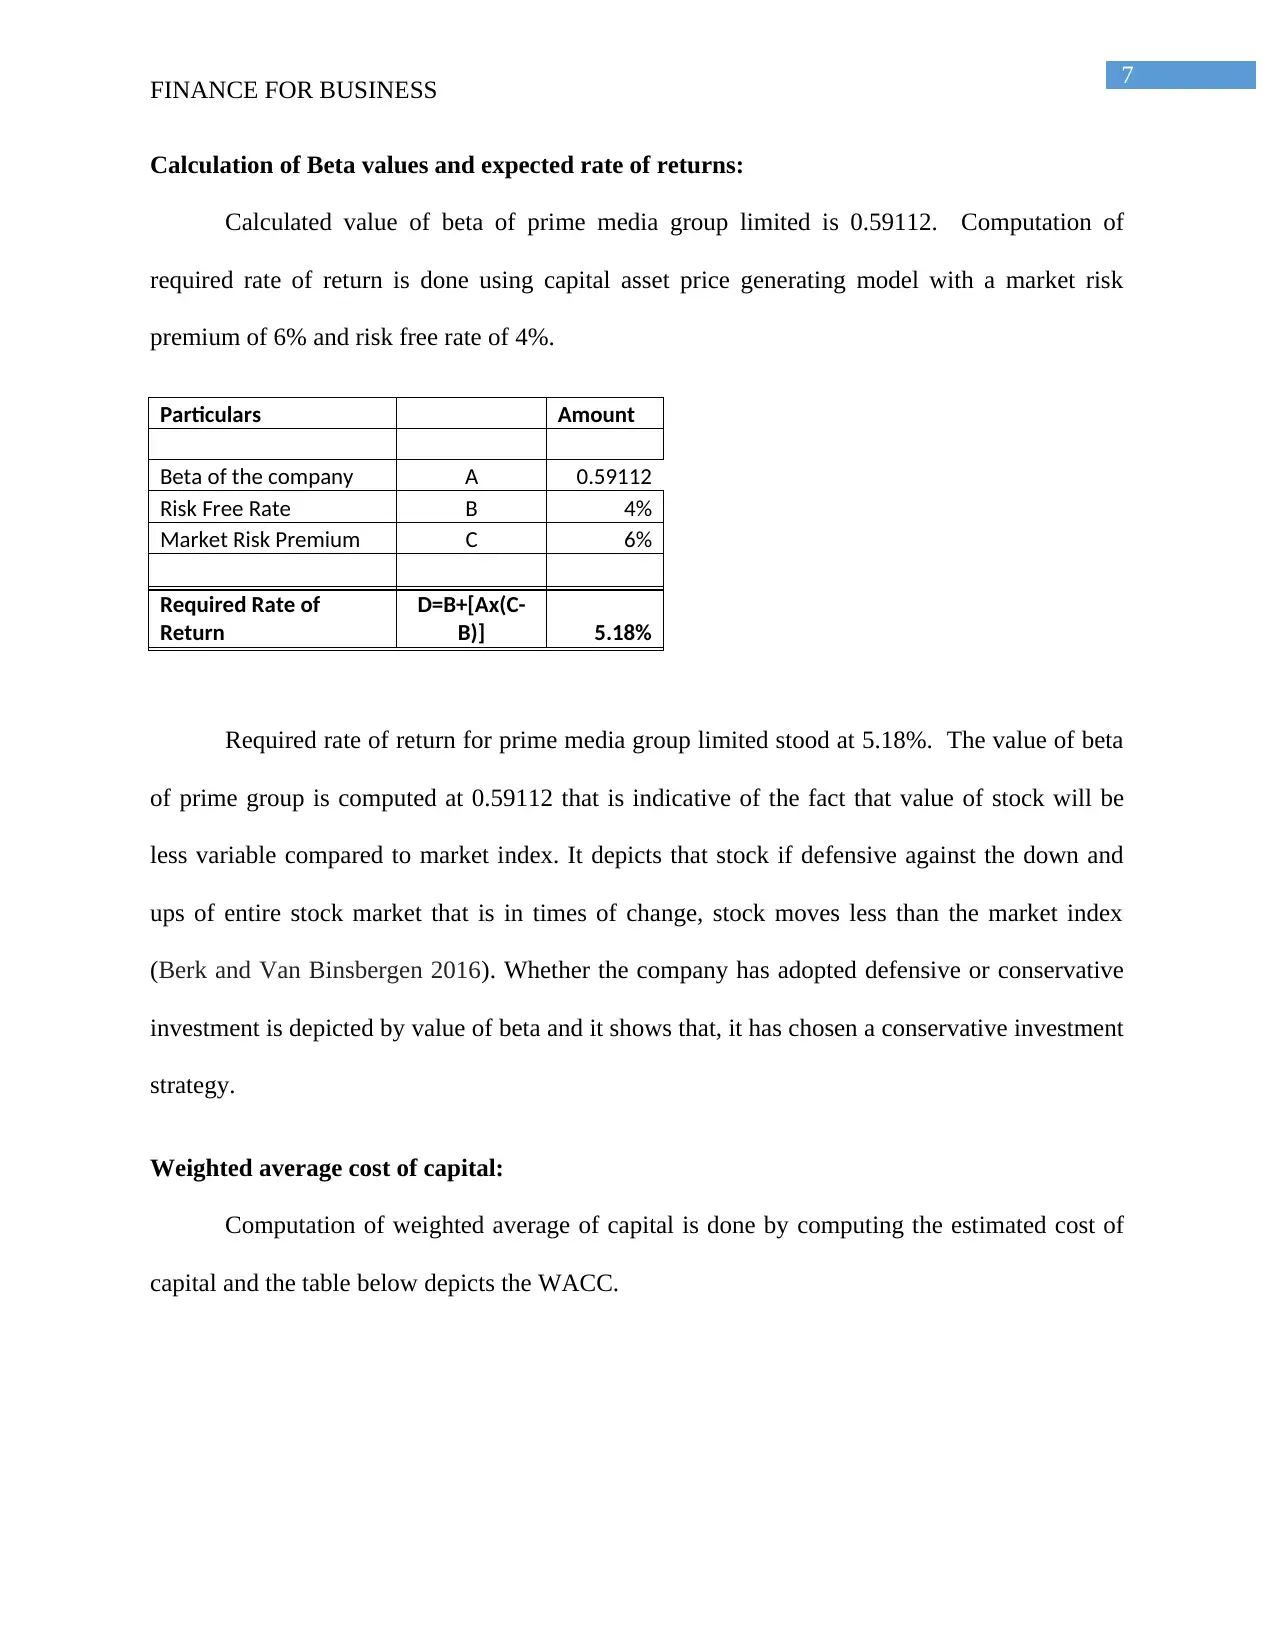
Calculation of Beta values and expected rate of returns:
Calculated value of beta of prime media group limited is 0.59112. Computation of
required rate of return is done using capital asset price generating model with a market risk
premium of 6% and risk free rate of 4%.
Particulars Amount
Beta of the company A 0.59112
Risk Free Rate B 4%
Market Risk Premium C 6%
Required Rate of
Return
D=B+[Ax(C-
B)] 5.18%
Required rate of return for prime media group limited stood at 5.18%. The value of beta
of prime group is computed at 0.59112 that is indicative of the fact that value of stock will be
less variable compared to market index. It depicts that stock if defensive against the down and
ups of entire stock market that is in times of change, stock moves less than the market index
(Berk and Van Binsbergen 2016). Whether the company has adopted defensive or conservative
investment is depicted by value of beta and it shows that, it has chosen a conservative investment
strategy.
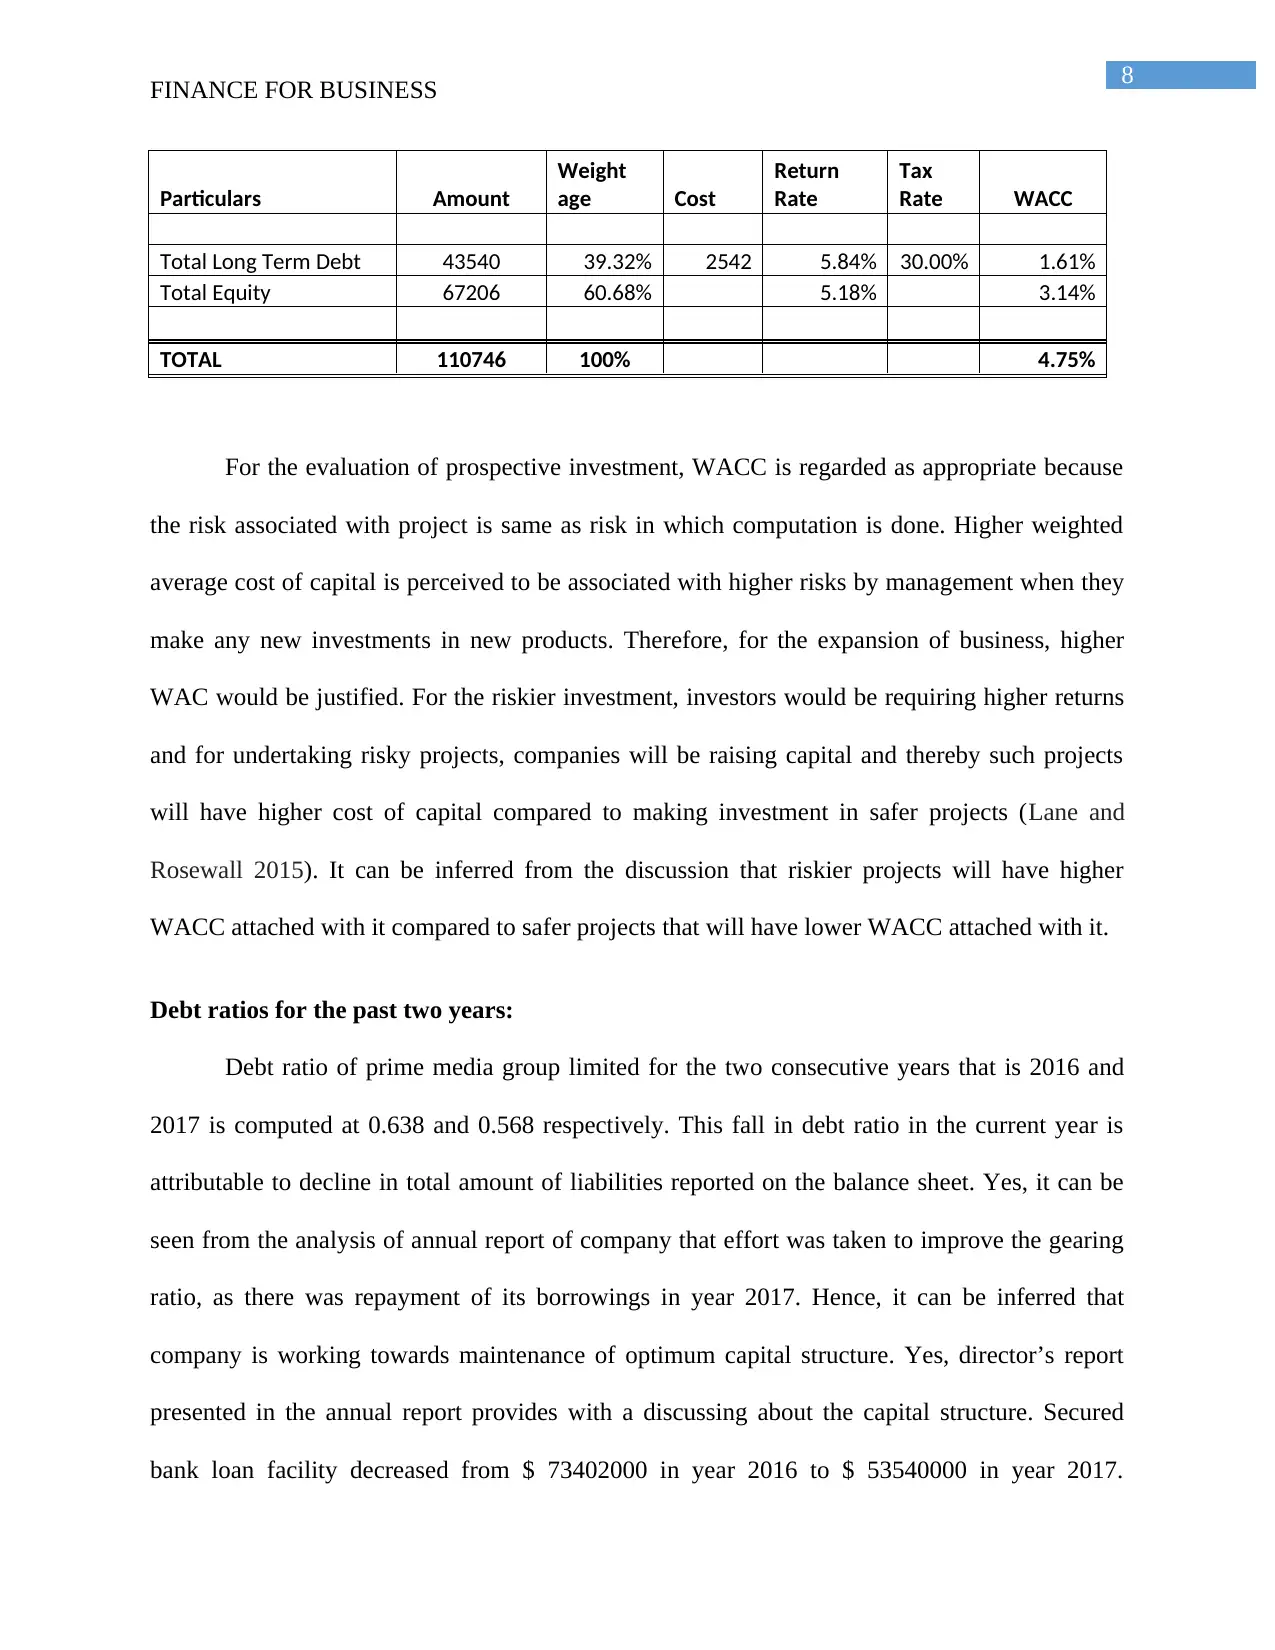
Weighted average cost of capital:
Computation of weighted average of capital is done by computing the estimated cost of
capital and the table below depicts the WACC.
FINANCE FOR BUSINESS
Calculation of Beta values and expected rate of returns:
Calculated value of beta of prime media group limited is 0.59112. Computation of
required rate of return is done using capital asset price generating model with a market risk
premium of 6% and risk free rate of 4%.
Particulars Amount
Beta of the company A 0.59112
Risk Free Rate B 4%
Market Risk Premium C 6%
Required Rate of
Return
D=B+[Ax(C-
B)] 5.18%
Required rate of return for prime media group limited stood at 5.18%. The value of beta
of prime group is computed at 0.59112 that is indicative of the fact that value of stock will be
less variable compared to market index. It depicts that stock if defensive against the down and
ups of entire stock market that is in times of change, stock moves less than the market index
(Berk and Van Binsbergen 2016). Whether the company has adopted defensive or conservative
investment is depicted by value of beta and it shows that, it has chosen a conservative investment
strategy.
Weighted average cost of capital:
Computation of weighted average of capital is done by computing the estimated cost of
capital and the table below depicts the WACC.
8
FINANCE FOR BUSINESS
Particulars Amount
Weight
age Cost
Return
Rate
Tax
Rate WACC
Total Long Term Debt 43540 39.32% 2542 5.84% 30.00% 1.61%
Total Equity 67206 60.68% 5.18% 3.14%
TOTAL 110746 100% 4.75%
For the evaluation of prospective investment, WACC is regarded as appropriate because
the risk associated with project is same as risk in which computation is done. Higher weighted
average cost of capital is perceived to be associated with higher risks by management when they
make any new investments in new products. Therefore, for the expansion of business, higher
WAC would be justified. For the riskier investment, investors would be requiring higher returns
and for undertaking risky projects, companies will be raising capital and thereby such projects
will have higher cost of capital compared to making investment in safer projects (Lane and
Rosewall 2015). It can be inferred from the discussion that riskier projects will have higher
WACC attached with it compared to safer projects that will have lower WACC attached with it.
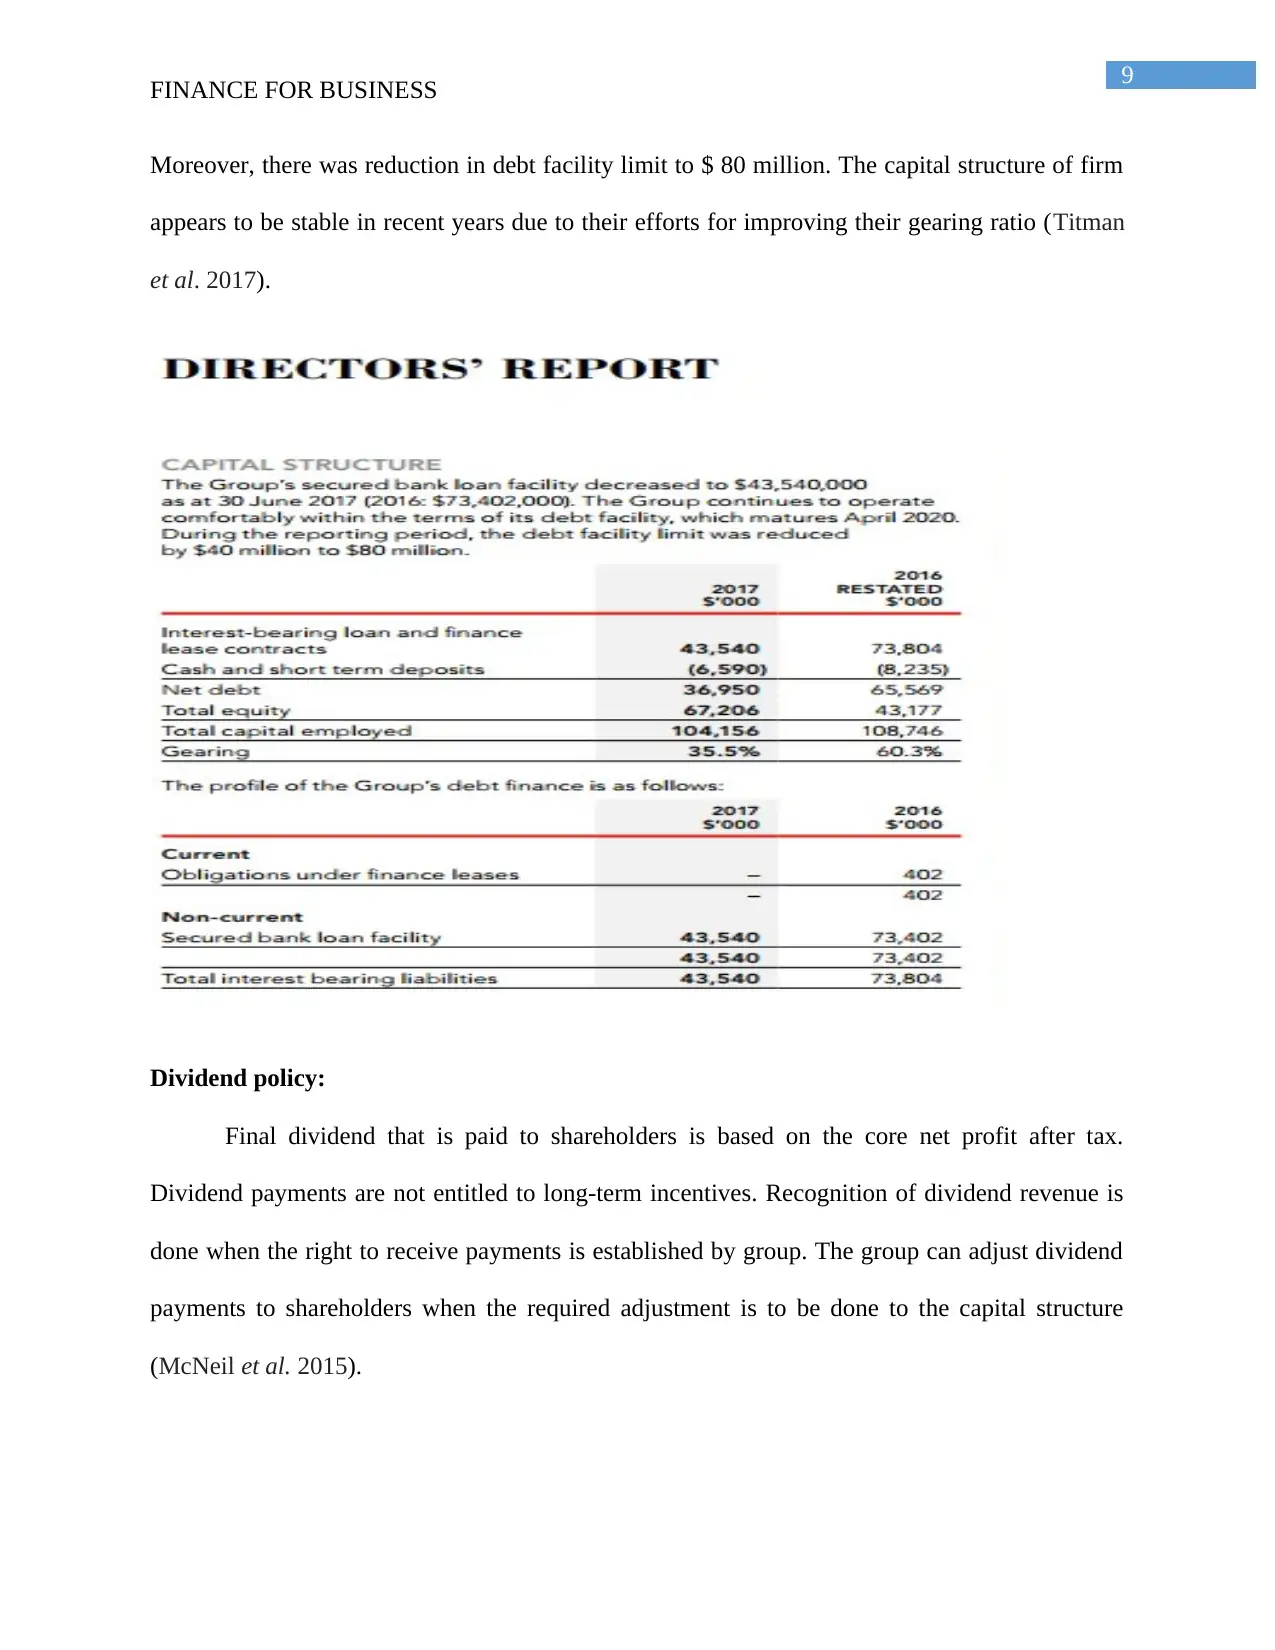
Debt ratios for the past two years:
Debt ratio of prime media group limited for the two consecutive years that is 2016 and
2017 is computed at 0.638 and 0.568 respectively. This fall in debt ratio in the current year is
attributable to decline in total amount of liabilities reported on the balance sheet. Yes, it can be
seen from the analysis of annual report of company that effort was taken to improve the gearing
ratio, as there was repayment of its borrowings in year 2017. Hence, it can be inferred that
company is working towards maintenance of optimum capital structure. Yes, director’s report
presented in the annual report provides with a discussing about the capital structure. Secured
bank loan facility decreased from $ 73402000 in year 2016 to $ 53540000 in year 2017.
FINANCE FOR BUSINESS
Particulars Amount
Weight
age Cost
Return
Rate
Tax
Rate WACC
Total Long Term Debt 43540 39.32% 2542 5.84% 30.00% 1.61%
Total Equity 67206 60.68% 5.18% 3.14%
TOTAL 110746 100% 4.75%
For the evaluation of prospective investment, WACC is regarded as appropriate because
the risk associated with project is same as risk in which computation is done. Higher weighted
average cost of capital is perceived to be associated with higher risks by management when they
make any new investments in new products. Therefore, for the expansion of business, higher
WAC would be justified. For the riskier investment, investors would be requiring higher returns
and for undertaking risky projects, companies will be raising capital and thereby such projects
will have higher cost of capital compared to making investment in safer projects (Lane and
Rosewall 2015). It can be inferred from the discussion that riskier projects will have higher
WACC attached with it compared to safer projects that will have lower WACC attached with it.
Debt ratios for the past two years:
Debt ratio of prime media group limited for the two consecutive years that is 2016 and
2017 is computed at 0.638 and 0.568 respectively. This fall in debt ratio in the current year is
attributable to decline in total amount of liabilities reported on the balance sheet. Yes, it can be
seen from the analysis of annual report of company that effort was taken to improve the gearing
ratio, as there was repayment of its borrowings in year 2017. Hence, it can be inferred that
company is working towards maintenance of optimum capital structure. Yes, director’s report
presented in the annual report provides with a discussing about the capital structure. Secured
bank loan facility decreased from $ 73402000 in year 2016 to $ 53540000 in year 2017.
⊘ This is a preview!⊘
Do you want full access?
Subscribe today to unlock all pages.
Trusted by 1+ million students worldwide
9
FINANCE FOR BUSINESS
Moreover, there was reduction in debt facility limit to $ 80 million. The capital structure of firm
appears to be stable in recent years due to their efforts for improving their gearing ratio (Titman
et al. 2017).
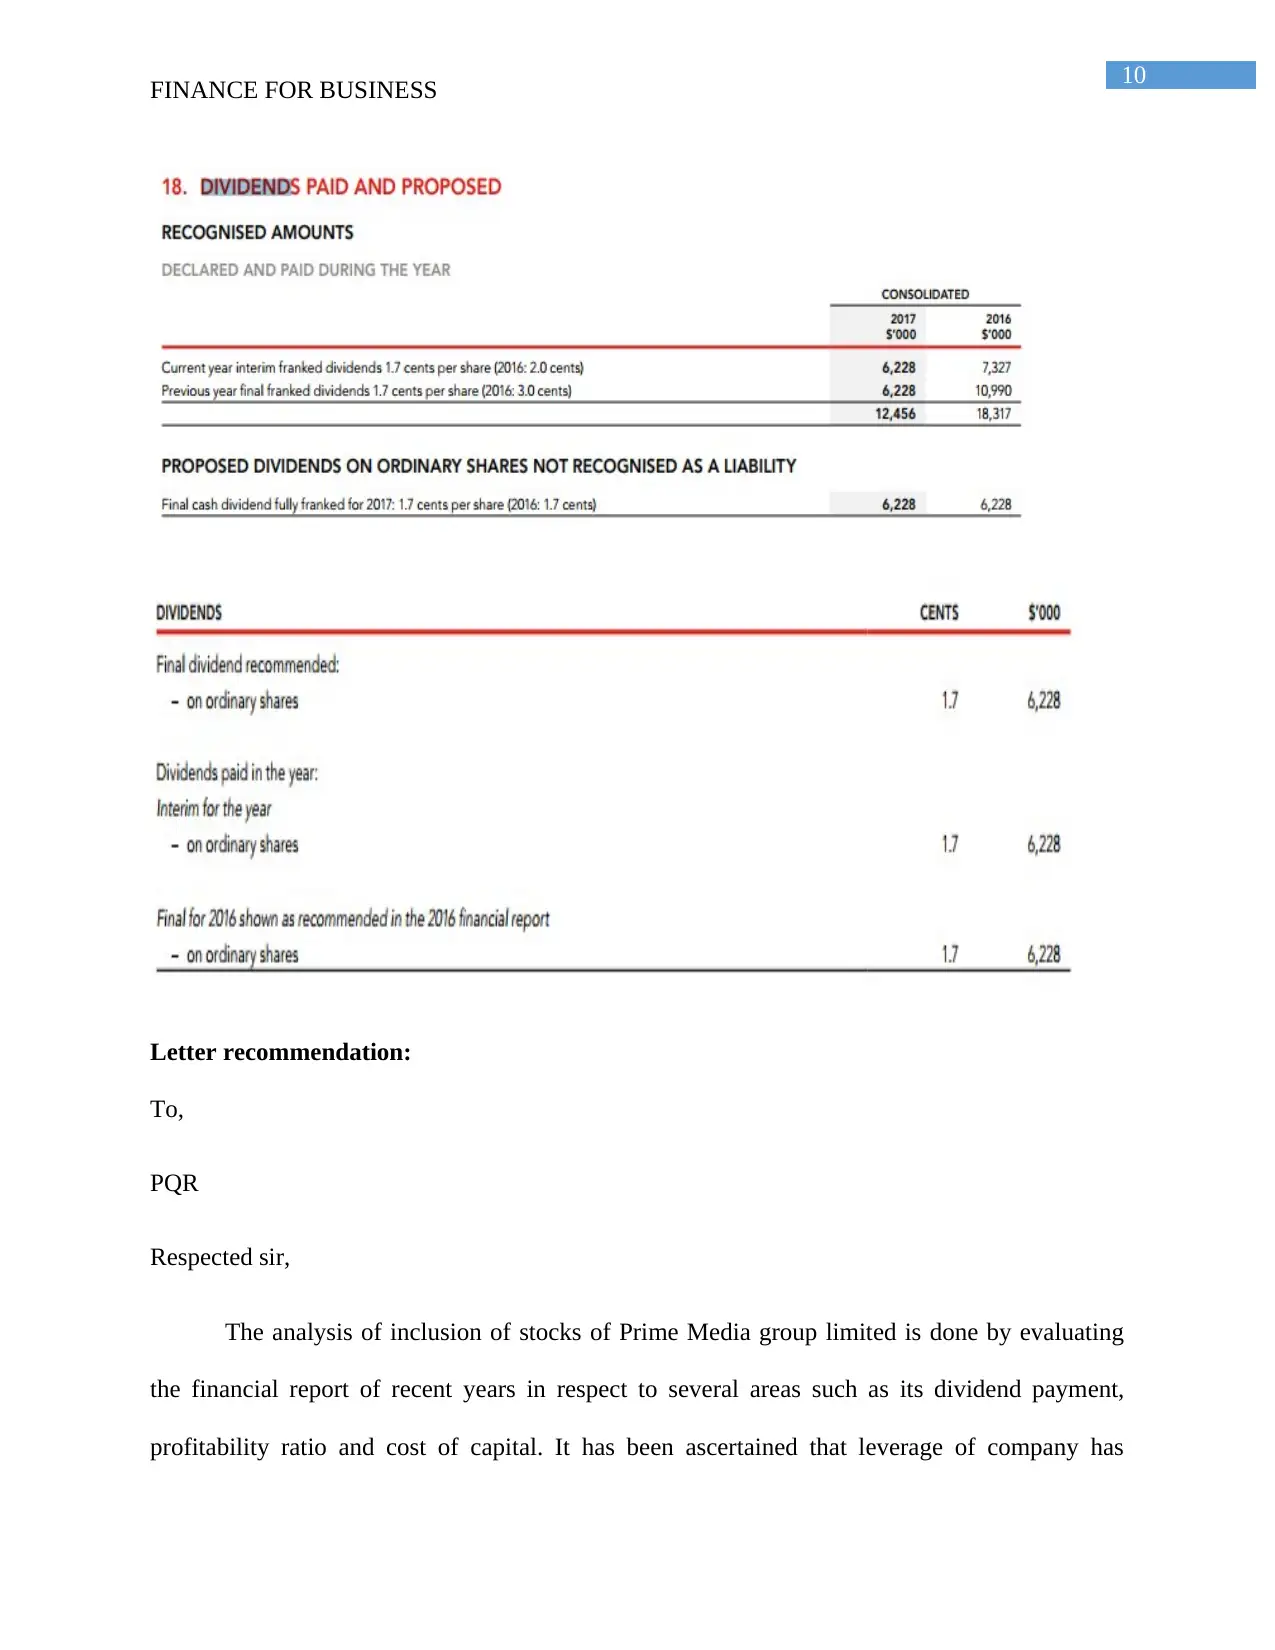
Dividend policy:
Final dividend that is paid to shareholders is based on the core net profit after tax.
Dividend payments are not entitled to long-term incentives. Recognition of dividend revenue is
done when the right to receive payments is established by group. The group can adjust dividend
payments to shareholders when the required adjustment is to be done to the capital structure
(McNeil et al. 2015).
FINANCE FOR BUSINESS
Moreover, there was reduction in debt facility limit to $ 80 million. The capital structure of firm
appears to be stable in recent years due to their efforts for improving their gearing ratio (Titman
et al. 2017).
Dividend policy:
Final dividend that is paid to shareholders is based on the core net profit after tax.
Dividend payments are not entitled to long-term incentives. Recognition of dividend revenue is
done when the right to receive payments is established by group. The group can adjust dividend
payments to shareholders when the required adjustment is to be done to the capital structure
(McNeil et al. 2015).
Paraphrase This Document
Need a fresh take? Get an instant paraphrase of this document with our AI Paraphraser
10
FINANCE FOR BUSINESS
Letter recommendation:
To,
PQR
Respected sir,
The analysis of inclusion of stocks of Prime Media group limited is done by evaluating
the financial report of recent years in respect to several areas such as its dividend payment,
profitability ratio and cost of capital. It has been ascertained that leverage of company has
11
FINANCE FOR BUSINESS
improved in the recent year due to reduction in overall liabilities attributable to company.
Moreover, return on assets and return on equity has also witnessed increasing figures indicating
that group has been efficiently utilizing their assets and total equity capital. However, year 2016
witnessed negative profits that have influenced their efficiency and profitability position. It was a
temporary disruption resulting from some generation of loss in that particular year. Furthermore,
required rate of return computed for company is higher than weighted cost of capital. Value of
beta is indicative of the fact that company has followed conservative investment strategy (Fitri et
al. 2015). It indicates that the stock of Prime media group will help in reducing risk exposure to
market if the investors include it in a portfolio of high beta value stocks. Furthermore, prime
media has its operation in media industry and it has muted reactions to market shocks. The
volatility of company is less relative to broad movements in market along with consistent beta
value (Chittenden and Derregia 2015). Investors seeking investment in this stock by
incorporating it into their investment portfolio would be benefitted due to lower risks during the
times of economic decline. Performance of company has been more or less consistent throughout
the year compared to market performance. Therefore, from the analysis of all the factors
mentioned above, it is recommended to investors to make investment in stocks of Prime media
group limited and expanding his or her portfolio in positive aspects.
⊘ This is a preview!⊘
Do you want full access?
Subscribe today to unlock all pages.
Trusted by 1+ million students worldwide
1 out of 14
Related Documents


Your All-in-One AI-Powered Toolkit for Academic Success.
+13062052269
info@desklib.com
Available 24*7 on WhatsApp / Email
![[object Object]](/_next/static/media/star-bottom.7253800d.svg)
Unlock your academic potential
Copyright © 2020–2026 A2Z Services. All Rights Reserved. Developed and managed by ZUCOL.