Financial Analysis and Recommendations: Ryan Co. Finance Report
VerifiedAdded on  2021/12/17
|13
|1516
|62
Report
AI Summary
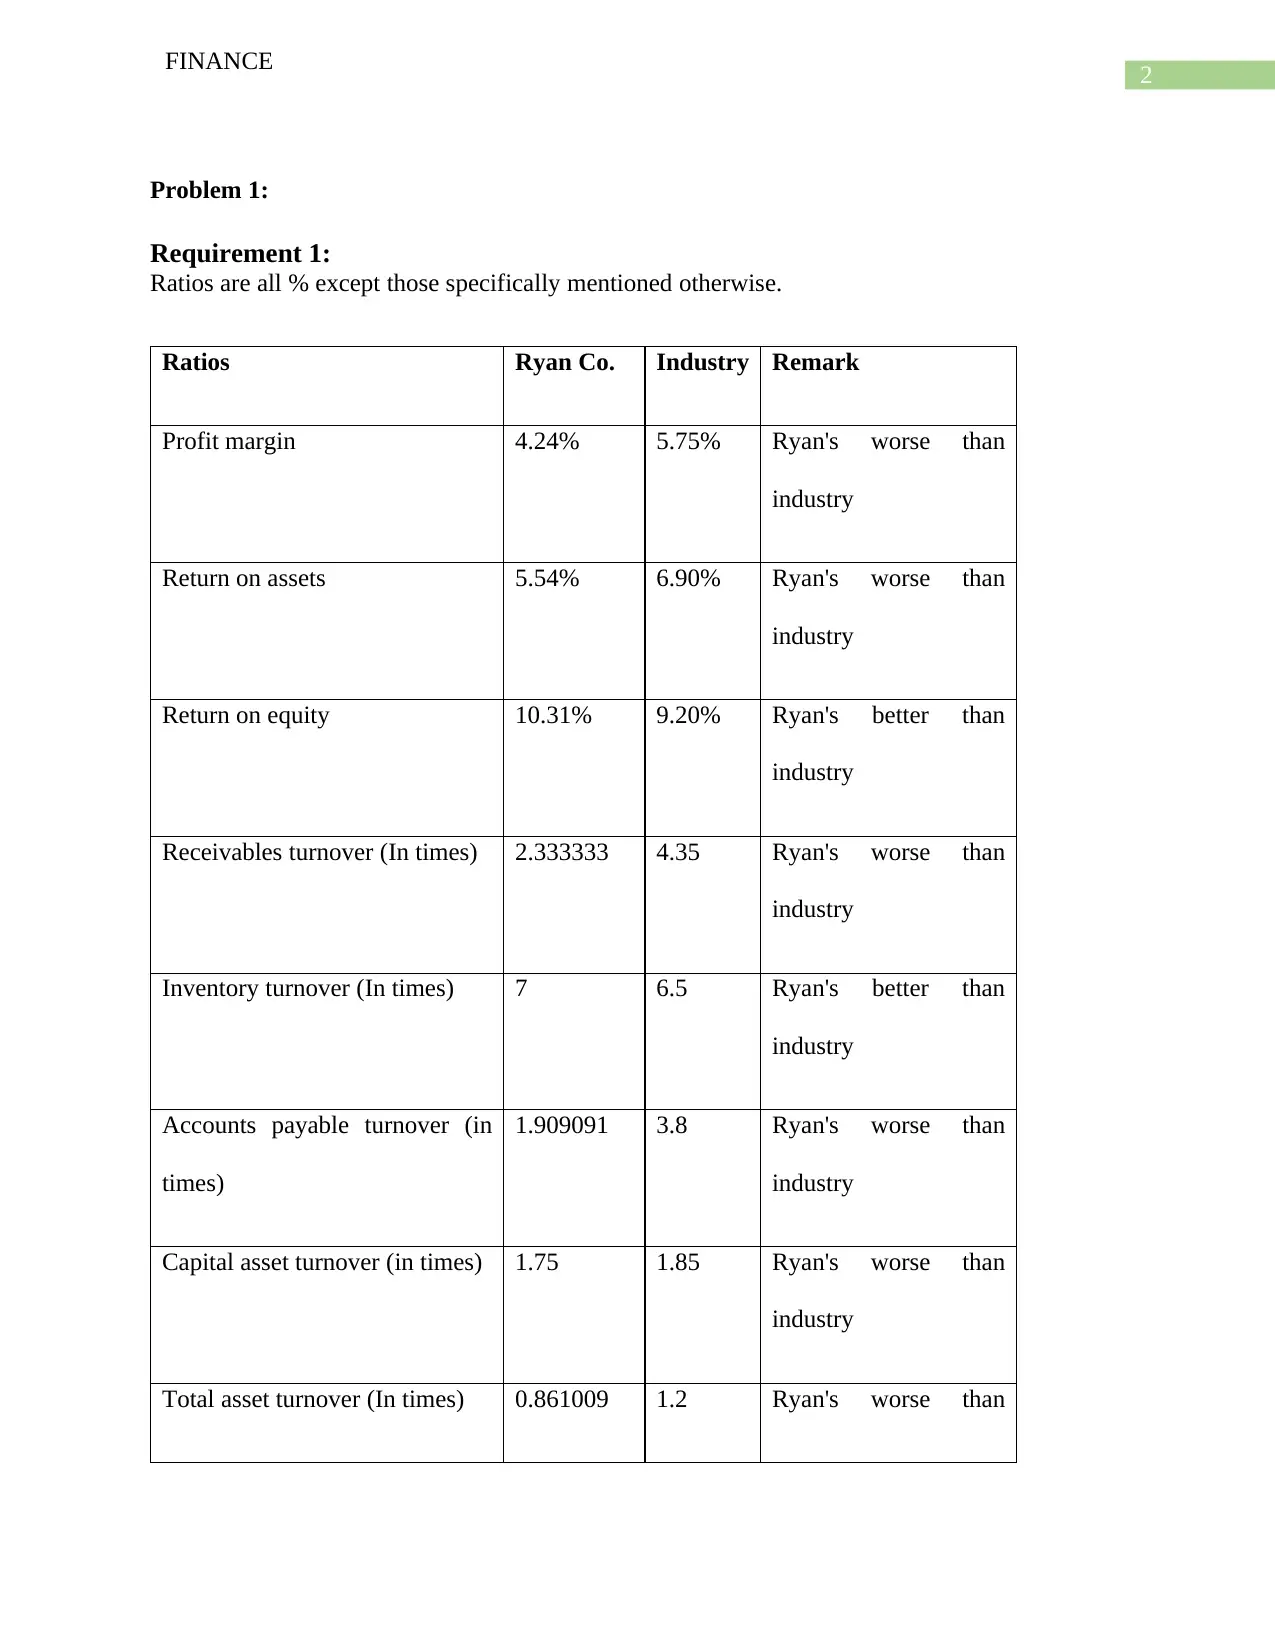
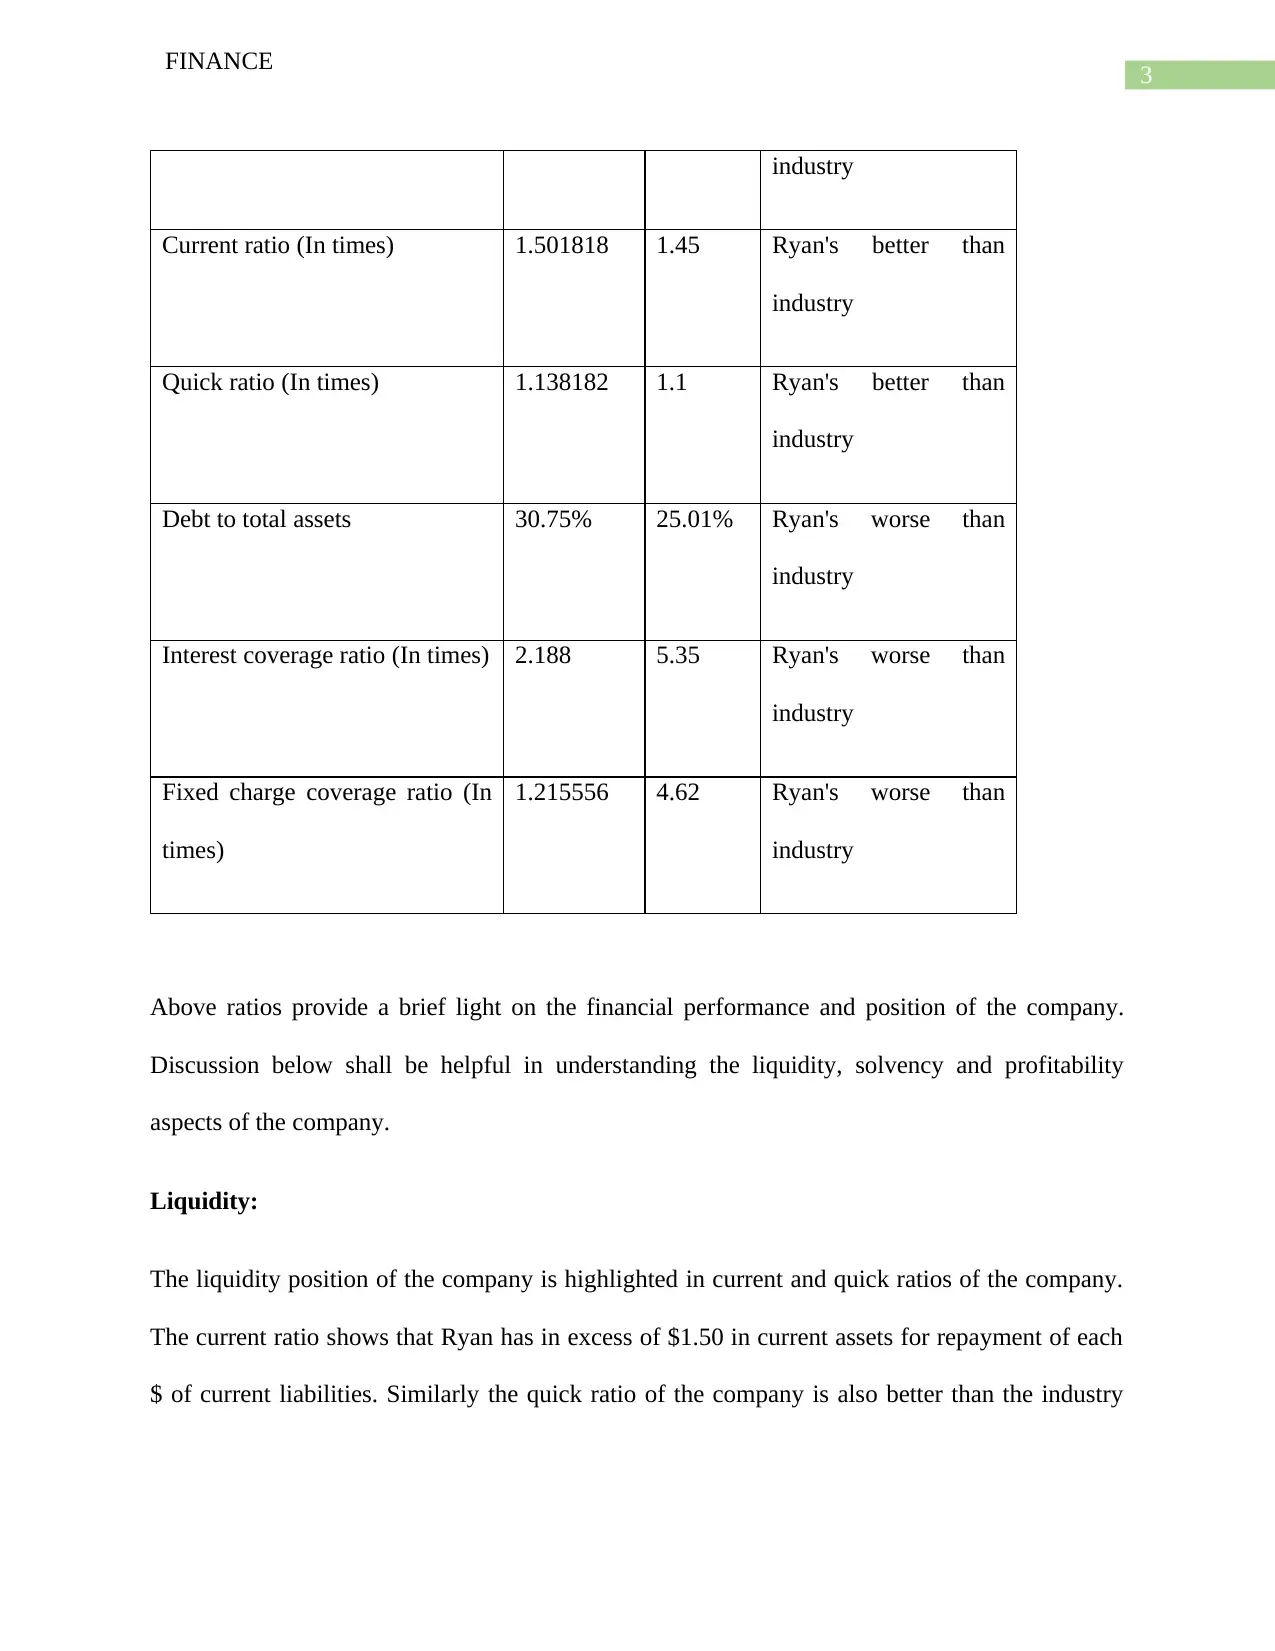
This finance report offers a comprehensive analysis of Ryan Co.'s financial performance, addressing key aspects such as liquidity, solvency, and profitability. The report begins with a detailed ratio analysis, comparing Ryan Co.'s performance against industry averages and identifying areas of strength and weakness. It then delves into break-even point calculations, degree of operating leverage, and degree of financial leverage to assess the company's risk profile. Furthermore, the report examines the company's financing needs and proposes external funding strategies. The analysis extends to credit policy changes, evaluating their impact on profitability and making recommendations based on the findings. The report utilizes financial statements, calculations, and industry benchmarks to provide a well-rounded assessment of Ryan Co.'s financial health, offering valuable insights for decision-making and strategic planning.

Running head: FINANACE
Finance
Name of the Student:
Name of the University:
Authors Note:
Finance
Name of the Student:
Name of the University:
Authors Note:
Paraphrase This Document
Need a fresh take? Get an instant paraphrase of this document with our AI Paraphraser

1
FINANCE
Contents
Problem 1:........................................................................................................................................2
Requirement 1:.............................................................................................................................2
Requirement 2:.............................................................................................................................4
Requirement 3:.............................................................................................................................7
Requirement 4:.............................................................................................................................8
Requirement 5:.............................................................................................................................9
Problem 2:......................................................................................................................................10
Problem 5:......................................................................................................................................13
References:....................................................................................................................................16

2
FINANCE
Problem 1:
Requirement 1:
Ratios are all % except those specifically mentioned otherwise.
Ratios Ryan Co. Industry Remark
Profit margin 4.24% 5.75% Ryan's worse than
industry
Return on assets 5.54% 6.90% Ryan's worse than
industry
Return on equity 10.31% 9.20% Ryan's better than
industry
Receivables turnover (In times) 2.333333 4.35 Ryan's worse than
industry
Inventory turnover (In times) 7 6.5 Ryan's better than
industry
Accounts payable turnover (in
times)
1.909091 3.8 Ryan's worse than
industry
Capital asset turnover (in times) 1.75 1.85 Ryan's worse than
industry
Total asset turnover (In times) 0.861009 1.2 Ryan's worse than
⊘ This is a preview!⊘
Do you want full access?
Subscribe today to unlock all pages.

Trusted by 1+ million students worldwide

3
FINANCE
industry
Current ratio (In times) 1.501818 1.45 Ryan's better than
industry
Quick ratio (In times) 1.138182 1.1 Ryan's better than
industry
Debt to total assets 30.75% 25.01% Ryan's worse than
industry
Interest coverage ratio (In times) 2.188 5.35 Ryan's worse than
industry
Fixed charge coverage ratio (In
times)
1.215556 4.62 Ryan's worse than
industry
Above ratios provide a brief light on the financial performance and position of the company.
Discussion below shall be helpful in understanding the liquidity, solvency and profitability
aspects of the company.
Liquidity:
The liquidity position of the company is highlighted in current and quick ratios of the company.
The current ratio shows that Ryan has in excess of $1.50 in current assets for repayment of each
$ of current liabilities. Similarly the quick ratio of the company is also better than the industry
Paraphrase This Document
Need a fresh take? Get an instant paraphrase of this document with our AI Paraphraser

4
FINANCE
average which further suggest that the company has a better liquidity position than the industry
average.
Debt asset utilization:
The accounts receivables turnover ratio, accounts payable turnover ratio, capital asset turnover
ratio of Ryan are not up to the mark with the industry average. Thus, the debt asset utilization of
the company needs to be improved in the future. The company should take necessary steps to
improve the utilization of debt and assets in the business operations of the company (Kaplan &
Atkinson, 2015).
Profitability:
The profit margin of the company is 4.24% is less than the industry profit margin of 5.75%.
Return on assets of the company at 5.54% is also significantly less in comparison of 6.90% of
industry average. The interest coverage and fixed charge coverage ratios of Ryan are even worst
with 2.18 times and 1.48 times respectively as opposed to 5.35 times and 4.62 times respectively
for the industry.
Requirement 2:
Breakeven point in sales:
Overall Break Even Point (BEP)
PV ratio (Contribution x 100 Sales) 40
Fixed costs 2,100,000.
00
BEP in sales ($) 5,250,000.

5
FINANCE
00
Degree of operating leverage (Contribution margin / Net operating income):
Sales 7000000
Variable Costs 4200000
Contribution Margin 2800000
Fixed Costs 2100000
EBIT (operating Income) 700000
DOL 4
Degree of financial leverage (EBIT / EBIT – Interest) and degree of combined leverage are
calculated below:
RYAN Question 2 DFL
EBIT 700000
Interest expense 250000
⊘ This is a preview!⊘
Do you want full access?
Subscribe today to unlock all pages.

Trusted by 1+ million students worldwide

6
FINANCE
EBT 450000
Taxes 153000
EAT 297000
No. of Shares 1700000
EPS (EAT/ total shares) 0.174706
Degree of Financial Leverage
(DFL)
1.555556
Degree of Combined Leverage
(DCL)
6.222222
Recalculation of DFL and DCL:
RYAN Question 2 DFL
EBIT 700000
Interest expense 450000
FINANCE
EBT 450000
Taxes 153000
EAT 297000
No. of Shares 1700000
EPS (EAT/ total shares) 0.174706
Degree of Financial Leverage
(DFL)
1.555556
Degree of Combined Leverage
(DCL)
6.222222
Recalculation of DFL and DCL:
RYAN Question 2 DFL
EBIT 700000
Interest expense 450000
Paraphrase This Document
Need a fresh take? Get an instant paraphrase of this document with our AI Paraphraser

7
FINANCE
EBT 250000
Taxes 85000
EAT 165000
No. of Shares 1700000
EPS (EAT/ total shares) 0.097059
Degree of Financial Leverage (DFL) 2.8
Degree of Combined Leverage (DCL) 11.2
Requirement 3:
The different ratios calculated in the first part of the document showed that though Ryan has a
slightly better liquidity position compared to the industry average however, the fixed charge
coverage and interest coverage ratios of the company are not at all up-to the industry standards.
In addition the degree of financial leverage of the company shows that the company does not
enjoy a significantly stable financial and liquidity position. Thus, the banks have to be very
cautious while deciding to give long term loan to the company (Richards, 2017).
Requirement 4:
RYAN Question 2 2012 2013
(budgeted)

8
FINANCE
Sales 7000000 8400000
Variable Costs 4200000 5040000
Contribution Margin 2800000 3360000
Fixed Costs 2100000 2100000
EBIT (operating Income) 700000 1260000
Thus, company requires to fund variable expenses
Particulars Amount
($)
Amount
($)
Variable expenses 5040000
Less:
Inventories 1000000
Cash 50000
Marketable securities 80000
Accounts receivable (after adjusting 5% as doubtful and bad debts) 2850000
⊘ This is a preview!⊘
Do you want full access?
Subscribe today to unlock all pages.

Trusted by 1+ million students worldwide

9
FINANCE
3980000
Requirements of external funds 1060000
Thus, Ryan would need external fund to the tune of $1,060,000 to finance the expected increase
in production volume of the company to satisfy the increased demand in 2013.
Requirement 5:
a. In case the company would have been at full capacity then the amount of required funds for
expansion would have been significantly higher as the company would have to invest in fixed
assets including plant and equipment and other fixed assets.
b. The required funds would have increased by the amount of extra dividend that the company
would have paid to the shareholders subsequent to the increase in dividend payout ratio.
c. No external funds would have required in such scenario (Laudon & Laudon, 2016).
Paraphrase This Document
Need a fresh take? Get an instant paraphrase of this document with our AI Paraphraser

10
FINANCE
Problem 2:
Part a:
The breakeven point before and after expansion:
PHELPS Before Expansion After Expansion
Sales 5,000,000.
00
6,000,00
0.00
Variable Costs 2,500,000.
00
3,000,00
0.00
Contribution
Margin
2,500,000.
00
3,000,00
0.00
Fixed Costs 1,800,000.
00
2,300,00
0.00
EBIT (operating
Income)
700,000.
00
700,0
00.00
Breakeven point (BEP)
PV ratio 5
0.00 50.00
Fixed costs 1,800,000. 2,300,00

11
FINANCE
00 0.00
BEP 3,600,000.
00
4,600,00
0.00
Part b:
Degree of operating leverage (Contribution / EBIT):
PHELPS Before
Expansion
After
Expansion
Sales 5,000,000.00 6,000,000.00
Variable Costs 2,500,000.00 3,000,000.00
Contribution Margin 2,500,000.00 3,000,000.00
Fixed Costs 1,800,000.00 2,300,000.00
EBIT (operating Income) 700,000.00 700,000.00
DOL 3.57 4.29
Part c:
⊘ This is a preview!⊘
Do you want full access?
Subscribe today to unlock all pages.

Trusted by 1+ million students worldwide
1 out of 13
Related Documents

Your All-in-One AI-Powered Toolkit for Academic Success.
 +13062052269
info@desklib.com
Available 24*7 on WhatsApp / Email
Unlock your academic potential
Copyright © 2020–2025 A2Z Services. All Rights Reserved. Developed and managed by ZUCOL.