Comprehensive Financial Analysis of SkyStudio: A Detailed Report
VerifiedAdded on 2023/04/22
|15
|2621
|312
Report
AI Summary
This report presents a financial analysis of SkyStudio, including ratio analysis, variance analysis, and cost-volume-profit (CVP) analysis. The ratio analysis assesses profitability, financial stability, and asset utilization, revealing areas where SkyStudio outperforms industry averages and areas needing improvement, such as return on equity and liquidity management. The variance analysis identifies significant differences between budgeted and actual figures, particularly in cost of sales and administrative expenses, warranting further investigation. The CVP analysis calculates the breakeven point and profitability at different sales levels. The report concludes with recommendations for enhancing financial performance and strategic decision-making. Desklib provides a platform for students to access similar solved assignments and study resources.
Running Head: FINANCIAL ANALYSIS OF SKYSTUDIO
0
FINANCIAL ANALYSIS OF SKYSTUDIO
0
FINANCIAL ANALYSIS OF SKYSTUDIO
Paraphrase This Document
Need a fresh take? Get an instant paraphrase of this document with our AI Paraphraser

FINANCIAL ANALYSIS OF SKYSTUDIO 1
FINANCIAL ANALYSIS OF SKYSTUDIO 2
Table of Contents
Objective....................................................................................................................................3
Financial Analysis Purpose........................................................................................................3
Structure of the report................................................................................................................3
Ratio Analysis............................................................................................................................3
Assessment of the ratios.........................................................................................................3
Profitability.........................................................................................................................3
Financial Stability...............................................................................................................4
Asset utilisation...................................................................................................................5
Conclusion..................................................................................................................................5
Summary.................................................................................................................................5
Limitations of the financial analysis.......................................................................................5
Variance Analysis......................................................................................................................5
Part 1.......................................................................................................................................6
Part 2.......................................................................................................................................6
CVP analysis..............................................................................................................................7
A.............................................................................................................................................7
B.............................................................................................................................................8
C.............................................................................................................................................8
D.............................................................................................................................................9
⊘ This is a preview!⊘
Do you want full access?
Subscribe today to unlock all pages.
Trusted by 1+ million students worldwide
FINANCIAL ANALYSIS OF SKYSTUDIO 3
Objective
The objective of this report is to determine the entire financial analysis including the
budgeted analysis of the company Sky Studio. The objective of carrying out the financial
analysis is to get a competitive advantage over the competitors and to be stable. With the
assistance of the analysis the company can found out whether the company is worthy for
investment from the point of view of investors. Further the financial analysis will also
determine how the company operates and what variances can be found out and must rectify
the same.
Financial Analysis Purpose
Financial analysis is the method used by the management of the company for the
purpose of evaluation of business and the projects, budgets and the entities which are dealing
in the financial means to determine their performance and long term sustainability. The four
pillars of the organization can be judged by the financial analysis, as to whether the company
is profitable, solvent, liquidity and the efficient or not to make an investment for. The
financial analysis is carried out with the help of the financial statements such as income
statement, balance sheet, and cash flow statement (Robinson Henry,Pirie & Broihahn, 2015).
Structure of the report
The structure of the report is bifurcated in so many parts and it moves basically with
the financial analysis is necessary from the point of view of not only management but also
from the perspective of the shareholders and the investors. They compare the data either with
the industry comparison or with the previous years. Moreover his report also talks about the
details of the purpose of the financial statements followed by the ratio analysis. The budgets
Paraphrase This Document
Need a fresh take? Get an instant paraphrase of this document with our AI Paraphraser
FINANCIAL ANALYSIS OF SKYSTUDIO 4
are prepared according to the assumptions and the requirements and the final CVP analysis is
also undertaken to get to know the movement of the costs.
Ratio Analysis
Ratio analysis is the technique which is used to determine the ability of the company
on several categories. A sound company is a combination of the efficiency, profitability,
solvency and the relevant market position and liquidity. The company is required to excel
these categories in order to satisfy the customers and the investors (Uechi Akutsu, Stanley,
Marcus & Kenett, 2015).
Assessment of the ratios
Profitability
The profitability ratios of the company are calculates to measure the financial
performance of the company in terms of the profitability over the period of years or in
comparison to the industry averages. Profit is the king of the organisation which keeps the
organisation stable and on-going and therefore the investors are also interested in calculating
the profitability ratio of the company (Williams & Dobelman, 2017).
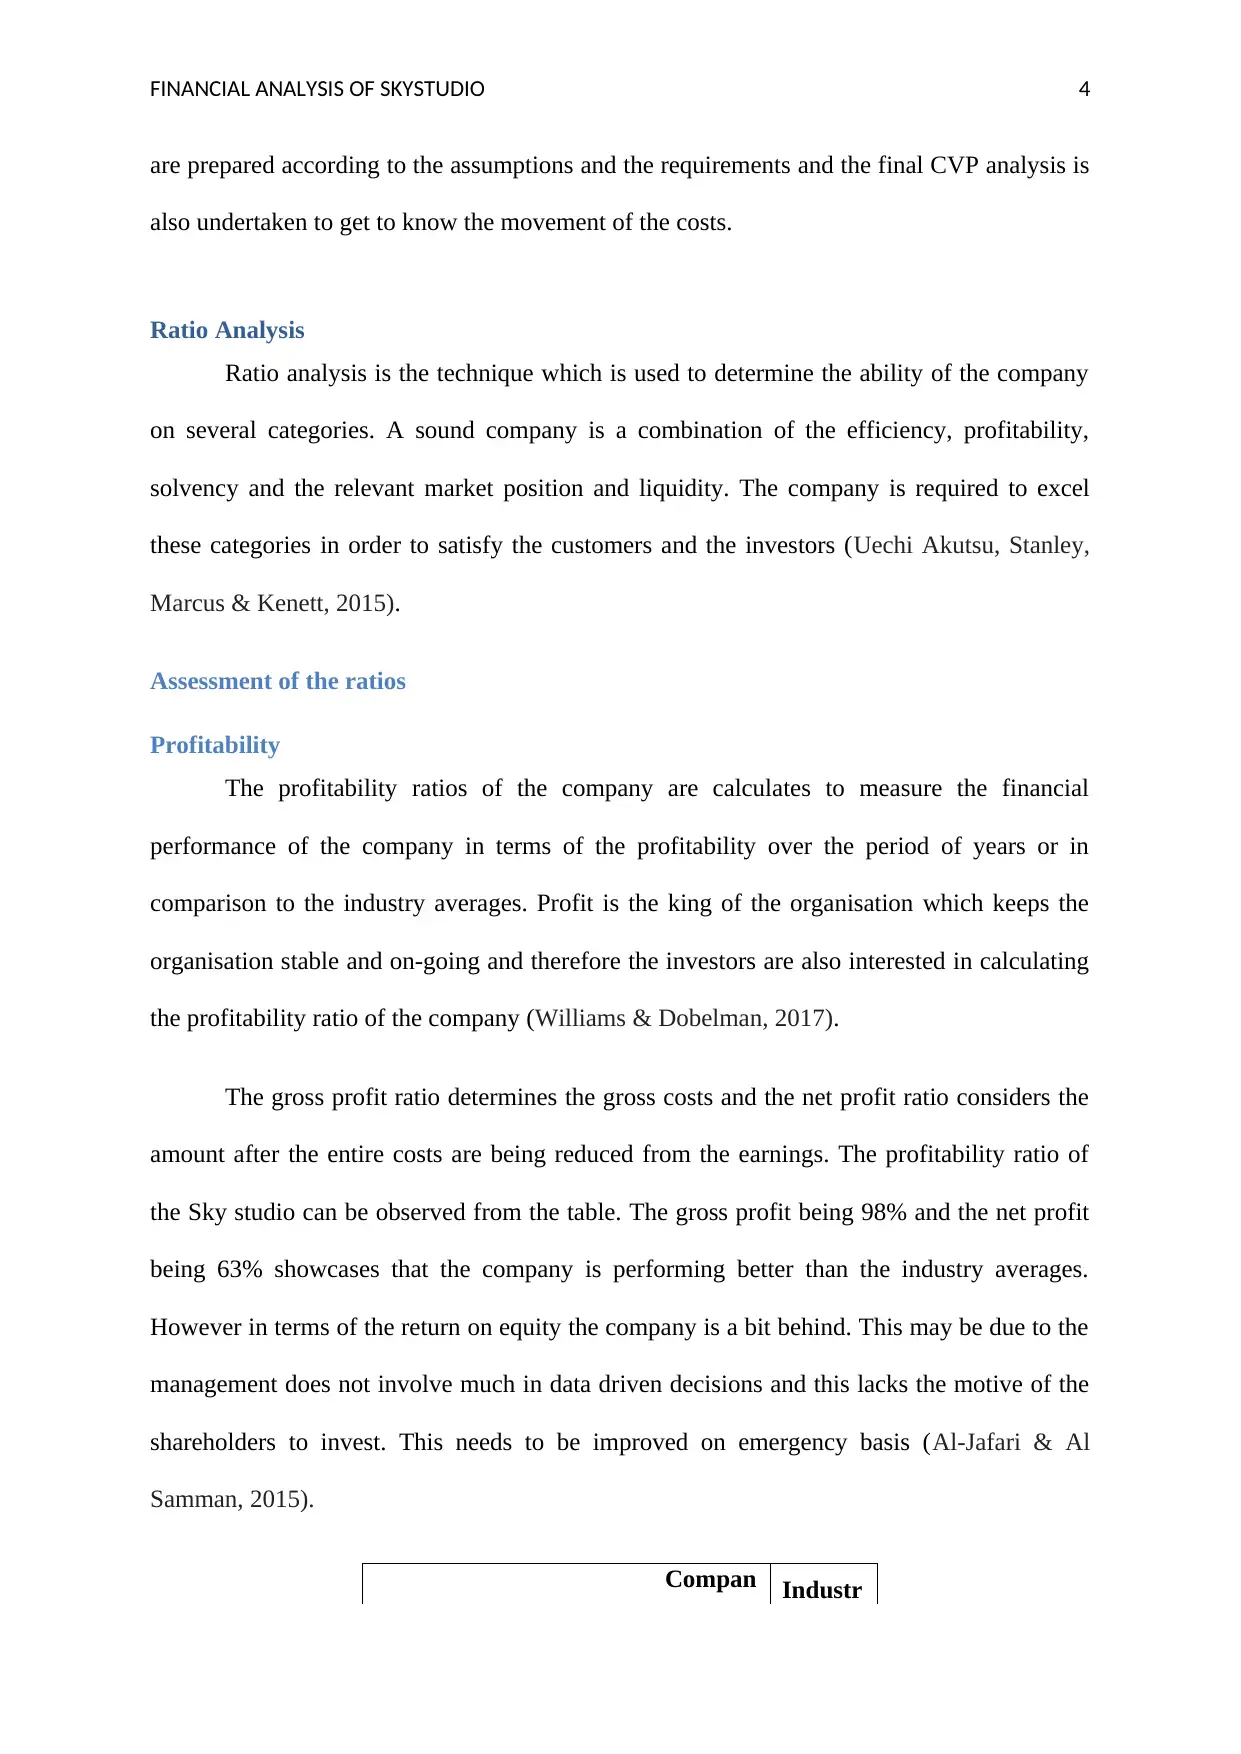
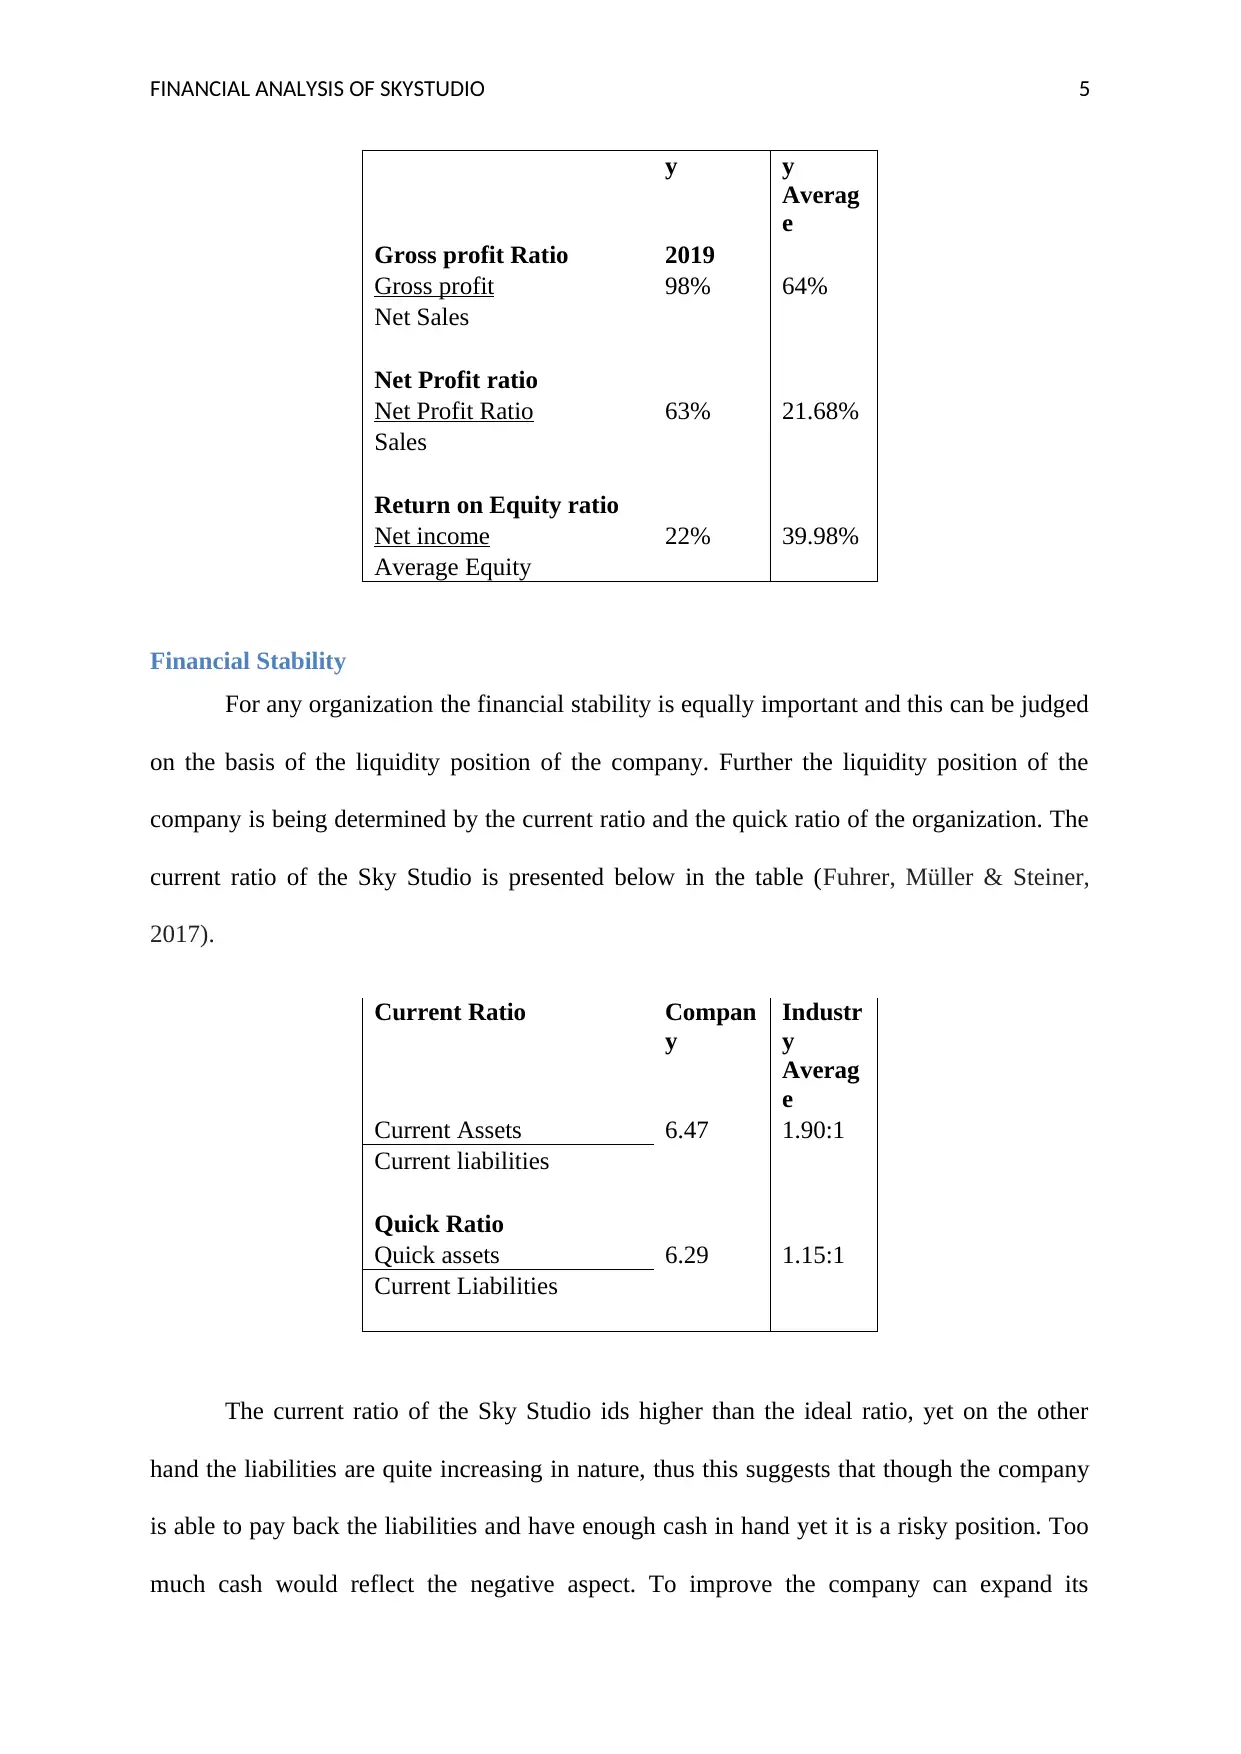
The gross profit ratio determines the gross costs and the net profit ratio considers the
amount after the entire costs are being reduced from the earnings. The profitability ratio of
the Sky studio can be observed from the table. The gross profit being 98% and the net profit
being 63% showcases that the company is performing better than the industry averages.
However in terms of the return on equity the company is a bit behind. This may be due to the
management does not involve much in data driven decisions and this lacks the motive of the
shareholders to invest. This needs to be improved on emergency basis (Al-Jafari & Al
Samman, 2015).
Compan Industr
are prepared according to the assumptions and the requirements and the final CVP analysis is
also undertaken to get to know the movement of the costs.
Ratio Analysis
Ratio analysis is the technique which is used to determine the ability of the company
on several categories. A sound company is a combination of the efficiency, profitability,
solvency and the relevant market position and liquidity. The company is required to excel
these categories in order to satisfy the customers and the investors (Uechi Akutsu, Stanley,
Marcus & Kenett, 2015).
Assessment of the ratios
Profitability
The profitability ratios of the company are calculates to measure the financial
performance of the company in terms of the profitability over the period of years or in
comparison to the industry averages. Profit is the king of the organisation which keeps the
organisation stable and on-going and therefore the investors are also interested in calculating
the profitability ratio of the company (Williams & Dobelman, 2017).
The gross profit ratio determines the gross costs and the net profit ratio considers the
amount after the entire costs are being reduced from the earnings. The profitability ratio of
the Sky studio can be observed from the table. The gross profit being 98% and the net profit
being 63% showcases that the company is performing better than the industry averages.
However in terms of the return on equity the company is a bit behind. This may be due to the
management does not involve much in data driven decisions and this lacks the motive of the
shareholders to invest. This needs to be improved on emergency basis (Al-Jafari & Al
Samman, 2015).
Compan Industr
FINANCIAL ANALYSIS OF SKYSTUDIO 5
y y
Averag
e
Gross profit Ratio 2019
Gross profit 98% 64%
Net Sales
Net Profit ratio
Net Profit Ratio 63% 21.68%
Sales
Return on Equity ratio
Net income 22% 39.98%
Average Equity
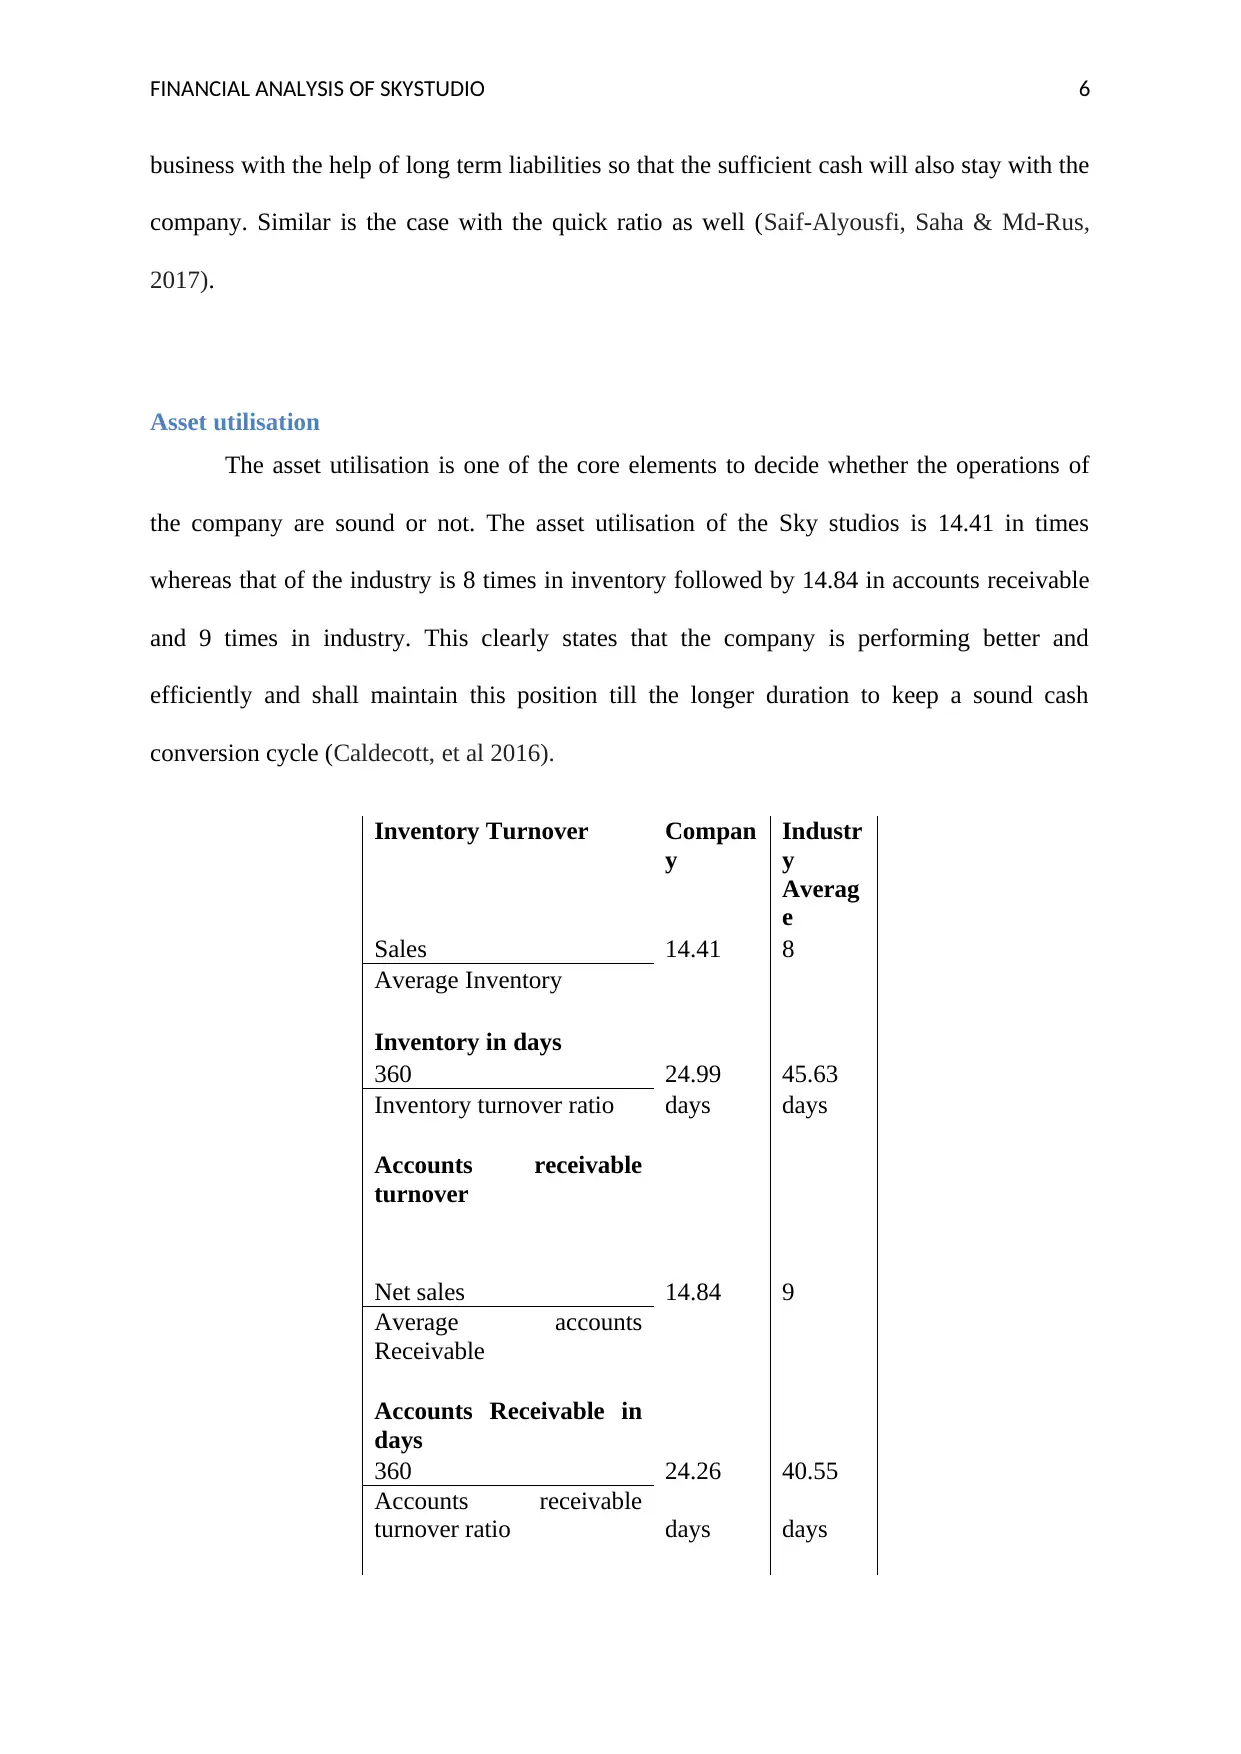
Financial Stability
For any organization the financial stability is equally important and this can be judged
on the basis of the liquidity position of the company. Further the liquidity position of the
company is being determined by the current ratio and the quick ratio of the organization. The
current ratio of the Sky Studio is presented below in the table (Fuhrer, Müller & Steiner,
2017).
Current Ratio Compan
y
Industr
y
Averag
e
Current Assets 6.47 1.90:1
Current liabilities
Quick Ratio
Quick assets 6.29 1.15:1
Current Liabilities
The current ratio of the Sky Studio ids higher than the ideal ratio, yet on the other
hand the liabilities are quite increasing in nature, thus this suggests that though the company
is able to pay back the liabilities and have enough cash in hand yet it is a risky position. Too
much cash would reflect the negative aspect. To improve the company can expand its
y y
Averag
e
Gross profit Ratio 2019
Gross profit 98% 64%
Net Sales
Net Profit ratio
Net Profit Ratio 63% 21.68%
Sales
Return on Equity ratio
Net income 22% 39.98%
Average Equity
Financial Stability
For any organization the financial stability is equally important and this can be judged
on the basis of the liquidity position of the company. Further the liquidity position of the
company is being determined by the current ratio and the quick ratio of the organization. The
current ratio of the Sky Studio is presented below in the table (Fuhrer, Müller & Steiner,
2017).
Current Ratio Compan
y
Industr
y
Averag
e
Current Assets 6.47 1.90:1
Current liabilities
Quick Ratio
Quick assets 6.29 1.15:1
Current Liabilities
The current ratio of the Sky Studio ids higher than the ideal ratio, yet on the other
hand the liabilities are quite increasing in nature, thus this suggests that though the company
is able to pay back the liabilities and have enough cash in hand yet it is a risky position. Too
much cash would reflect the negative aspect. To improve the company can expand its
⊘ This is a preview!⊘
Do you want full access?
Subscribe today to unlock all pages.
Trusted by 1+ million students worldwide
FINANCIAL ANALYSIS OF SKYSTUDIO 6
business with the help of long term liabilities so that the sufficient cash will also stay with the
company. Similar is the case with the quick ratio as well (Saif-Alyousfi, Saha & Md-Rus,
2017).
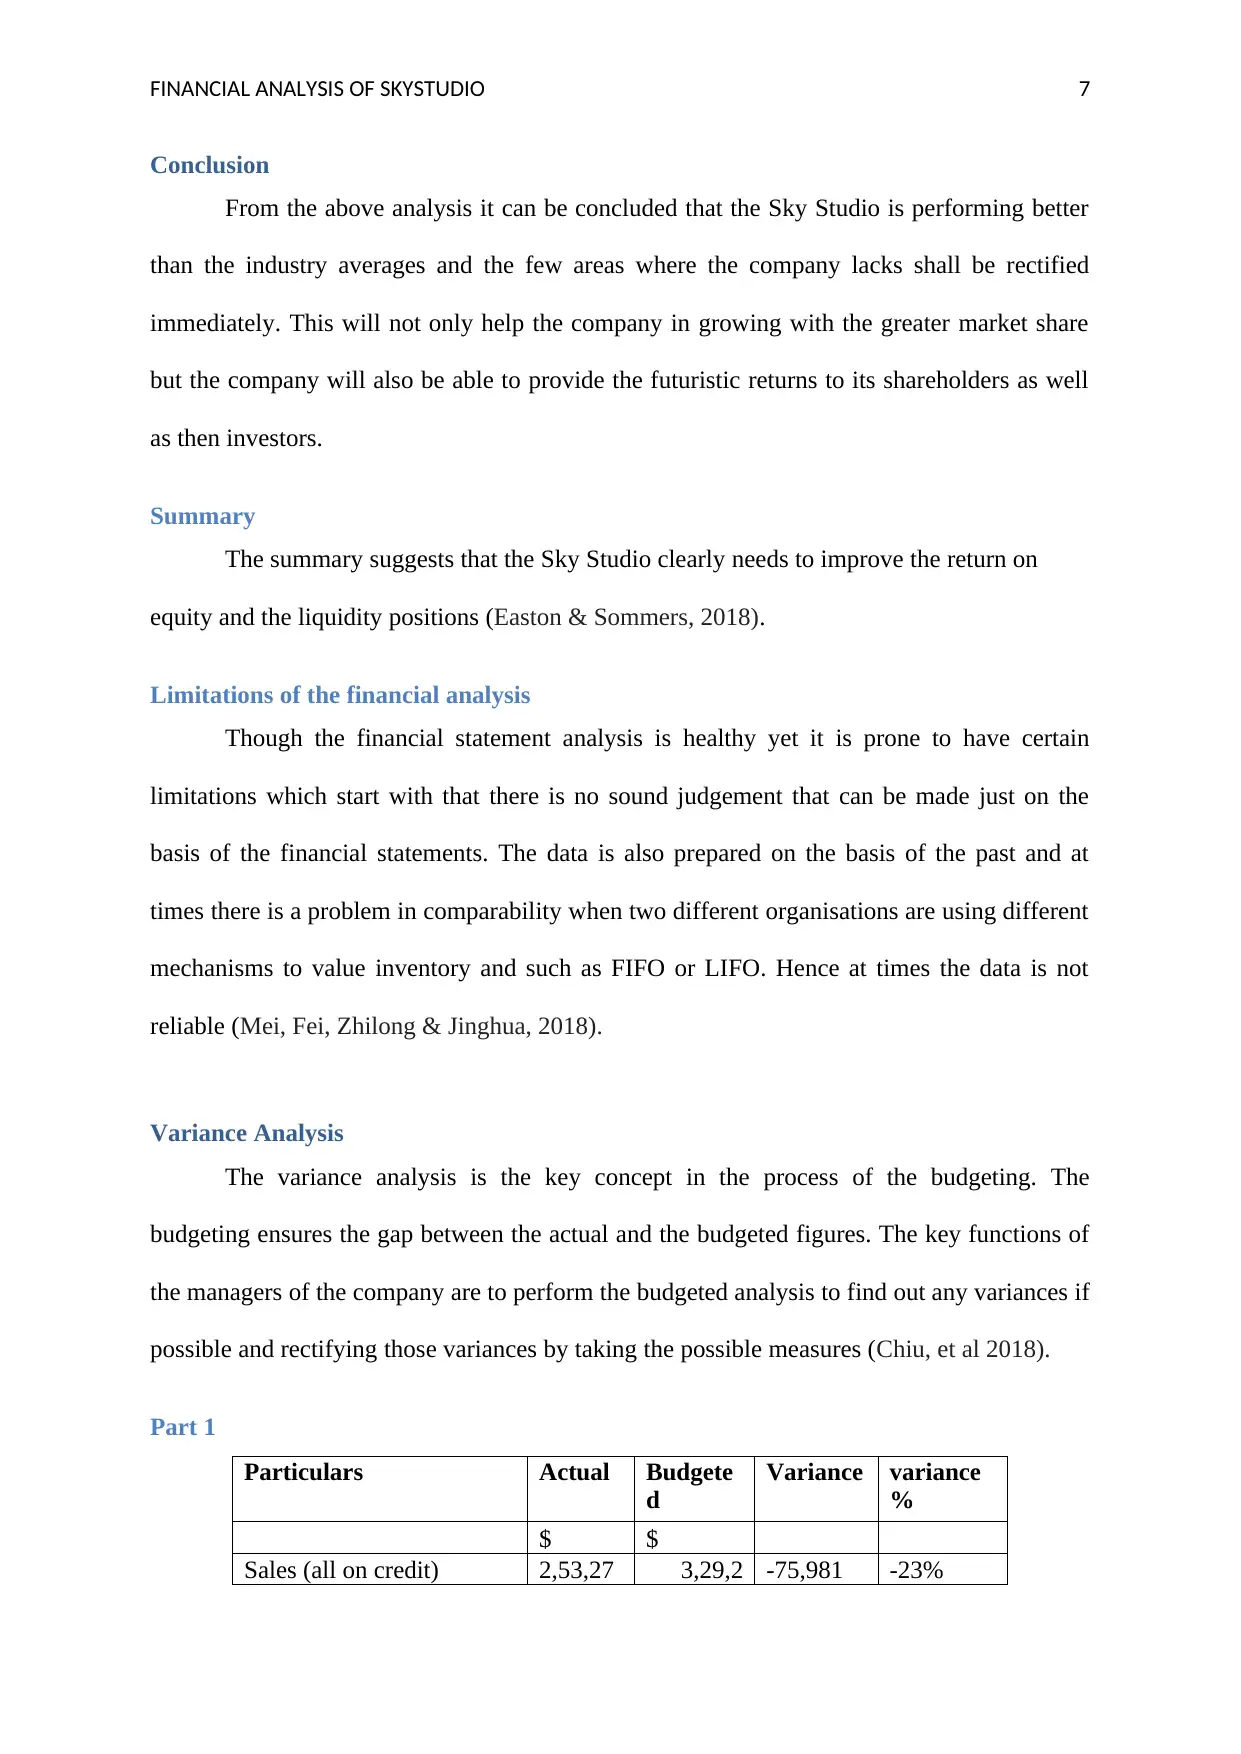
Asset utilisation
The asset utilisation is one of the core elements to decide whether the operations of
the company are sound or not. The asset utilisation of the Sky studios is 14.41 in times
whereas that of the industry is 8 times in inventory followed by 14.84 in accounts receivable
and 9 times in industry. This clearly states that the company is performing better and
efficiently and shall maintain this position till the longer duration to keep a sound cash
conversion cycle (Caldecott, et al 2016).
Inventory Turnover Compan
y
Industr
y
Averag
e
Sales 14.41 8
Average Inventory
Inventory in days
360 24.99 45.63
Inventory turnover ratio days days
Accounts receivable
turnover
Net sales 14.84 9
Average accounts
Receivable
Accounts Receivable in
days
360 24.26 40.55
Accounts receivable
turnover ratio days days
business with the help of long term liabilities so that the sufficient cash will also stay with the
company. Similar is the case with the quick ratio as well (Saif-Alyousfi, Saha & Md-Rus,
2017).
Asset utilisation
The asset utilisation is one of the core elements to decide whether the operations of
the company are sound or not. The asset utilisation of the Sky studios is 14.41 in times
whereas that of the industry is 8 times in inventory followed by 14.84 in accounts receivable
and 9 times in industry. This clearly states that the company is performing better and
efficiently and shall maintain this position till the longer duration to keep a sound cash
conversion cycle (Caldecott, et al 2016).
Inventory Turnover Compan
y
Industr
y
Averag
e
Sales 14.41 8
Average Inventory
Inventory in days
360 24.99 45.63
Inventory turnover ratio days days
Accounts receivable
turnover
Net sales 14.84 9
Average accounts
Receivable
Accounts Receivable in
days
360 24.26 40.55
Accounts receivable
turnover ratio days days
Paraphrase This Document
Need a fresh take? Get an instant paraphrase of this document with our AI Paraphraser
FINANCIAL ANALYSIS OF SKYSTUDIO 7
Conclusion
From the above analysis it can be concluded that the Sky Studio is performing better
than the industry averages and the few areas where the company lacks shall be rectified
immediately. This will not only help the company in growing with the greater market share
but the company will also be able to provide the futuristic returns to its shareholders as well
as then investors.
Summary
The summary suggests that the Sky Studio clearly needs to improve the return on
equity and the liquidity positions (Easton & Sommers, 2018).
Limitations of the financial analysis
Though the financial statement analysis is healthy yet it is prone to have certain
limitations which start with that there is no sound judgement that can be made just on the
basis of the financial statements. The data is also prepared on the basis of the past and at
times there is a problem in comparability when two different organisations are using different
mechanisms to value inventory and such as FIFO or LIFO. Hence at times the data is not
reliable (Mei, Fei, Zhilong & Jinghua, 2018).
Variance Analysis
The variance analysis is the key concept in the process of the budgeting. The
budgeting ensures the gap between the actual and the budgeted figures. The key functions of
the managers of the company are to perform the budgeted analysis to find out any variances if
possible and rectifying those variances by taking the possible measures (Chiu, et al 2018).
Part 1
Particulars Actual Budgete
d
Variance variance
%
$ $
Sales (all on credit) 2,53,27 3,29,2 -75,981 -23%
FINANCIAL ANALYSIS OF SKYSTUDIO 8
0 51
Cost of Sales 5,360
6,9
68 -1,608 -23%
Gross Profit
2,47,91
0 3,22,283 -74,373 -23%
Selling Expenses
Selling Expenses 5,000
5,0
00 0 -38%
Depreciation 2,342
2,3
89 -47 -2%
Admin and General
Expenses 14180
16,7
32 -2,552 -15%
Total expenses 21,522 24,121 -2,599 -11%
EBIT
2,26,38
8 2,98,162 -71,774 -24%
Interest 5,512 5,512 0 0%
EBT
2,20,87
6 2,92,650 -71,774 -25%
Tax 61845 81942 -20,097 -25%
Other income 275 300
profit after tax
1,59,03
1 2,10,708 -51,677 -25%
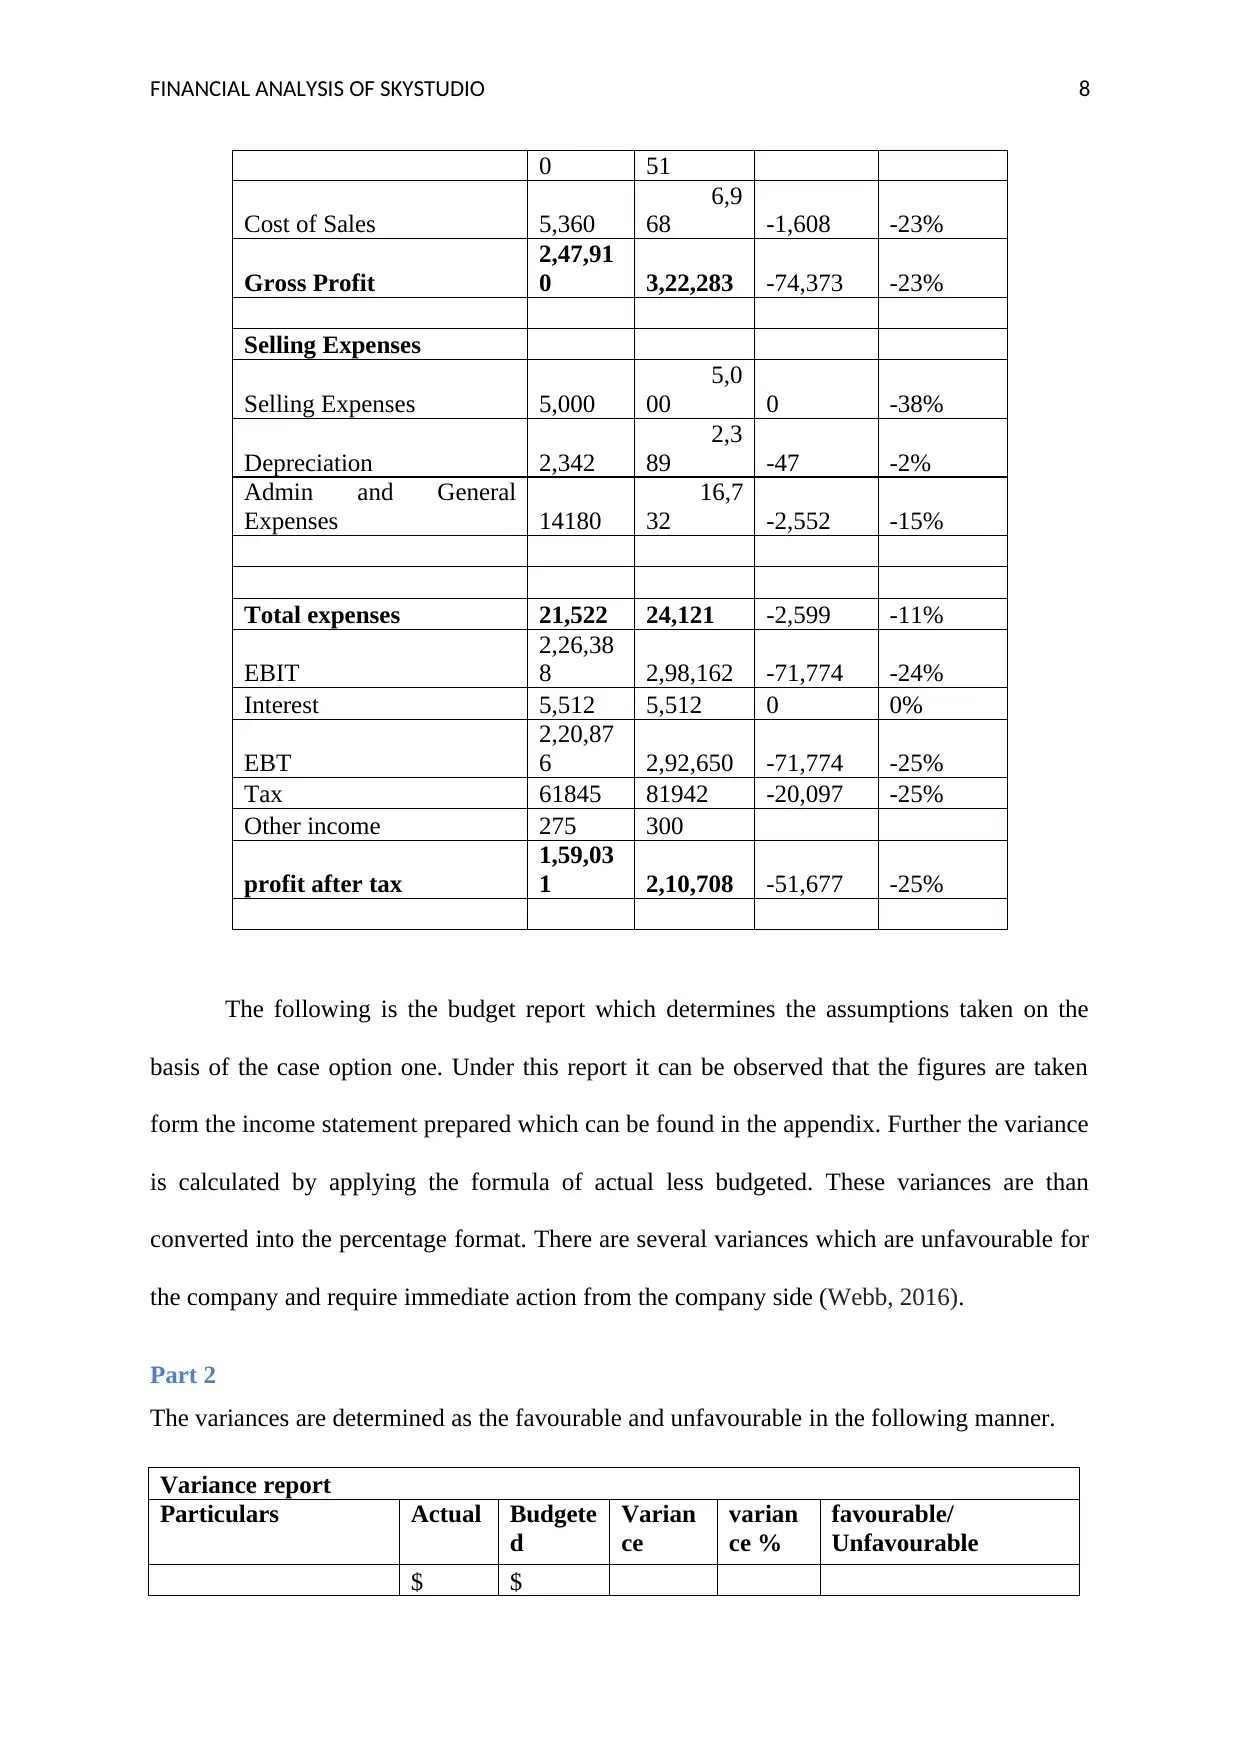
The following is the budget report which determines the assumptions taken on the
basis of the case option one. Under this report it can be observed that the figures are taken
form the income statement prepared which can be found in the appendix. Further the variance
is calculated by applying the formula of actual less budgeted. These variances are than
converted into the percentage format. There are several variances which are unfavourable for
the company and require immediate action from the company side (Webb, 2016).
Part 2
The variances are determined as the favourable and unfavourable in the following manner.
Variance report
Particulars Actual Budgete
d
Varian
ce
varian
ce %
favourable/
Unfavourable
$ $
0 51
Cost of Sales 5,360
6,9
68 -1,608 -23%
Gross Profit
2,47,91
0 3,22,283 -74,373 -23%
Selling Expenses
Selling Expenses 5,000
5,0
00 0 -38%
Depreciation 2,342
2,3
89 -47 -2%
Admin and General
Expenses 14180
16,7
32 -2,552 -15%
Total expenses 21,522 24,121 -2,599 -11%
EBIT
2,26,38
8 2,98,162 -71,774 -24%
Interest 5,512 5,512 0 0%
EBT
2,20,87
6 2,92,650 -71,774 -25%
Tax 61845 81942 -20,097 -25%
Other income 275 300
profit after tax
1,59,03
1 2,10,708 -51,677 -25%
The following is the budget report which determines the assumptions taken on the
basis of the case option one. Under this report it can be observed that the figures are taken
form the income statement prepared which can be found in the appendix. Further the variance
is calculated by applying the formula of actual less budgeted. These variances are than
converted into the percentage format. There are several variances which are unfavourable for
the company and require immediate action from the company side (Webb, 2016).
Part 2
The variances are determined as the favourable and unfavourable in the following manner.
Variance report
Particulars Actual Budgete
d
Varian
ce
varian
ce %
favourable/
Unfavourable
$ $
⊘ This is a preview!⊘
Do you want full access?
Subscribe today to unlock all pages.
Trusted by 1+ million students worldwide
FINANCIAL ANALYSIS OF SKYSTUDIO 9
Sales (all on credit)
2,53,27
0
3,29,2
51 -75,981 -23% Unfavourable
Cost of Sales 5,360
6,
968 -1,608 -23% Unfavourable
Gross Profit
2,47,91
0 3,22,283 -74,373 -23% Unfavourable
Selling Expenses
Selling Expenses 5,000
5,
000 0 -38% Unfavourable
Depreciation 2,342
2,
389 -47 -2% Unfavourable
Admin and General
Expenses 14180
16,7
32 -2,552 -15% Unfavourable
Total expenses 21,522 24,121 -2,599 -11% Unfavourable
EBIT
2,26,38
8 2,98,162 -71,774 -24% Unfavourable
Interest 5,512 5,512 0 0% Unfavourable
EBT
2,20,87
6 2,92,650 -71,774 -25% Unfavourable
Tax 61845 81942 -20,097 -25% Unfavourable
Other income 275 300 Unfavourable
profit after tax
1,59,03
1 2,10,708 -51,677 -25% Unfavourable
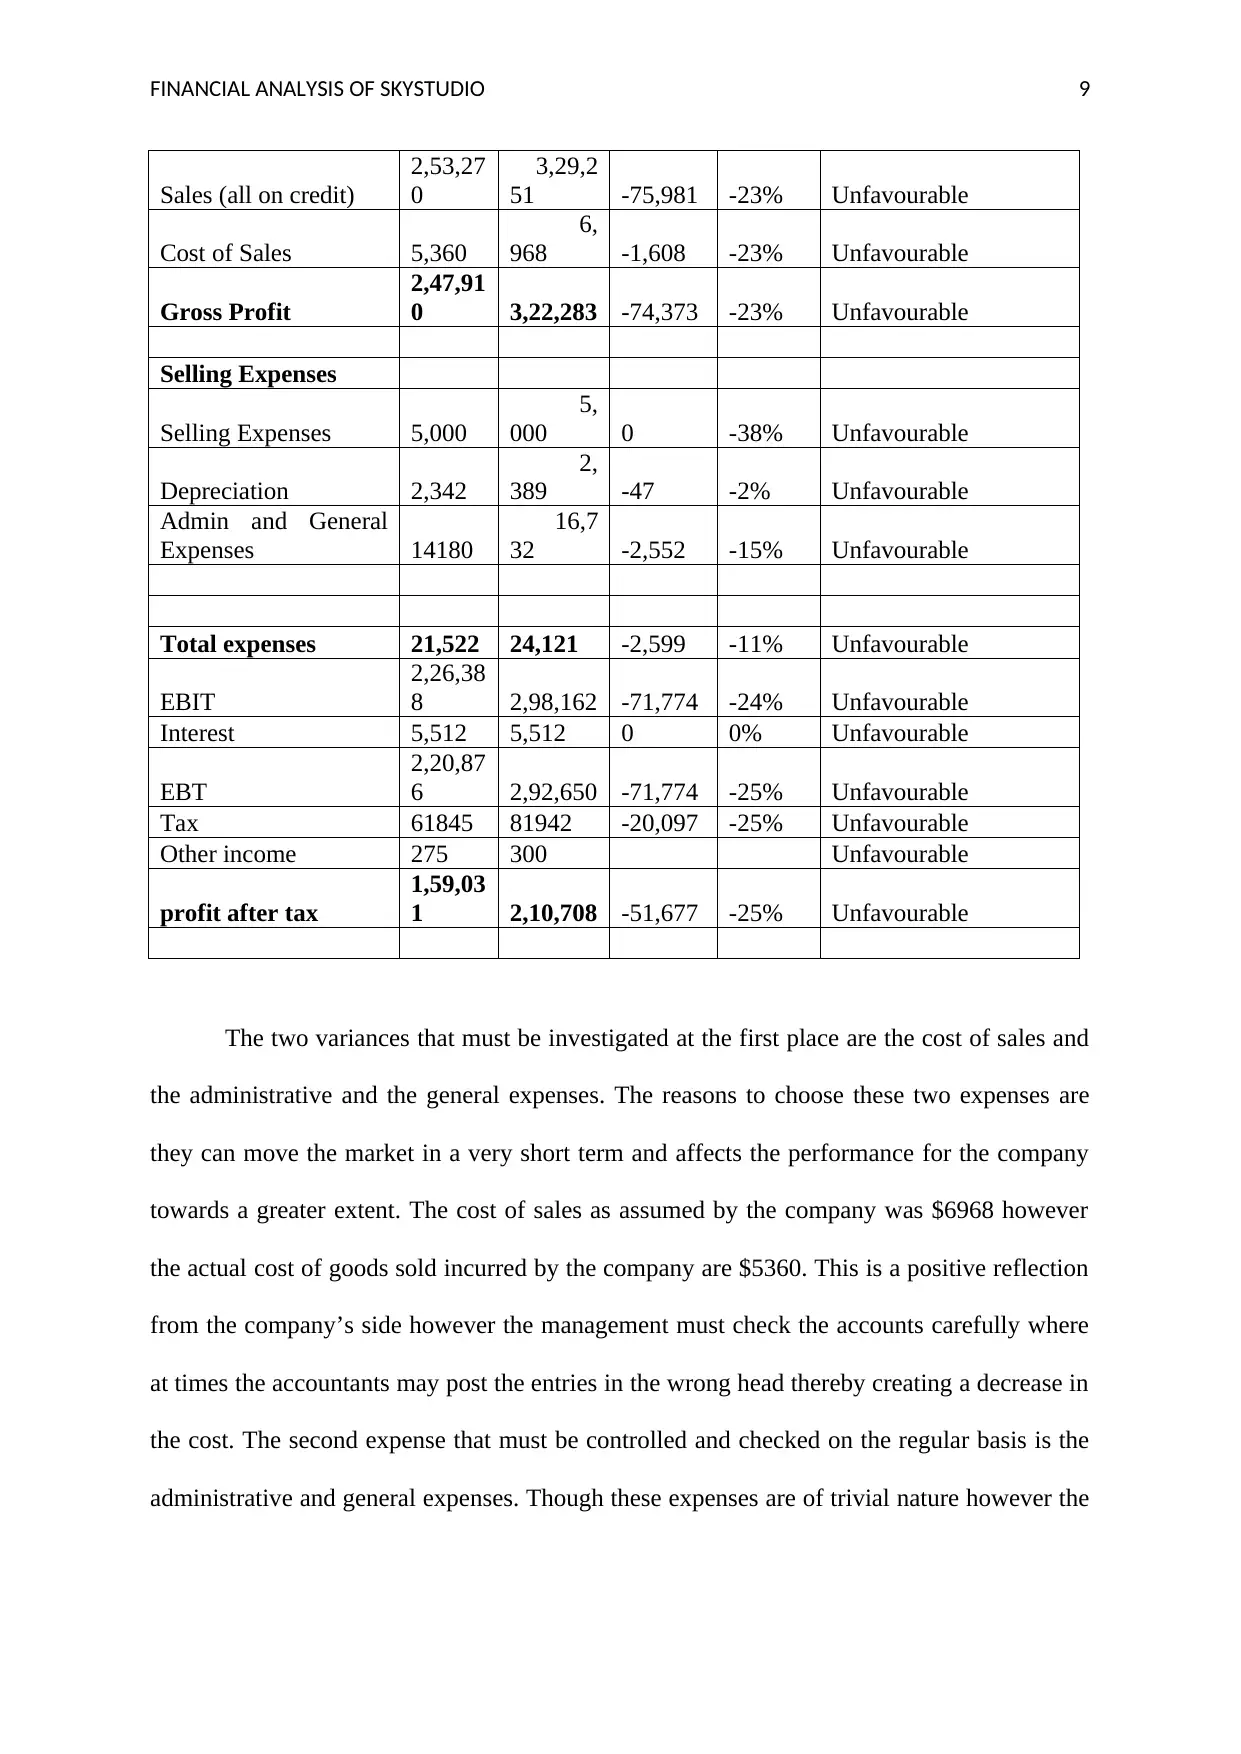
The two variances that must be investigated at the first place are the cost of sales and
the administrative and the general expenses. The reasons to choose these two expenses are
they can move the market in a very short term and affects the performance for the company
towards a greater extent. The cost of sales as assumed by the company was $6968 however
the actual cost of goods sold incurred by the company are $5360. This is a positive reflection
from the company’s side however the management must check the accounts carefully where
at times the accountants may post the entries in the wrong head thereby creating a decrease in
the cost. The second expense that must be controlled and checked on the regular basis is the
administrative and general expenses. Though these expenses are of trivial nature however the
Sales (all on credit)
2,53,27
0
3,29,2
51 -75,981 -23% Unfavourable
Cost of Sales 5,360
6,
968 -1,608 -23% Unfavourable
Gross Profit
2,47,91
0 3,22,283 -74,373 -23% Unfavourable
Selling Expenses
Selling Expenses 5,000
5,
000 0 -38% Unfavourable
Depreciation 2,342
2,
389 -47 -2% Unfavourable
Admin and General
Expenses 14180
16,7
32 -2,552 -15% Unfavourable
Total expenses 21,522 24,121 -2,599 -11% Unfavourable
EBIT
2,26,38
8 2,98,162 -71,774 -24% Unfavourable
Interest 5,512 5,512 0 0% Unfavourable
EBT
2,20,87
6 2,92,650 -71,774 -25% Unfavourable
Tax 61845 81942 -20,097 -25% Unfavourable
Other income 275 300 Unfavourable
profit after tax
1,59,03
1 2,10,708 -51,677 -25% Unfavourable
The two variances that must be investigated at the first place are the cost of sales and
the administrative and the general expenses. The reasons to choose these two expenses are
they can move the market in a very short term and affects the performance for the company
towards a greater extent. The cost of sales as assumed by the company was $6968 however
the actual cost of goods sold incurred by the company are $5360. This is a positive reflection
from the company’s side however the management must check the accounts carefully where
at times the accountants may post the entries in the wrong head thereby creating a decrease in
the cost. The second expense that must be controlled and checked on the regular basis is the
administrative and general expenses. Though these expenses are of trivial nature however the
Paraphrase This Document
Need a fresh take? Get an instant paraphrase of this document with our AI Paraphraser
FINANCIAL ANALYSIS OF SKYSTUDIO 10
company must carefully assess the reasons of the increase and shall immediately take the
steps to curb it (Balaev, 2017).
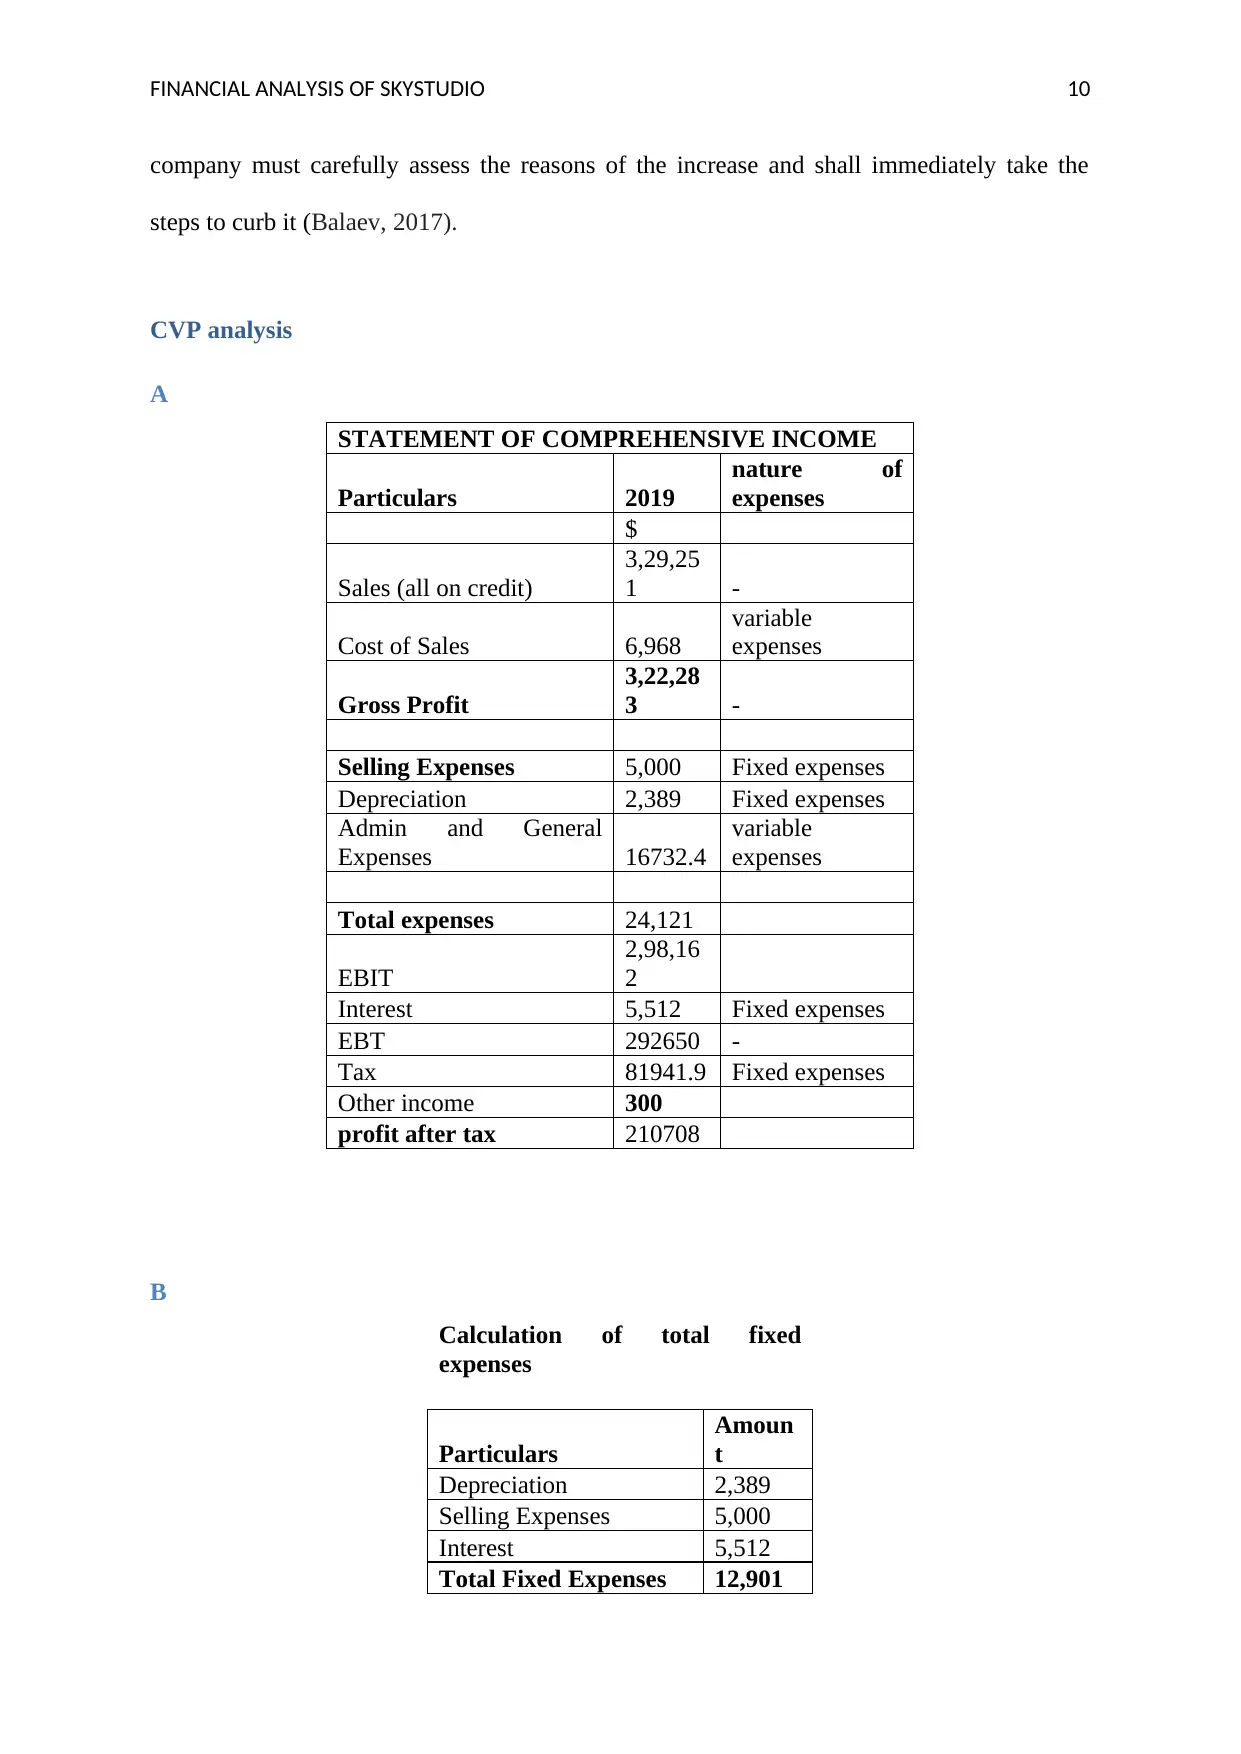
CVP analysis
A
STATEMENT OF COMPREHENSIVE INCOME
Particulars 2019
nature of
expenses
$
Sales (all on credit)
3,29,25
1 -
Cost of Sales 6,968
variable
expenses
Gross Profit
3,22,28
3 -
Selling Expenses 5,000 Fixed expenses
Depreciation 2,389 Fixed expenses
Admin and General
Expenses 16732.4
variable
expenses
Total expenses 24,121
EBIT
2,98,16
2
Interest 5,512 Fixed expenses
EBT 292650 -
Tax 81941.9 Fixed expenses
Other income 300
profit after tax 210708
B
Calculation of total fixed
expenses
Particulars
Amoun
t
Depreciation 2,389
Selling Expenses 5,000
Interest 5,512
Total Fixed Expenses 12,901
company must carefully assess the reasons of the increase and shall immediately take the
steps to curb it (Balaev, 2017).
CVP analysis
A
STATEMENT OF COMPREHENSIVE INCOME
Particulars 2019
nature of
expenses
$
Sales (all on credit)
3,29,25
1 -
Cost of Sales 6,968
variable
expenses
Gross Profit
3,22,28
3 -
Selling Expenses 5,000 Fixed expenses
Depreciation 2,389 Fixed expenses
Admin and General
Expenses 16732.4
variable
expenses
Total expenses 24,121
EBIT
2,98,16
2
Interest 5,512 Fixed expenses
EBT 292650 -
Tax 81941.9 Fixed expenses
Other income 300
profit after tax 210708
B
Calculation of total fixed
expenses
Particulars
Amoun
t
Depreciation 2,389
Selling Expenses 5,000
Interest 5,512
Total Fixed Expenses 12,901
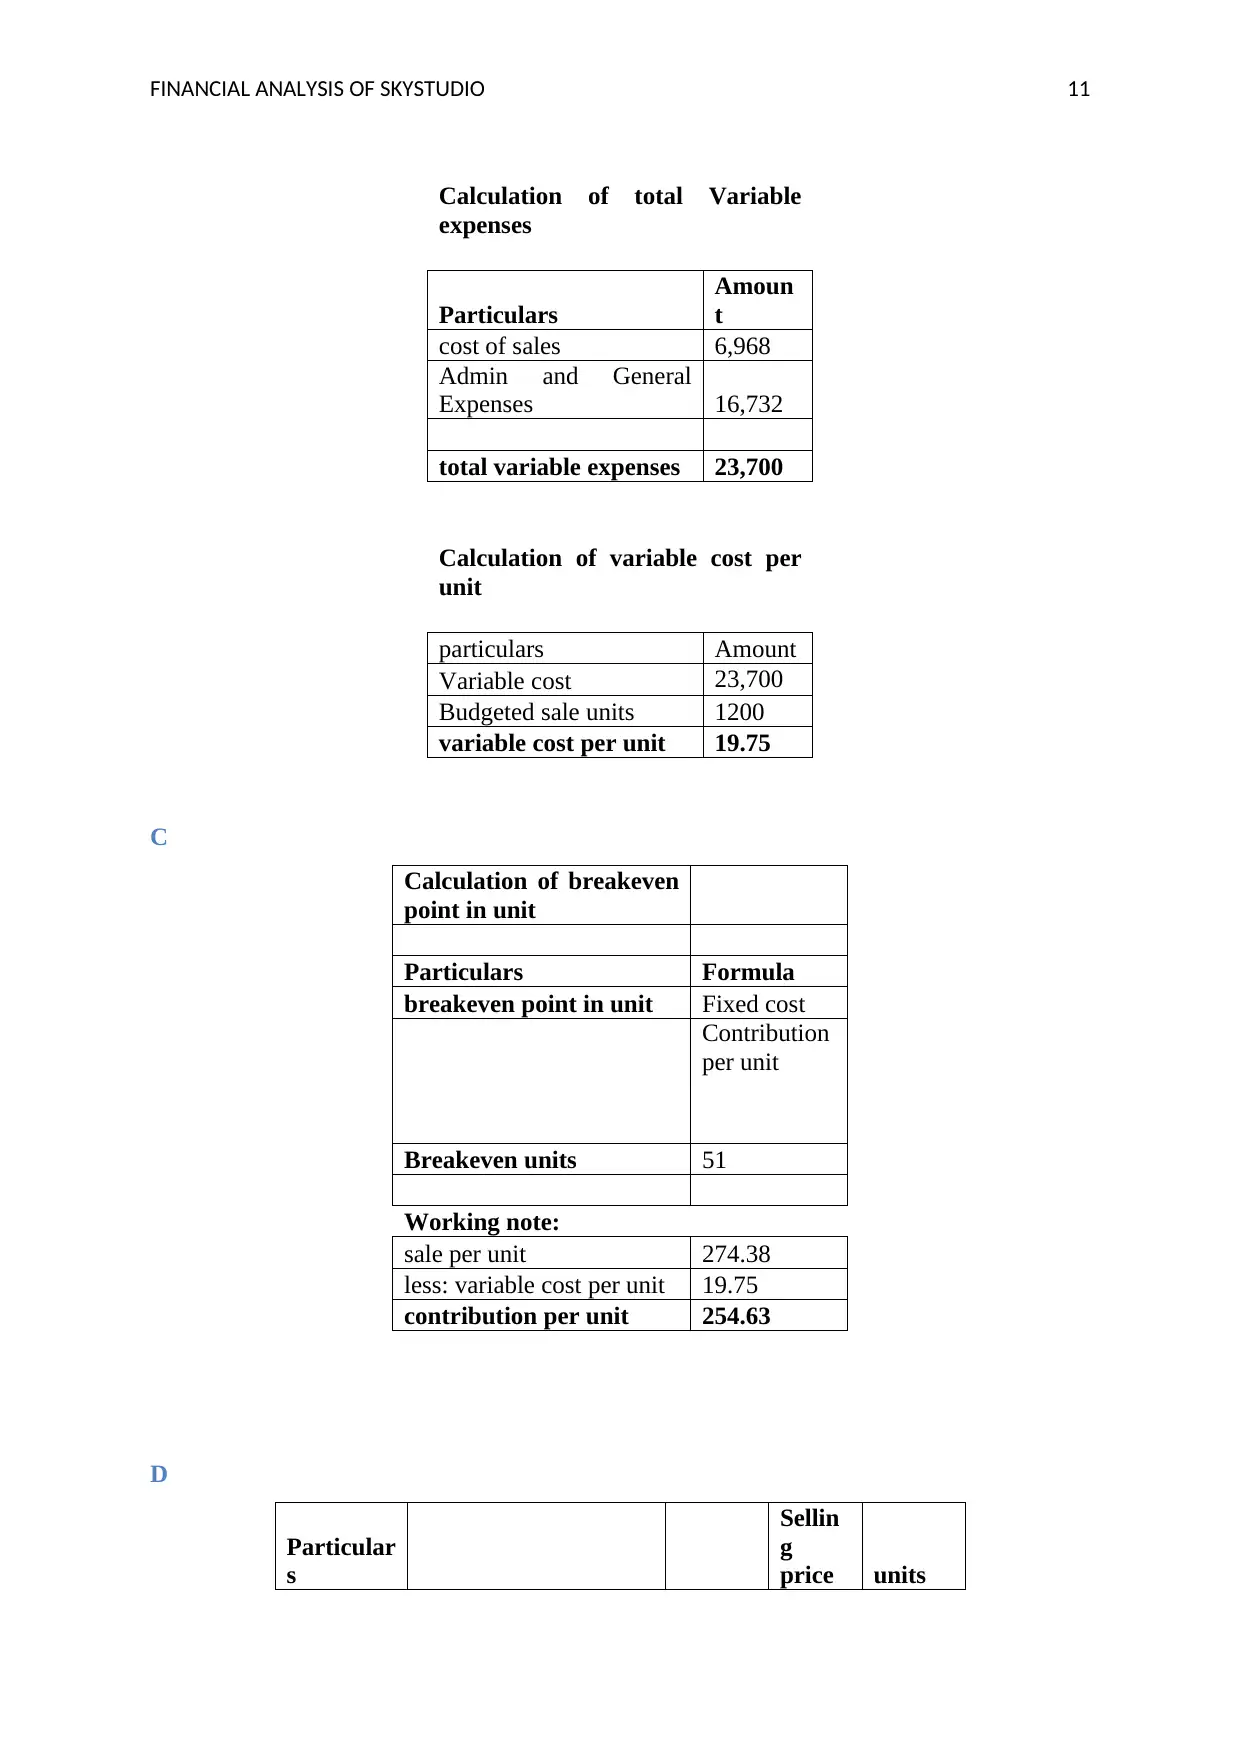
FINANCIAL ANALYSIS OF SKYSTUDIO 11
Calculation of total Variable
expenses
Particulars
Amoun
t
cost of sales 6,968
Admin and General
Expenses 16,732
total variable expenses 23,700
Calculation of variable cost per
unit
particulars Amount
Variable cost 23,700
Budgeted sale units 1200
variable cost per unit 19.75
C
Calculation of breakeven
point in unit
Particulars Formula
breakeven point in unit Fixed cost
Contribution
per unit
Breakeven units 51
Working note:
sale per unit 274.38
less: variable cost per unit 19.75
contribution per unit 254.63
D
Particular
s
Sellin
g
price units
⊘ This is a preview!⊘
Do you want full access?
Subscribe today to unlock all pages.
Trusted by 1+ million students worldwide
1 out of 15
Related Documents


Your All-in-One AI-Powered Toolkit for Academic Success.
+13062052269
info@desklib.com
Available 24*7 on WhatsApp / Email
![[object Object]](/_next/static/media/star-bottom.7253800d.svg)
Unlock your academic potential
Copyright © 2020–2026 A2Z Services. All Rights Reserved. Developed and managed by ZUCOL.