Financial Reporting: Regression Analysis of Working Capital on ROA
VerifiedAdded on 2021/02/20
|20
|5138
|30
Report
AI Summary
This report delves into the application of financial econometrics, specifically focusing on the empirical relationship between Return on Assets (ROA) as the dependent variable and various working capital components, including accounts receivable, inventory, accounts payable, and the cash conversion cycle. It utilizes regression analysis to examine financial data from multiple companies, considering relevant assumptions and formulating hypotheses. The study reviews existing literature on working capital management and its impact on profitability, referencing studies that employ statistical techniques like correlation and regression to validate findings. The report specifies a regression model to assess the influence of independent variables such as accounts receivable, accounts payable, inventory, cash conversion cycle, and total assets on ROA. The hypotheses are formulated to test the significance of these variables' impact. The report also discusses the importance of managing working capital efficiently to enhance financial performance, emphasizing the need to reduce receivable and inventory days to increase profitability. The analysis considers the relationship between liquidity and profitability, with the cash conversion cycle being a key measure of liquidity. The ultimate goal is to provide insights into how effective working capital management can boost shareholder value.

Financial Reporting
Paraphrase This Document
Need a fresh take? Get an instant paraphrase of this document with our AI Paraphraser
TABLE OF CONTENTS
INTRODUCTION...........................................................................................................................1
Assessment.......................................................................................................................................1
1. regression analysis .................................................................................................................1
2. Reviewing the relationship among the variables....................................................................2
(3) Specification of model and hypothesis..................................................................................6
(4) Data, variables and sources...................................................................................................7
(5) Documenting in standard format...........................................................................................8
(6) Analysis of results.................................................................................................................9
Conclusion and recommendation .............................................................................................11
CONCLUSION .............................................................................................................................12
REFERENCES .............................................................................................................................13
APPENDIX....................................................................................................................................14
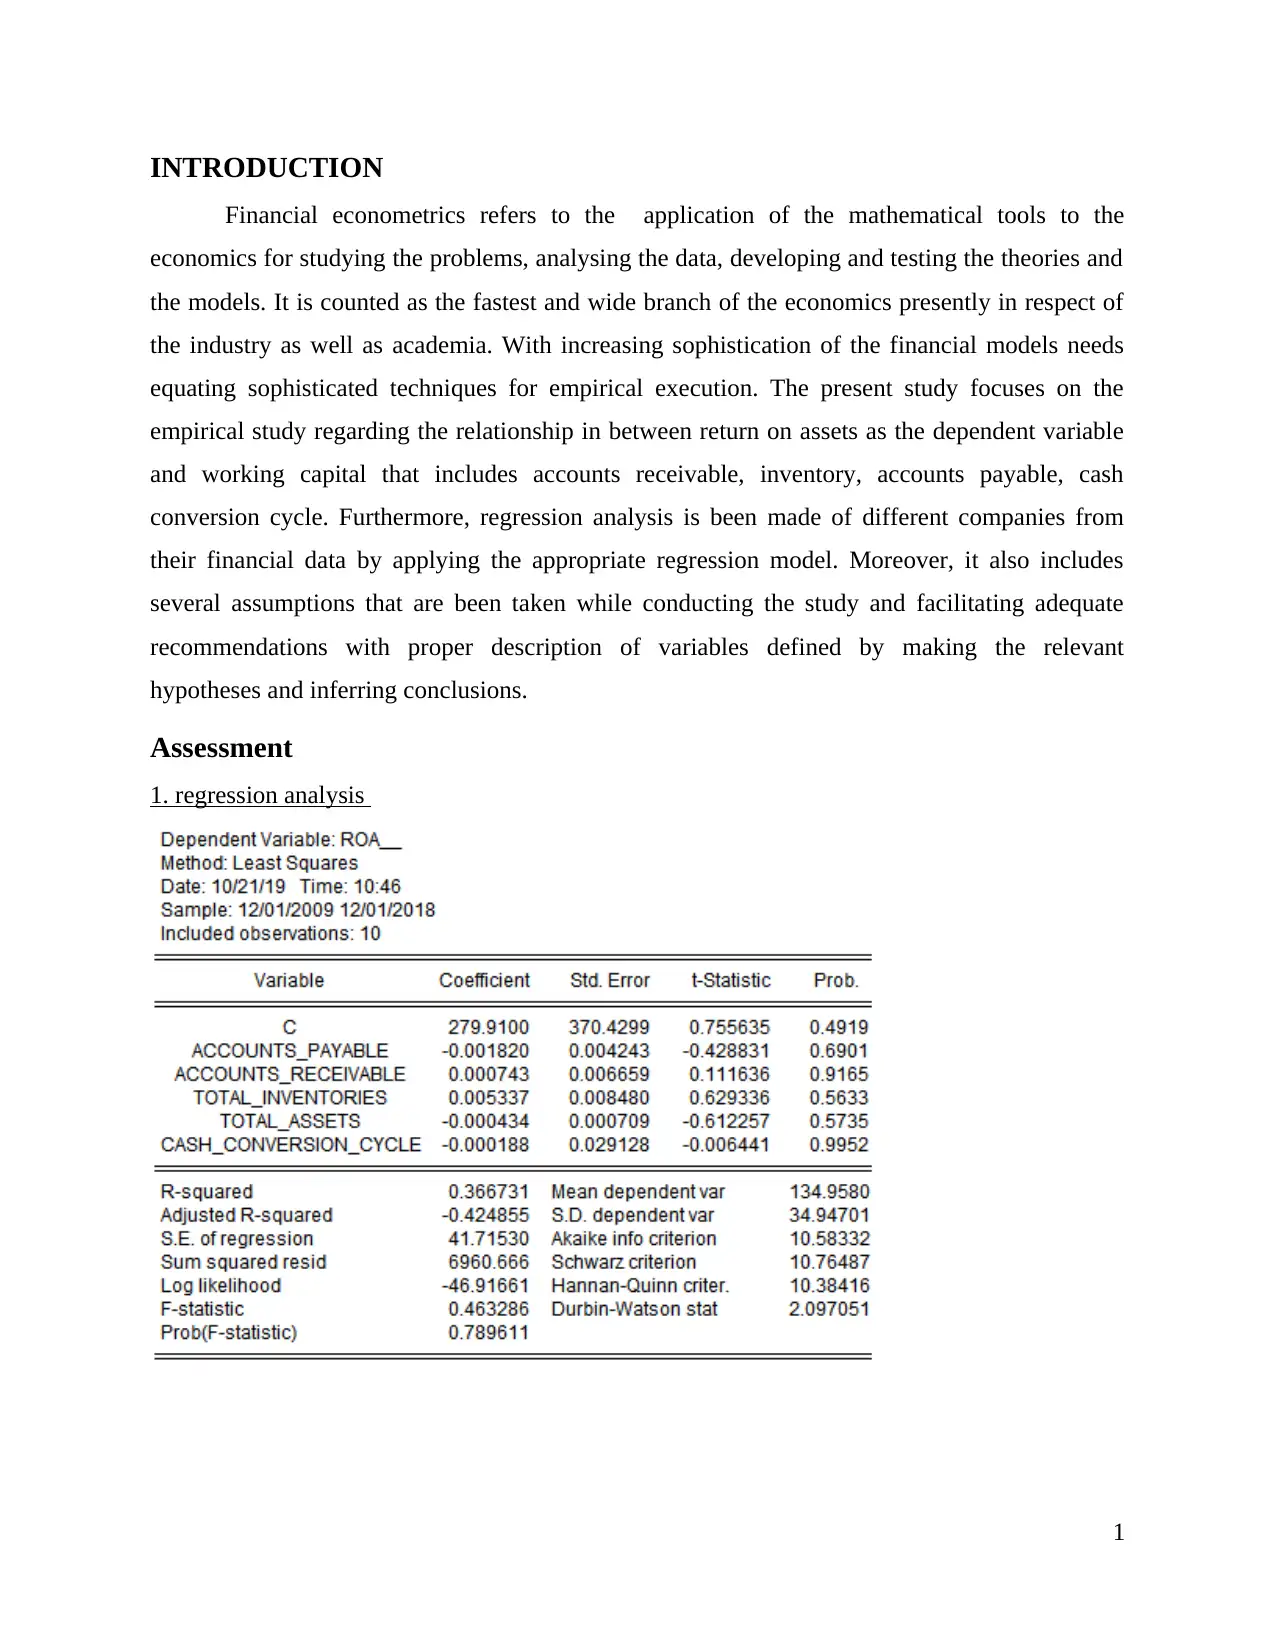
INTRODUCTION
Financial econometrics refers to the application of the mathematical tools to the
economics for studying the problems, analysing the data, developing and testing the theories and
the models. It is counted as the fastest and wide branch of the economics presently in respect of
the industry as well as academia. With increasing sophistication of the financial models needs
equating sophisticated techniques for empirical execution. The present study focuses on the
empirical study regarding the relationship in between return on assets as the dependent variable
and working capital that includes accounts receivable, inventory, accounts payable, cash
conversion cycle. Furthermore, regression analysis is been made of different companies from
their financial data by applying the appropriate regression model. Moreover, it also includes
several assumptions that are been taken while conducting the study and facilitating adequate
recommendations with proper description of variables defined by making the relevant
hypotheses and inferring conclusions.
Assessment
1. regression analysis
1
⊘ This is a preview!⊘
Do you want full access?
Subscribe today to unlock all pages.
Trusted by 1+ million students worldwide
2. Reviewing the relationship among the variables
As reviewed by the Afrifa and Tingbani, (2018), it has been analysed the study has
emphasized on the relationship in between the working capital of an enterprise with that of its
profitability that is been measured by evaluating the return on the total assets. For conducting the
study, correlation and regression analysis has been used as a statistical technique in order to
validate findings. The assessment has been made by taking the sample of the 20 firms for the
period of 10 years in order to make the study more useful.
Yenice, (2015) viewed the relation between the cash conversion cycle and profitability
or return on the assets of a corporate. From the study it has been considered that shorter the cycle
of the cash conversion, higher profitability is been gained by an entity. This has been revealed by
applying the chi-square test fro the hypotheses fro examining the financial data of 20 different
firms over the period of 10 years.
However, In accordance to Nobanee, (2017), different statistical tools could be used for
making the analysis more reliable such as correlation, multiple regression, non-parametric
process etc. These techniques helps in evaluating cross-sectional relation between the measures
of profitability and CCC. The resultant finding reflects that various along with their aggressive
procedures of liquidity management stated significant statistical inverse relationship between the
profitability and the CCC.
Jain, Bhargava and Bhargava, (2017), identified that by making use of the cash
conversion cycle variable as the comprehensive measure for managing working capital. As the
measure of the trade credit, inventory policies different variables are taken into account like
accounts receivable, payables and inventories as an independent variable. Regression analysis
with application of the model called fixed effect is been used for the purpose of capturing any
intercept of the companies that are found consistent over the time. The findings regarding the
accounts receivable variable reflected existence of the negative relationship. Increase in no. of
days trade receivables results to the decrease in the gross operating income. It has also been
determined that the gross profit of the firm increases with the firm size, fixed assets and the sales
growth. On the other hand, decrease in the gross profit is been observed with the growing
proportion of the financial debt.
2
Paraphrase This Document
Need a fresh take? Get an instant paraphrase of this document with our AI Paraphraser
In the viewpoint of Rahaman, Rabbi and Alam, (2018), it has been highlighted that
inventory days significantly having a negative relationship with that of the operating income.
This means that the managers must reduce receivable days along with its inventories for
increasing the corporate profitability. However, on the other side, enterprise with less amount of
profits accounted as it has waiting for the payment of the bill for the long time. The study states
that the regression model reflects a higher proportion of the changes in the amount of
profitability among the firms. It has been suggested that for creating the shareholders value,
managers of an enterprise must reduce receivable days and the inventory days to lower level.
As per the Aktas, Croci and Petmezas, (2015), researcher could make use of the current
ratio, cash gap for empirically examining relationship in between the profitability and the
liquidity. In this report, cash gap is been computed by subtracting accounts payable days from
inventory and receivable days. With respect of the statistical tools, correlation tool has used for
determining association between the profitability and the liquidity indicators in consideration
with the other appropriate related variables. It has also been found that there is a positive and the
significant association present in between measures of the size and the profits. Highly positive
and the strong relation exist between the total assets and sales which is been marked for
becoming substitute of the measure size. The study also examined the relation in between level
of liquidity, cash gap and the profitability existed as the efficiency function in managing the cash
cycle. Thus, the report draws conclusions as that the cash gap or the CCC represented as the
essential measure of the liquidity in comparison to the impact of the current ratio on the
profitability. However, with more and more segment of labour intensive such as cash gap seeks
to lose importance as the liquidity measure.
Naeem, Awais and Shahzadi, (2017), also reviewed that key elements of the working
capital management in the study are been examined in respect of the selected firms for
generating an insights towards their financial performance. The major dimensions that are been
reflected in the hypothesis is to determine significant differences among the industries in respect
to measures of efficiency in working capital and application of ANOVA in finding out the
suitable results. The other hypotheses is been developed for assessing that whether the measures
of working capital for an enterprise within the industry had changed over the time. It has also
been mentioned that the evaluation had been made for a shorter period of time within an
improving market which may suffer survivorship bias.
3
In view of Singh, Kumar and Colombage, (2017), it has been represented that four
major regression equations are used in the study for estimating relationship between both
dependent and the independent variable where the dependent variable is Return on assets and
the independent variable is stated as AR, AP, INV and CCC. Control variables are also used that
involves total assets, sales growth, GDP and debt in regression equations for generating the
results. The most crucial observation on the credit policy was that the performance of an
enterprise get improve when credit policy becomes more and more restrictive with very less
given to the customers for making the payments. On contrary to it, it is been observed that profits
could be increased with respect to the payment facility which is customer oriented and induces
the sales growth. It has also been found that reduction in the inventory days improves the
profitability and increase in account payable days reduces profitability. Gao and Wang, (2017),
highlighted that profitability of the companies improves with the shorter CCC which is been
measured as the combined influence of the accounts receivable days, payable days and inventory
days.
It has been suggested by the Hailu and Venkateswarlu, (2016) that use of the aggressive
investment policy resulted a minimum investment level in the current assets in comparison to the
investment in the fixed assets. Similarly, conservative investment policy leads to large capital in
the liquid assets and results in opportunity cost regarding the less profitability. In the report,
scholar measured degree net profit with respect to total assets. This ratio indicates the return
generated by the firms from total assets and is stated as that lower ratio means that the policy is
relatively aggressive. In respect of profitability measure, return on asset is computed by dividing
the net earnings with the book value of the total assets. The finding generated showed that firms
which had adopted the aggressive approach for managing the current liabilities are been
perceived as most valuable by the investors. In case if the working capital policy is aggressive
then it does not result in generating larger profits.
Kasozi, (2017) states that profitability and the firm's value were been used as a biggest
measure of the firm's performance. As the indicator of the profitability, gross operating profit has
been used that is measured by dividing the cost of sales with that of the difference in between the
financial and total assets. The outcome from the assessment reflects a shortening of receivable
days and the CCC had resulted a positive influence on the profitability.
4
⊘ This is a preview!⊘
Do you want full access?
Subscribe today to unlock all pages.
Trusted by 1+ million students worldwide
The Sharaf and Haddad, (2015) find out that the relations between the management of
working capital and the profitability of the firm. From this it has been carried out that
management of the working capital leads to improved performance and increased profitability.
Under this, an investigator examines CCC as well as the net trade cycle. Financial data of
different companies is gathered from the year 2009 to 2018 that for the period of 10 years.
Regression equations are been used for testing the relationship between the WCM and the
profitability. The findings shows that the CCC and the size of the firm positively relates to its
profitability. It has also been found that larger firm with the greater level of the inventory and the
better terms of credit for the clients leads to higher profitability and also the value of an
enterprise increases. There exist an inverse relation in between the risk profile of the firm and the
profitability.
Thus, it has been concluded by the Mun and Jang, (2015) that WCM is considered as an
essential component for the firm in developing its overall strategy fro boosting the value of their
shareholders. From the study, it has been interpreted that negative relationship is present in
between measure of cycle and the debt, however, positive relationship is been found in between
ROA and the size, sales growth and GDP rate of the working capital. Bulin, Basit and Hamza,
(2016), suggested that managers could maximize wealth and improves profitability by dropping
the receivable days, payable days, inventory days and in making substantial efforts for
maintaining optimal level of CCC. WCM has a direct impact on the risk and the profitability
measure of a corporate. It is been counted as the routine management function of an entity. The
main components of working capital are current assets that includes cash, accounts receivable
and the short term liabilities that involves accounts payables, short term loans etc.
WCM is counted as the most important module of the finance and is having an
undeviating effect on profitability and liquidity of the company. Both these factors act as crucial
module of the finance and has undeviating influence on profitability and liquidity of an
enterprise. It has been also been reflected that there is a significant negative relation in between
CCC and profitability while the companies that are having the shorter CCC states the
insignificant negative relation with the profitability. Significant positive relation is been found
between firm size that are having longer and the shorter CCC.
5
Paraphrase This Document
Need a fresh take? Get an instant paraphrase of this document with our AI Paraphraser
(3) Specification of model and hypothesis
Regression is the one of the model that is used to investigate relationship between dependent
variable and independent variable. In the current research ROA or return on asset is the
dependent variable and its relationship to independent variable account receivable, account
payable, inventory, cash conversion cycle, total asset is used. Regression model is given below.
ROA = Account receivableX1+Account payableX2+InventoryX3+Cash conversion
cycleX4+Total assetsX5
H0: There is not significant impact of account receivable, account payable, inventory, cash
conversion cycle and total assets on ROA.
H1: There is significant impact of account receivable, account payable, inventory, cash
conversion cycle and total assets on ROA.
In the current model receivable is taken in to account as if receivable amount is high
across years then it means that cash amount is blocked in account receivable which means that
less cash is available for making investment in business. Ultimately profit get declined and lead
to low ROA. Such kind of relationship is taken in to account and because of this account
receivable is considered as independent variable.
Apart from account receivable, payable is also taken in account. In case across years
account payable is high then it means that less amount of cash is available to make investment in
business. As discussed above less profit will be earned in the business which ultimately lead to
low ROA.
Inventory is another area which heavily affect profitability. If there is higher amount of
inventory in business then it means that large amount of cash is blocked in unsold or unused
inventory. Again, less cash available for making investment in business which lead to low ROA.
In case of CCC also same thing applied if it takes lot of time to convert anything in to
cash profit will be significantly get affected. More total assets increase profit in business is
assumed to increase which lead to higher ROA.
Thus, these are specific reasons because of which account receivable, payable, inventory,
total assets and cash conversion cycle are considered as independent variable to explain
performance of return on assets.
6
(4) Data, variables and sources
In the raw data set multiple variables data is available namely ROA, Account receivable,
Account payable, total inventories, cash conversion cycle and total assets. In order to prepare
final data 20 FTSE firms financials are taken in to account for 10 years. Thereafter, some
functions like TRANSFORM and SUMIF are used in Excel to obtain final data set which is used
to obtain regression results. 30 years financials for all 20 companies was obtained from website
gurufocus. com. In the regression model ROA is taken as dependent variable and account
receivable, payable, inventory, cash conversion cycle and total assets are considered as
independent variable. Brief explanation on variables is given below. ROA: ROA is not constant and is changing at rapid across years. Interesting fact is that
particular trend remains in existence for three years. In chart attached in appendix it can
be observed that if ROA start decline it reduce consistently for three years. Similarly, if
ROA start increase it almost increase three years. Account receivable: With passage of year account receivable decline consistently which
reflect that firm with change in year successfully reduce cash blockage in receivables. Account payable: Interesting fact is that account payable of firms increase year over year
which means that corporate focus on retaining more and more cash on side of payable.
This reflect that there is already scarcity of cash in business. Payable not paid in current
year carry forward in next year which further mount pressure on the business firm. Inventory: Inventory increase consistently which means that less inventory convert into
cash and more cash is blocked in unsold or unused inventory. Total assets: Total assets increased consistently in the business which is good for the
business firm.
Cash conversion cycle: Cash conversion cycle value decline consistently which good for
the firms. Higher cash conversion cycle reflect situation where firm is taking long time to
convert produced units and inventory in to sales and less time to pay payables. On other
hand, less cash conversion cycle refers to the situation where days of produced units and
inventory conversion in to sales reduced which is good for the firm. In current scenario
cash conversion cycle reduced to great extent which reflect that quickly inventory and
7
⊘ This is a preview!⊘
Do you want full access?
Subscribe today to unlock all pages.
Trusted by 1+ million students worldwide
sales on credit convert in to cash. Thus, on this front excellent performance is observed
because substantial decline in cash conversion cycle is observed from FY 2009 to 2018.
(5) Documenting in standard format
Y= α+β*X1+ β*X2+ β*X3+ β*X4++ β*X5
Where
Y= Dependent variable
X= Independent variable
In present case equation is
ROA = Account receivableX1+Account payableX2+InventoryX3+Cash conversion
cycleX4+Total assetsX5
Where
Y= ROA
X1 = Account receivable
X2= Account payable
X3= Inventory
X4= Cash conversion cycle
X5 = Total assets
(6) Analysis of results
8
Paraphrase This Document
Need a fresh take? Get an instant paraphrase of this document with our AI Paraphraser
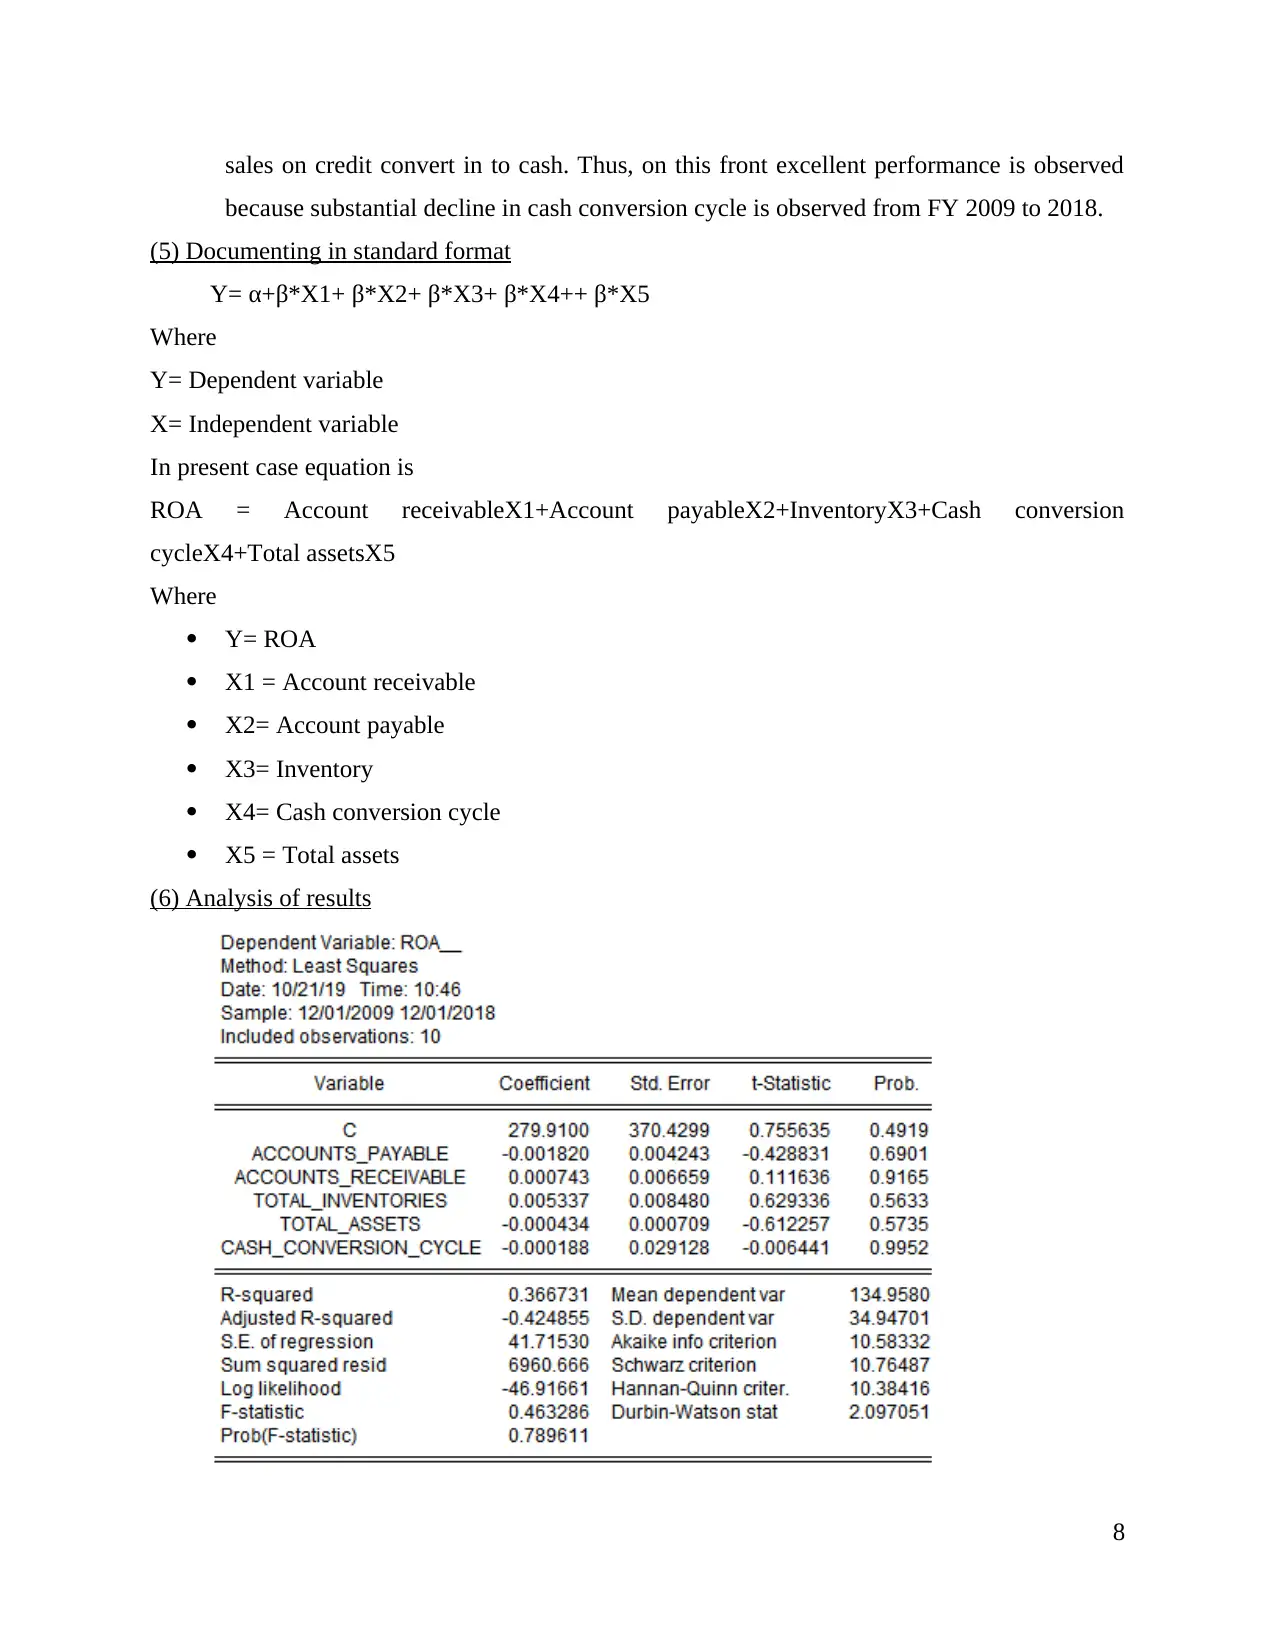
Interpretation
In the image given above dependent variable is ROA (Return on assets) and independent
variable is account receivable, payable, inventory, total assets and cash conversion cycle. Value
of level of significance is 0.78>0.05 which reflect that because of change in independent variable
any significant change is not observed in dependent variable. Means that if variables payable,
receivable, inventory, assets and cash conversion cycle get changed any big change will not be
observed in dependent variable. R square value is 0.36 which means that independent variable is
explaining 36% variation of dependent variable. Means that there may be any other variable that
is impacting dependent variable and not included in the model. Coefficient values are quite low
in case of payable, receivable, inventory and asset. In case of payable it can be observed that
value of coefficient is only -0.0 which reflect that payable have no impact on return on assets. On
other hand, in case of receivable also same trends are observed and no impact of receivable
observed on return on assets. Inventory, total assets and conversion cycle also indicate same
thing which means that with change in these variables any change does not come in ROA. If we
connect R square values and coefficient values together then in that case it can be observed that
there is relationship between independent variables and dependent variable but same is weak as
only one fourth of variation in dependent variable is explained by independent variable.
Probability value for account receivable is 0.91>0.05 which means that coefficient value in terms
of standard deviation is not far away from zero value. Probability value for account payable is
0.69>0.05 which means that coefficient value in terms of standard deviation is not far away from
zero value. Probability value for inventory is 0.56>0.05 which means that coefficient value in
terms of standard deviation is not far away from zero value. Probability value for total assets is
0.57>0.05 which means that coefficient value in terms of standard deviation is not far away from
zero value. Probability value for cash conversion cycle is 0.99>0.05 which means that coefficient
value in terms of standard deviation is not far away from zero value. Thus, overall it is concluded
that independent variables are not bringing any big change in dependent variable.
Some of the common assumptions of simple linear regression model is given below. Linear relationship: This assumption state that there must be linear relationship between
dependent and independent variable. Means that direction of change must be in specific
pattern for both (Chatterjee and Hadi, 2015). In case movement of both variables
happened not in respect to each other then in that case it become very hard for linear
9
regression algorithm to investigate relationship between variables. Thus, it is the one of
the major limitation of linear model that it can measure relationship between two
variables only when there is linear relationship between both variables. Multivariate normality: In linear regression it is assumed that data taken in to account
must be normally distributed. In case data is not normally distributed regression failed to
generate better results. Data scientist usually if data is not normally distributed use non-
parametric test to investigate relationship between variables. Many times, in dataset
outliers are present. Outliers refers to the extreme points in the data set. These outliers
need to be removed in order to obtain modified data that can be used to obtain accurate
results. No multicollinearity: It is one of the main issue associated with linear regression mode.
It refers to the situation where multiple independent variable have strong correlation with
each other (Schroeder, Sjoquist and Stephan, 2016). If such correlation is high then in
that case model cannot generate results. Thus, multicellularity problem is big in
regression model. In order to deal with problem of multi collinearity many experts make
use of log approach and by doing so many times problem of multicollinearity is
controlled.
Homoscedasticity: It is another most important assumption of linear regression approach.
In this assumption it is assumed that predicted values and observed values must be same
or there must not be much difference between them. In other words, it can be said that
there must be almost equal difference between predicted and actual values across all data
points. There is direction connection between R square and homoscedasticity. If there
will be homotheticity R square value will be high (Levine and et.al., 2017). Usually,
Homoscedasticity is not observed when there is any other independent variable
responsible for variation in dependent variable and not included in the regression model.
In such kind of situation R square value always remain low and it is assumed that model
is not best fit. Thus, it is assumption in the linear regression model that error must have
homoscedasticity so that it can be ensured that change in dependent variable is exactly
explained by independent variable.
In present case in regression model homoscedasticity assumption is violated. It is observed
that there is huge variation in residual value that is computed by subtracting predicted value
10
⊘ This is a preview!⊘
Do you want full access?
Subscribe today to unlock all pages.
Trusted by 1+ million students worldwide
1 out of 20
Related Documents


Your All-in-One AI-Powered Toolkit for Academic Success.
+13062052269
info@desklib.com
Available 24*7 on WhatsApp / Email
![[object Object]](/_next/static/media/star-bottom.7253800d.svg)
Unlock your academic potential
Copyright © 2020–2026 A2Z Services. All Rights Reserved. Developed and managed by ZUCOL.