Principles of Accounting: Financial Reporting Homework Assignment
VerifiedAdded on 2023/05/30
|7
|1367
|422
Homework Assignment
AI Summary
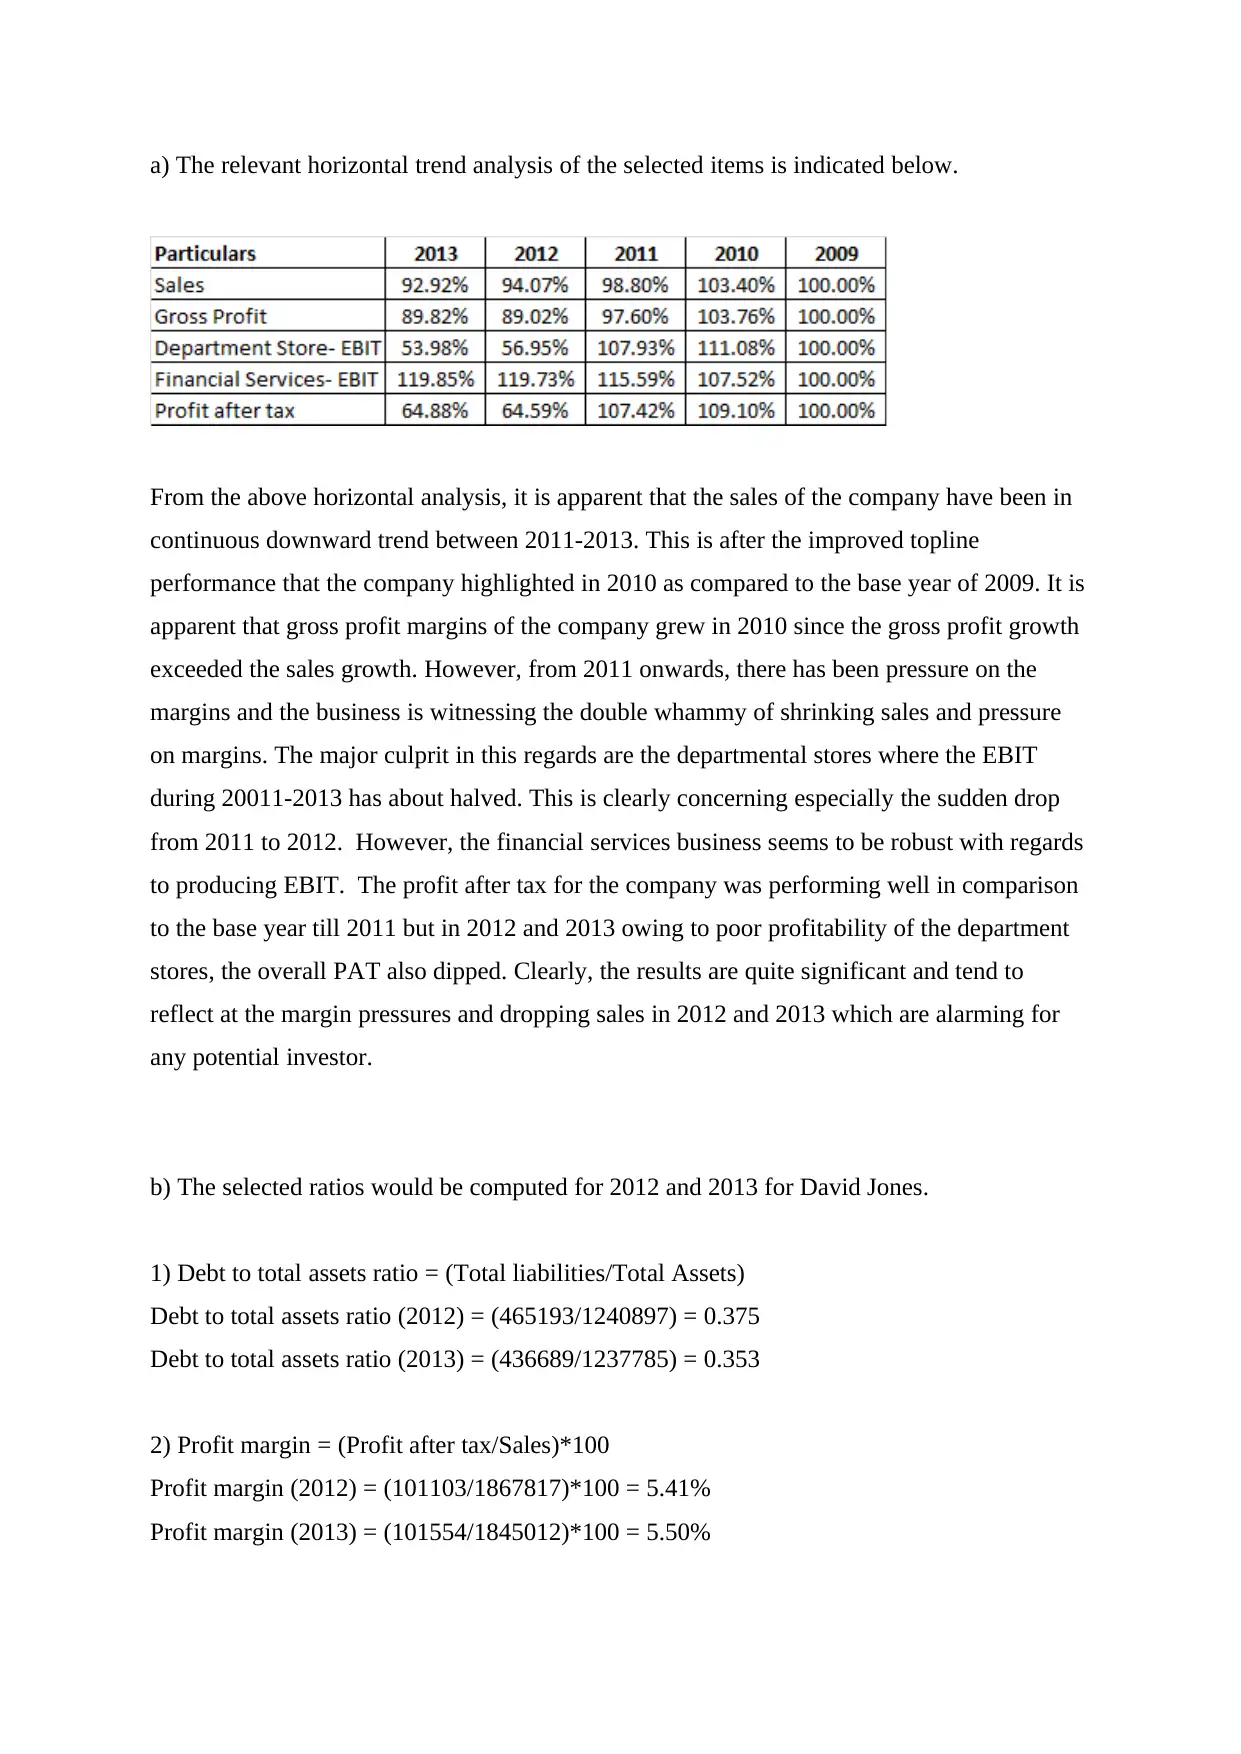
This homework assignment analyzes the financial statements of Domino's Pizza Enterprises Ltd and David Jones Ltd. The first part focuses on Domino's, requiring the calculation of net cash flow from operating activities, changes in cash, changes in borrowings, cash used for investing activities, and interest and income tax paid, based on the 2013 and 2012 financial statements. The second part involves a five-year trend analysis of David Jones' sales, gross profit, EBIT, and profit after tax, followed by the calculation of key financial ratios such as debt to total assets, profit margin, asset turnover, return on equity, and dividend payout. The assignment concludes with an evaluation of David Jones' profitability, solvency, and investment potential, providing insights for potential investors. The solution provides detailed calculations and interpretations of the financial data.

PRINCIPLES OF ACCOUNTING
Question 2 (15 marks)
FINANCIAL REPORTING PROBLEM: Domino’s Pizza Enterprises Ltd
Refer to the financial statements of Domino’s presented in the link below.
http://www.annualreports.com/HostedData/AnnualReportArchive/d/ASX_DMP_2013.pdf
Required
Answer these questions:
a. What was the amount of net cash provided by operating activities for 2013 and 2012?
b. What was the amount of increase or decrease in cash for 2012 and 2013?
c. From your analysis of the 2013 cash flow statement, what was the amount of the change in borrowings
and was it a decrease or an increase?
d. What was the total (net) cash used for investing activities for 2013?
e. What was the amount of interest paid in 2013? What was the amount of income tax paid in 2013?
Paraphrase This Document
Need a fresh take? Get an instant paraphrase of this document with our AI Paraphraser

Student Answer:
a) The cash flow generated from operations for year 2013 and 2012 was $ 33,180,000 and $ 37,678,000
respectively. This is indicated from the following screenshot.
b) The cash balances reported for ending of FY2012 and FY2013 were $ 18,691,000 and $ 40,340,000
respectively. This is indicated from the following screenshot.
Clearly there has been a decrease in the cash in 2013.
Decrease in cash in 2013 = 40,340,000 – 18,691,000 = $ 21,649,000
c) In 2013, there has been an increase in thee borrowings which is apparent from the following relevant
screenshot of cash flows from financing activities.
Net increase in borrowing in 2013 = $ 43,721,000 - $ 20,506,000 = $23,215,000
d) Net cash used in investing activities in 2013 amounted to $ 30,395,000.This is apparent from the
following screenshot.

e) The interest paid in 2013 was $405,000. Amount of income tax paid in 2013 was $11,796,000. Thee
relevant screenshot is highlighted below.
⊘ This is a preview!⊘
Do you want full access?
Subscribe today to unlock all pages.

Trusted by 1+ million students worldwide

Question 3 (15 Marks)
Your parents are considering investing in David Jones Ltd (DJS) shares. They ask you, an
accounting expert, to make an analysis of the entity for them. An extract from the five-year
summary included in David Jones Ltd 2013 annual report is presented below. All figures are
in thousands.
Required
a. Prepare a 5-year trend (horizontal) analysis of sales, gross profit, department store EBIT,
financial services EBIT and profit after tax using 2009 as the base year. Comment on the
significance of the trend results.
b. Calculate the following for 2013 and 2012:
1. Debt to total assets ratio.
2. Profit margin.
3. Asset turnover.
4. Return on shareholders’ equity.
5. Dividend payout.
c. How would you evaluate David Jones Ltd’s profitability, solvency and investment
potential?
Paraphrase This Document
Need a fresh take? Get an instant paraphrase of this document with our AI Paraphraser

a) The relevant horizontal trend analysis of the selected items is indicated below.
From the above horizontal analysis, it is apparent that the sales of the company have been in
continuous downward trend between 2011-2013. This is after the improved topline
performance that the company highlighted in 2010 as compared to the base year of 2009. It is
apparent that gross profit margins of the company grew in 2010 since the gross profit growth
exceeded the sales growth. However, from 2011 onwards, there has been pressure on the
margins and the business is witnessing the double whammy of shrinking sales and pressure
on margins. The major culprit in this regards are the departmental stores where the EBIT
during 20011-2013 has about halved. This is clearly concerning especially the sudden drop
from 2011 to 2012. However, the financial services business seems to be robust with regards
to producing EBIT. The profit after tax for the company was performing well in comparison
to the base year till 2011 but in 2012 and 2013 owing to poor profitability of the department
stores, the overall PAT also dipped. Clearly, the results are quite significant and tend to
reflect at the margin pressures and dropping sales in 2012 and 2013 which are alarming for
any potential investor.
b) The selected ratios would be computed for 2012 and 2013 for David Jones.
1) Debt to total assets ratio = (Total liabilities/Total Assets)
Debt to total assets ratio (2012) = (465193/1240897) = 0.375
Debt to total assets ratio (2013) = (436689/1237785) = 0.353
2) Profit margin = (Profit after tax/Sales)*100
Profit margin (2012) = (101103/1867817)*100 = 5.41%
Profit margin (2013) = (101554/1845012)*100 = 5.50%

3) Asset Turnover = (Sales/Total Assets)
Asset Turnover (2012) = (1867817/1240897) = 1.505
Asset Turnover (2013) =(1845012/1237785) = 1.49
4) Return of shareholders’ equity (ROE) = (Profit after tax/Total Equity)*100
Return on shareholders’ equity (2012) = (101103/775704)*100 = 13.03%
Return on shareholders’ equity (2013) = (101554/801096)*100 =12.68%
5) Dividend Payout = (Dividends per share/Earnings per share)*100
Dividend Payout (2012) = (17.5/19.4)*100 =90.21%
Dividend Payout (2013) = (17/19.2)*100 = 88.54%
c) Profitability
With regards to profitability comparison between 2012 and 2013, it is apparent that the profit
margin has improved from 5.41% to 5.5% respectively. However, despite the improved profit
margin, there is a decrease in the ROE which may be on account of increase in shareholders’
equity in 2013 while the net profit did not improve significantly. However, during the given
period, it is apparent that there has been a significant decline in the profitability both at the
gross level and also at the net level. This is attributed primarily to the lacklustre performance
of the departmental stores which have produced lesser profits especially in 2012 and 2013.
Solvency
Solvency reflects the ability of the company to meet the long term debt obligations and
associated interest obligations. Debt to total assets ratio has improved for the company in
2013 as compared to the 2012 value. It is apparent that during the 2009-2013 period, the
liabilities of the company have not grown and have remained at the same level. However,
there has been a significant increase in the total equity during this period which would
improve the debt to equity ratio and provide greater comfort to the lenders. Also, the fact that
the company has not increased the debt implies that the balance sheet leveraging has not
increased. Further, the company is also generated profits in every year and hence in a
situation to meet the interest obligations that would arise. Based on the above analysis, it
would be appropriate to conclude that the company does not face any issues with regards to
servicing the liabilities.
⊘ This is a preview!⊘
Do you want full access?
Subscribe today to unlock all pages.

Trusted by 1+ million students worldwide

Investment Potential
With regards to an investors, there are two avenues of generating returns namely dividends
and appreciation of share price. Based on the dividend payout ratio, it is apparent that it is
quite high. But the major issue is the decrease in earnings per share. Considering that
earnings per share are linked to the share price, hence the poor performance of the company
with regards to profit generation would also have an adverse impact on the share price. Also,
a lower earnings would also imply lower dividend per share which is apparent in 2012 and
2013. Hence, considering the given lacklustre performance especially in 2012 and 2013, it
would be imprudent to make an investment in the company till the performance stabilises and
future growth is visible with certainty.
1 out of 7
Related Documents

Your All-in-One AI-Powered Toolkit for Academic Success.
+13062052269
info@desklib.com
Available 24*7 on WhatsApp / Email
Unlock your academic potential
Copyright © 2020–2025 A2Z Services. All Rights Reserved. Developed and managed by ZUCOL.