Financial Reporting and Performance Analysis: JB Hi-Fi and Dick Smith
VerifiedAdded on 2020/02/05
|14
|4818
|182
Report
AI Summary
This report provides a comprehensive financial performance analysis of JB Hi-Fi and Dick Smith, two Australian consumer goods retailers, comparing their financial statements over two consecutive years. The analysis employs horizontal and vertical analysis techniques, alongside the evaluation of various financial ratios, including profitability, solvency, liquidity, and efficiency. The report identifies that JB Hi-Fi generally demonstrates superior financial performance compared to Dick Smith, particularly in terms of profitability and asset utilization. The analysis reveals trends in asset and sales growth, profit margins, and the impact of operational strategies. While both companies experienced declines in liquidity ratios, JB Hi-Fi maintains a stronger ability to meet short-term obligations and manage financial risk. The report concludes by highlighting JB Hi-Fi's better market performance, as evidenced by higher EPS and DPS, and its overall stronger financial position despite the need to manage long-term financial risk.
Financial Reporting Analysis
Paraphrase This Document
Need a fresh take? Get an instant paraphrase of this document with our AI Paraphraser
Executive Summary
It is the duty of managers to examine the performance or financial strength through
evaluating their annual financial statement over the period. In the present assignment, financial
performance has been evaluated of both the JB Hi-Fi and Dick Smith. From the performance
analysis of both the businesses, it has been identified that JB Hi-Fi’s performance is
comparatively well than Dick Smith. Moreover, from the ratio analysis, it has been analyzed that
liquidity performance of both the companies got decreased and financial risk got raised, but still,
JB Hi-Fi is more able to pay their short-term obligations timely and employ less investment risk
due to lower use of debt. Moreover, managers of JB Hi-Fi are optimally utilizing corporate assets
so as to generate more business turnover. At the end, report identified that JB Hi-Fi is also
delivering better return to their investors due to high EPS and DPS.
Table of Contents
INTRODUCTION....................................................................................................4
QUESTION 1............................................................................................................4
QUESTION 2............................................................................................................5
QUESTION 3............................................................................................................6
CONCLUSION.........................................................................................................7
REFERENCE...........................................................................................................8
APPENDIX................................................................................................................8
⊘ This is a preview!⊘
Do you want full access?
Subscribe today to unlock all pages.
Trusted by 1+ million students worldwide
INTRODUCTION
Every commercial establishment has to examine and analyze their operational
performance and financial years and also compare the results over the years so as make
qualitative decisions. Horizontal and vertical analysis and evaluation of financial ratios are the
useful techniques that businesses often use to measure their financial strength and operational
success. The purpose of this project report is to analyze and compare the financial performance of
two Australian consumer goods retailer, JB Hi-Fi and Dick Smith for the two consecutive years.
It will be done through trend and common-size analysis. At the end, the report will examine
business success through computing varied ratios such as profitability, solvency, liquidity and
efficiency as well.
QUESTION 1
See Appendix 1,2,3 and 4
Horizontal analysis is a technique used by analysts to compare the actual outcome of
current year from that of previous year, also called trend analysis.
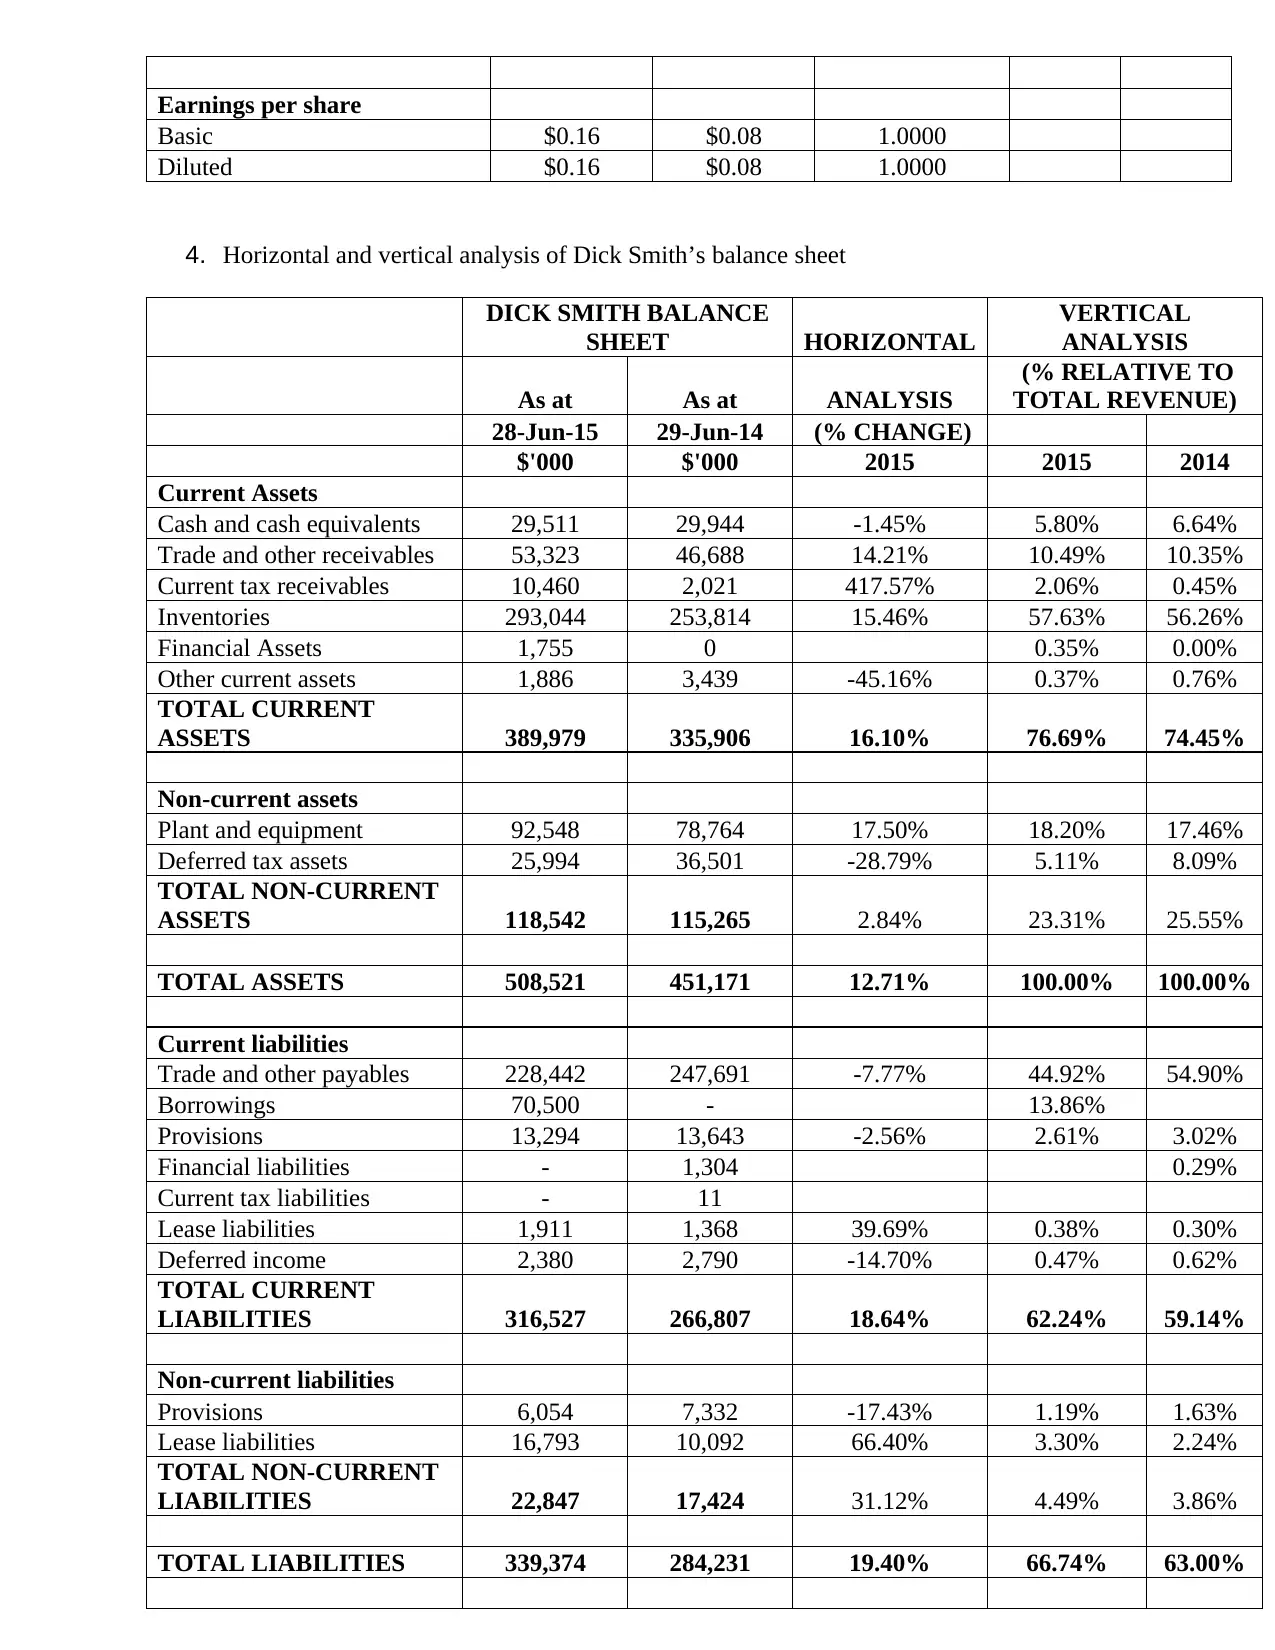
Assets growth: Dick Smith’s current assets and non-current assets have been raised by
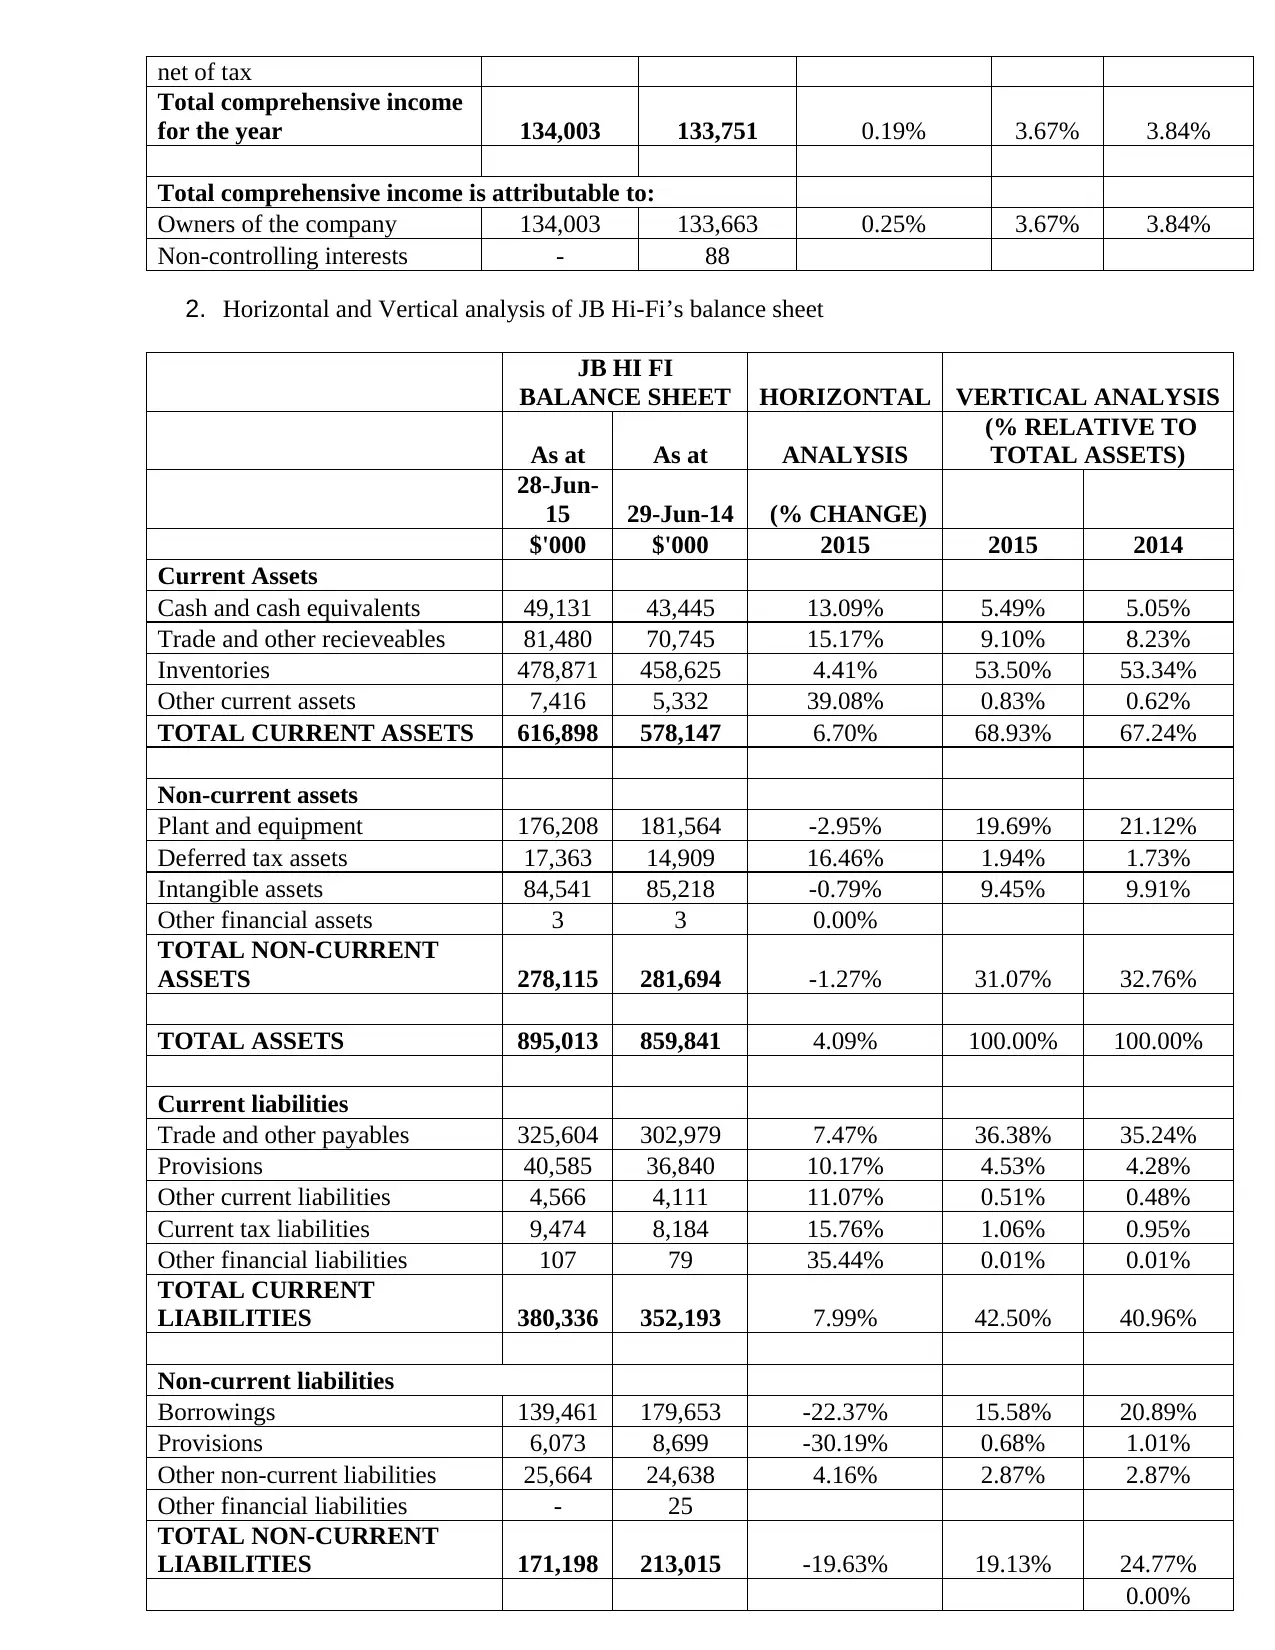
16.10% and 2.84% while in JB Hi-Fi, it is 6.70% and -1.27%. Both the company’s CA has been
increased due to larger cash, receivables, inventories and other short-term assets (Titman, Keown
and Martin, 2015). While, Dick Smith’s non-current assets got improved due to acquisition of
plant and equipment (increased by 17.50%) whilst JB Hi-Fi’s ratio got decreased due to disposal
of P&E and less intangible assets (decrease by 2.95% and 0.79%).
Sales turnover growth: Sales growth in Dick Smith’s revenue is 7.5% higher than
turnover growth in JB Hi-Fi to 4.83% depicts that it enlarged its turnover by greater % may be
due to more demand and increase in product price, which is good.
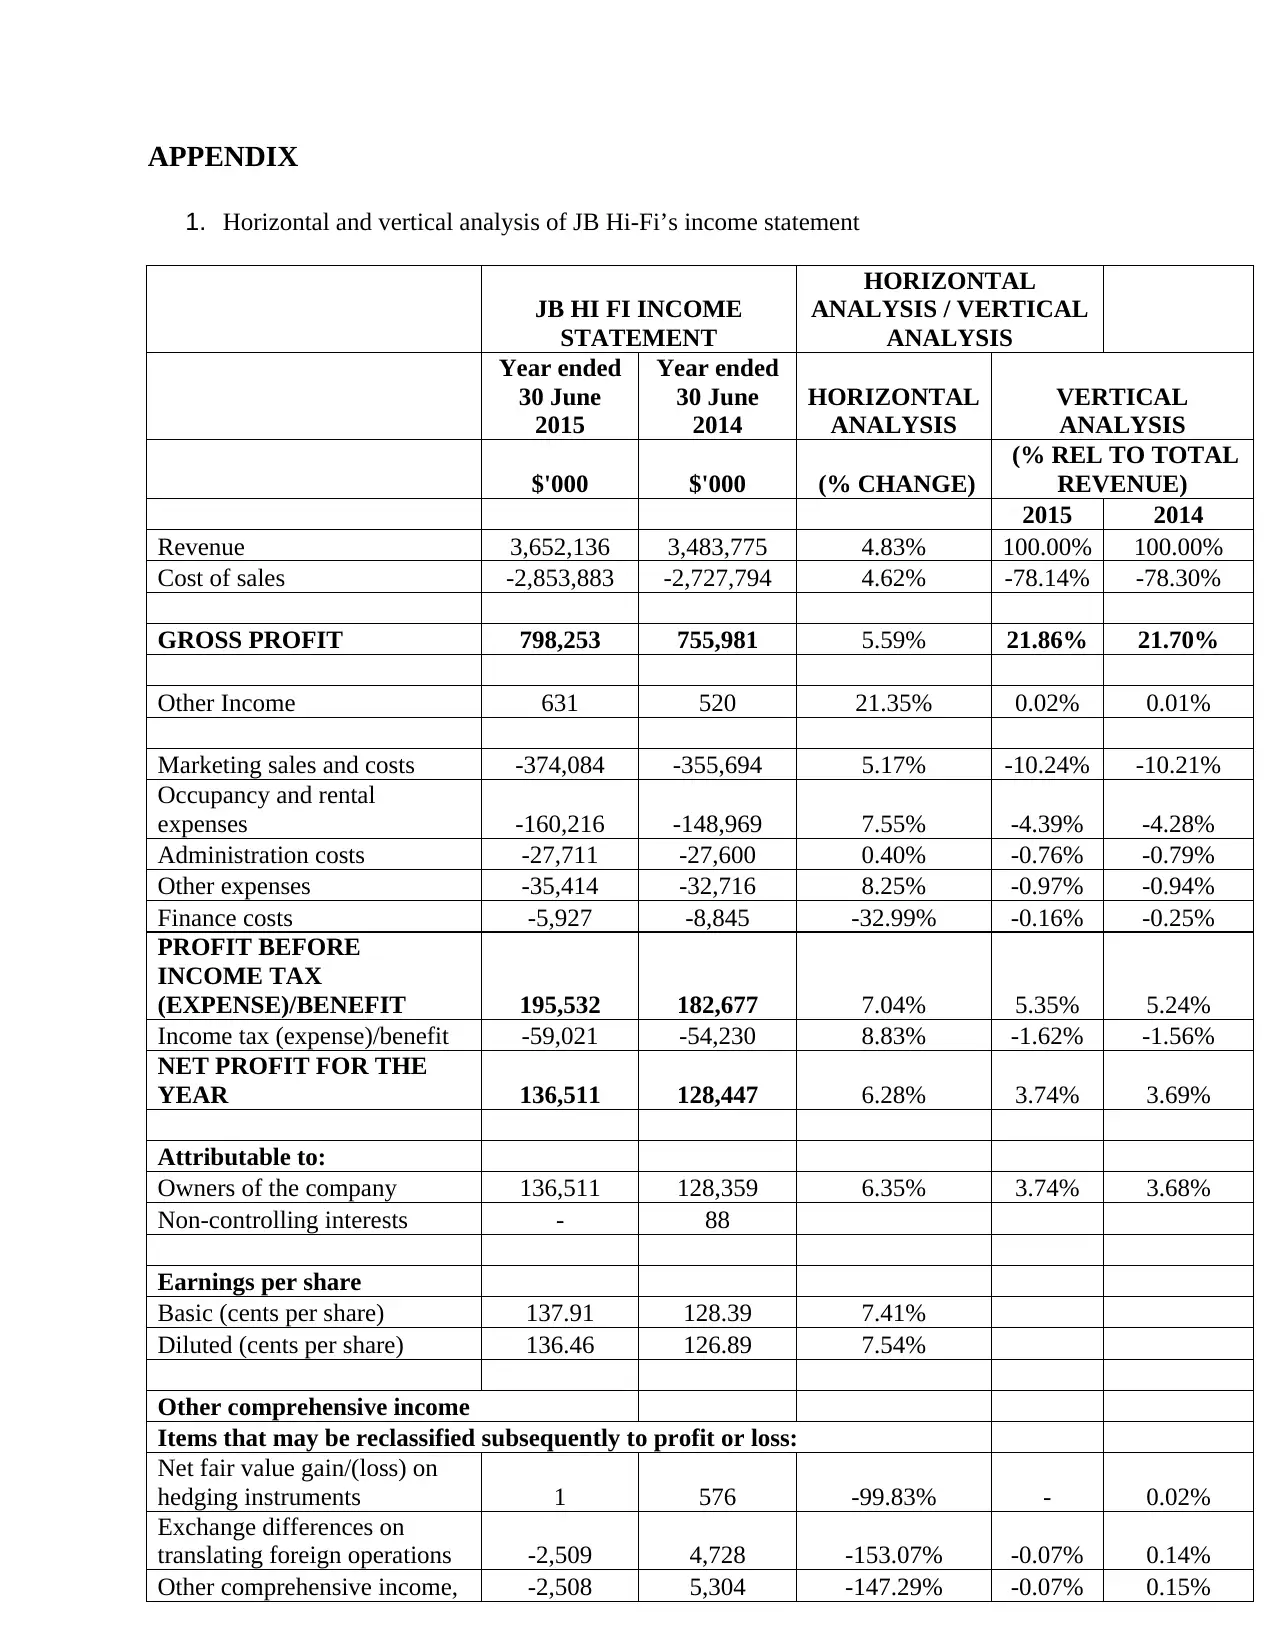
Profit growth: In 2015, JB Hi-Fi’s gross profit got improved by 5.59% due to high
proportionate increase in sales by 4.83% as compare to percentage increase in COGS by 4.62%.
However, its net earnings got improved from 136511 to 128447 million dollar by 6.28%
(Robinson and et.al., 2015). Contrary to this, Dick Smith’s GP and NP got improved by 6.117%
and 91.188% higher than profit growth JB Hi-Fi. It clearly depicts that company greatly
improved its operational performance this year.
Product range: Dick Smith’s product range focuses on mobility, office category and
related accessories. Moreover, its product portfolio consists of low, medium and premium class
entertainment products. It comprises television, high-end audio, computers and mobility devices.
While, JB Hi –Fi expanded their online product range and expand operations into newer market
Every commercial establishment has to examine and analyze their operational
performance and financial years and also compare the results over the years so as make
qualitative decisions. Horizontal and vertical analysis and evaluation of financial ratios are the
useful techniques that businesses often use to measure their financial strength and operational
success. The purpose of this project report is to analyze and compare the financial performance of
two Australian consumer goods retailer, JB Hi-Fi and Dick Smith for the two consecutive years.
It will be done through trend and common-size analysis. At the end, the report will examine
business success through computing varied ratios such as profitability, solvency, liquidity and
efficiency as well.
QUESTION 1
See Appendix 1,2,3 and 4
Horizontal analysis is a technique used by analysts to compare the actual outcome of
current year from that of previous year, also called trend analysis.
Assets growth: Dick Smith’s current assets and non-current assets have been raised by
16.10% and 2.84% while in JB Hi-Fi, it is 6.70% and -1.27%. Both the company’s CA has been
increased due to larger cash, receivables, inventories and other short-term assets (Titman, Keown
and Martin, 2015). While, Dick Smith’s non-current assets got improved due to acquisition of
plant and equipment (increased by 17.50%) whilst JB Hi-Fi’s ratio got decreased due to disposal
of P&E and less intangible assets (decrease by 2.95% and 0.79%).
Sales turnover growth: Sales growth in Dick Smith’s revenue is 7.5% higher than
turnover growth in JB Hi-Fi to 4.83% depicts that it enlarged its turnover by greater % may be
due to more demand and increase in product price, which is good.
Profit growth: In 2015, JB Hi-Fi’s gross profit got improved by 5.59% due to high
proportionate increase in sales by 4.83% as compare to percentage increase in COGS by 4.62%.
However, its net earnings got improved from 136511 to 128447 million dollar by 6.28%
(Robinson and et.al., 2015). Contrary to this, Dick Smith’s GP and NP got improved by 6.117%
and 91.188% higher than profit growth JB Hi-Fi. It clearly depicts that company greatly
improved its operational performance this year.
Product range: Dick Smith’s product range focuses on mobility, office category and
related accessories. Moreover, its product portfolio consists of low, medium and premium class
entertainment products. It comprises television, high-end audio, computers and mobility devices.
While, JB Hi –Fi expanded their online product range and expand operations into newer market
Paraphrase This Document
Need a fresh take? Get an instant paraphrase of this document with our AI Paraphraser
also so as to attract greater customer base, more revenue and competitive strength as well. Its
product range includes consumer electronics (TV, audio equipments, cameras and computers) ,
softwareg (DVD, CD, Blu-ray discs, games, movies) whitegoods, cooking products, musical
instruments, digital content (music, books and videos) and appliances.
Sustainability: JB Hi-Fi managed environmental sustainability through following the
principles of Carbon Disclosure Project (CDP) to minimize their carbon footprint and green
house gas emission. However, Dick Smith’s maintained its environmental sustainability through
complying with environmental legislation and policies and make sure environmental safety for
the community (Dick Smith’s annual report, 2015).
QUESTION 2
See Appendix 1,2,3 and 4
Income statement:
Dick Smith’s profitability statement represents more net yield on total sales revenues as it
got increased from 1.62% to 2.87% in 2015. Effective control over cost of sale, marketing cost
and business overheads are the main reason for better performance in this year (Van den End,
2016). Similarly, JB Hi-Fi’s net profit % on sales grown from 3.68% to 3.74% due to declined
direct cost % on sales to 78.14%, less administration cost % to 0.76% and less financial cost to
0.16%. Comparatively, yield percentage is higher in JB Hi-Fi that clearly demonstrates that it
generated more yield on total revenues and performing well in the market (Rehman, Khan and
Khokhar, 2015).
Balance sheet:
In 2015, Dick Smith’s current assets % on total assets got improved to 76.69% due to
more receivables, cash and stock whereas non-current assets % got reduced to 23.31% due to
high decrease in deferred tax assets to 28.79%. On the other hand, % of current and non-current
liabilities has grown up to 62.24% and 4.49% due to more borrowings and short-term and long-
term lease liabilities. Whereas, JB Hi-Fi’s current assets % got improved to 68.93% because of
more cash, receivables, inventory and other short-term assets, whereas, fixed assets % has been
declined to 31.07% due to sale of fixed assets (Weygandt, Kimmel and Kieso, 2015). While, % of
current liabilities enhanced to 42.50% whilst % of non-current obligations came down to 19.13%.
In this year, 38.38% assets represent equity ownership whereas in Dick Smith, it has been
declined to 33.26%. Thus, it can be said that JB Hi-Fi’s assets represents more ownership of
owner’s equity and less through borrowed finance.
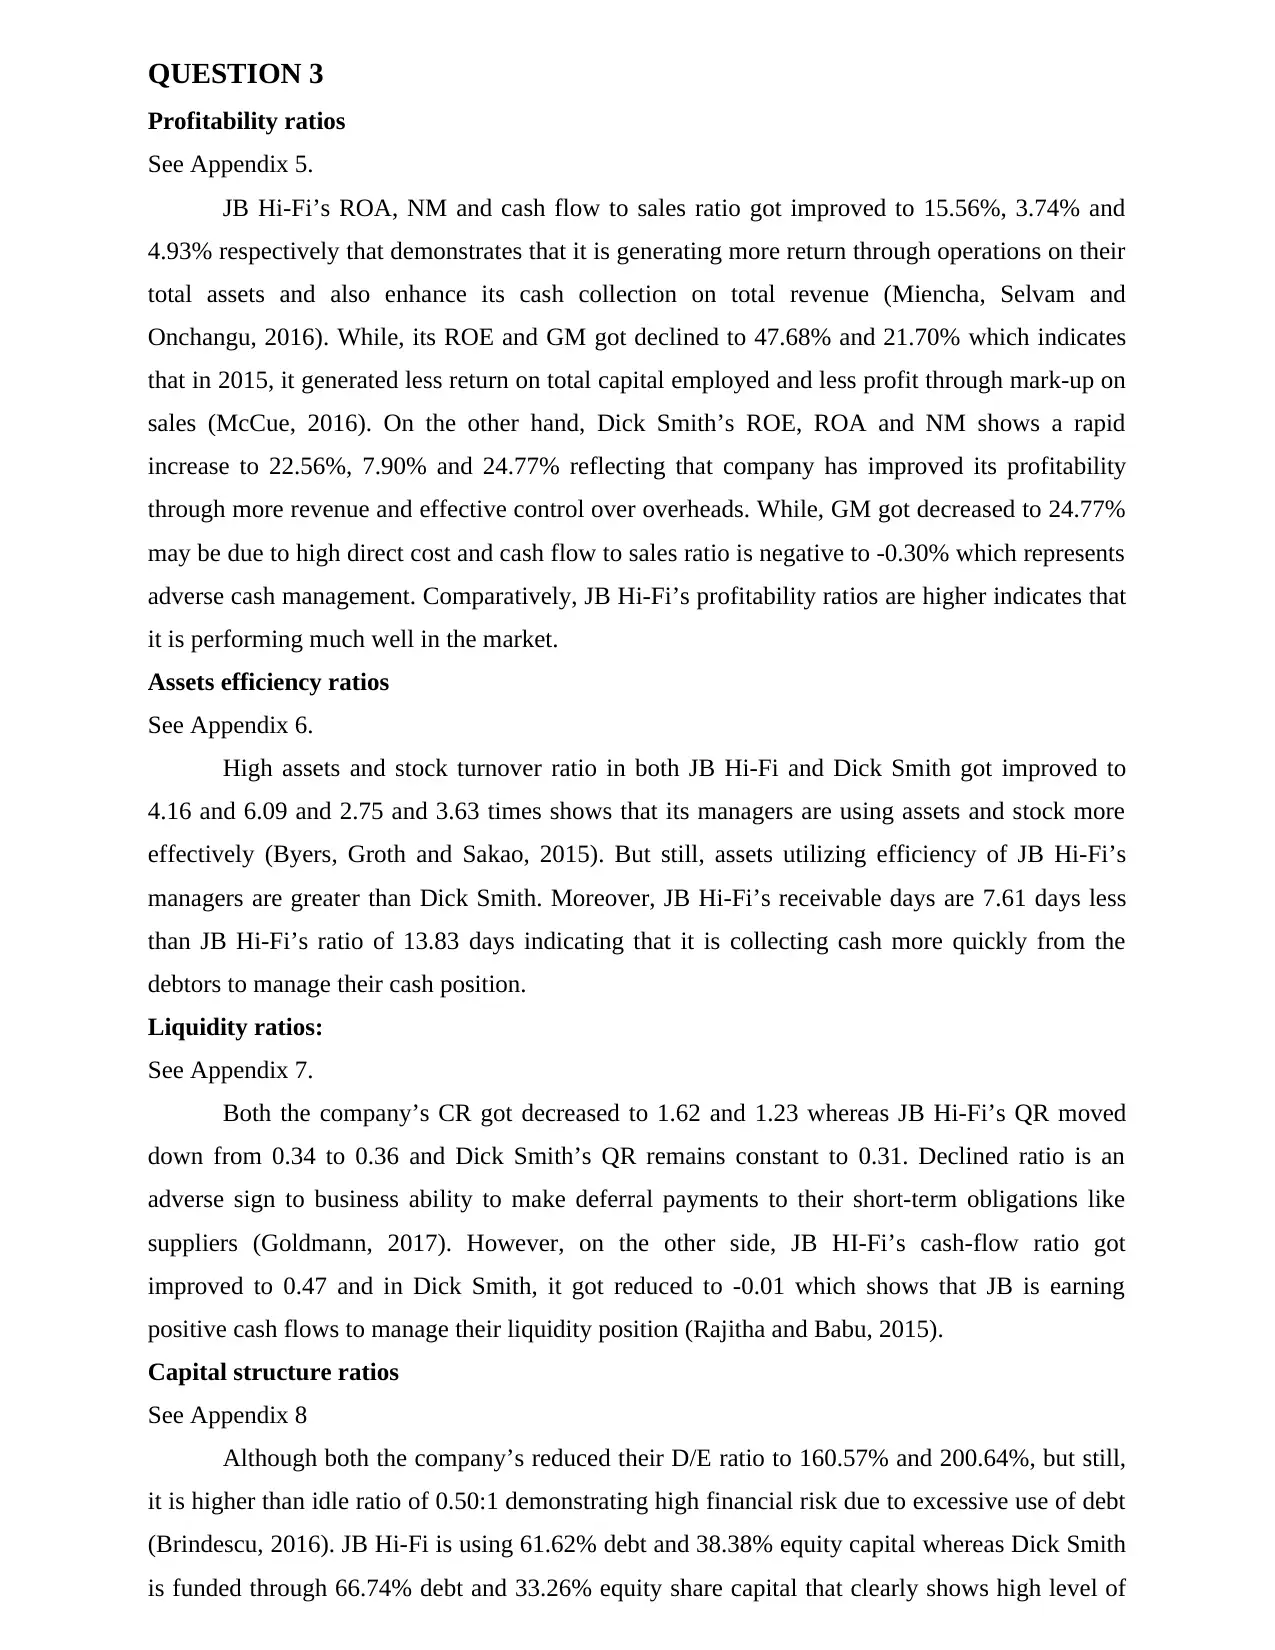
QUESTION 3
Profitability ratios
See Appendix 5.
JB Hi-Fi’s ROA, NM and cash flow to sales ratio got improved to 15.56%, 3.74% and
4.93% respectively that demonstrates that it is generating more return through operations on their
total assets and also enhance its cash collection on total revenue (Miencha, Selvam and
Onchangu, 2016). While, its ROE and GM got declined to 47.68% and 21.70% which indicates
that in 2015, it generated less return on total capital employed and less profit through mark-up on
sales (McCue, 2016). On the other hand, Dick Smith’s ROE, ROA and NM shows a rapid
increase to 22.56%, 7.90% and 24.77% reflecting that company has improved its profitability
through more revenue and effective control over overheads. While, GM got decreased to 24.77%
may be due to high direct cost and cash flow to sales ratio is negative to -0.30% which represents
adverse cash management. Comparatively, JB Hi-Fi’s profitability ratios are higher indicates that
it is performing much well in the market.
Assets efficiency ratios
See Appendix 6.
High assets and stock turnover ratio in both JB Hi-Fi and Dick Smith got improved to
4.16 and 6.09 and 2.75 and 3.63 times shows that its managers are using assets and stock more
effectively (Byers, Groth and Sakao, 2015). But still, assets utilizing efficiency of JB Hi-Fi’s
managers are greater than Dick Smith. Moreover, JB Hi-Fi’s receivable days are 7.61 days less
than JB Hi-Fi’s ratio of 13.83 days indicating that it is collecting cash more quickly from the
debtors to manage their cash position.
Liquidity ratios:
See Appendix 7.
Both the company’s CR got decreased to 1.62 and 1.23 whereas JB Hi-Fi’s QR moved
down from 0.34 to 0.36 and Dick Smith’s QR remains constant to 0.31. Declined ratio is an
adverse sign to business ability to make deferral payments to their short-term obligations like
suppliers (Goldmann, 2017). However, on the other side, JB HI-Fi’s cash-flow ratio got
improved to 0.47 and in Dick Smith, it got reduced to -0.01 which shows that JB is earning
positive cash flows to manage their liquidity position (Rajitha and Babu, 2015).
Capital structure ratios
See Appendix 8
Although both the company’s reduced their D/E ratio to 160.57% and 200.64%, but still,
it is higher than idle ratio of 0.50:1 demonstrating high financial risk due to excessive use of debt
(Brindescu, 2016). JB Hi-Fi is using 61.62% debt and 38.38% equity capital whereas Dick Smith
is funded through 66.74% debt and 33.26% equity share capital that clearly shows high level of
⊘ This is a preview!⊘
Do you want full access?
Subscribe today to unlock all pages.
Trusted by 1+ million students worldwide
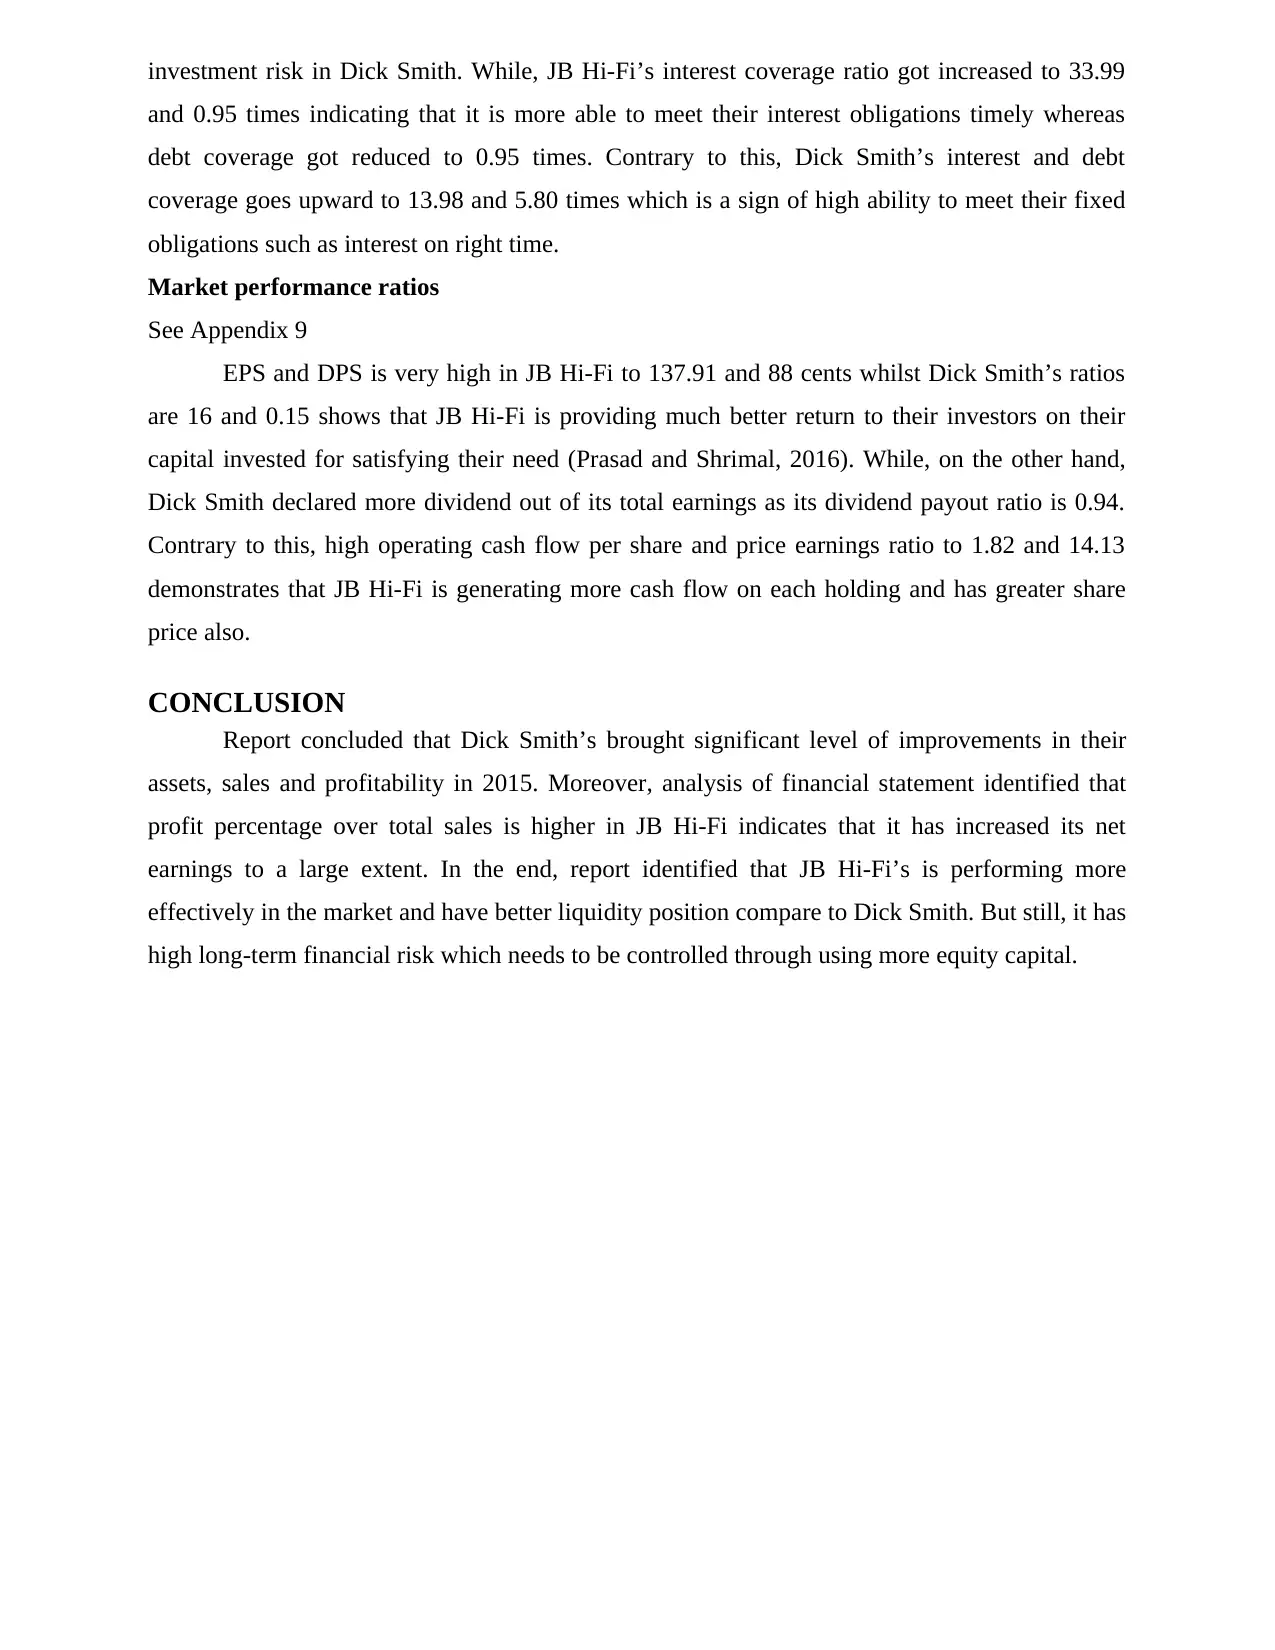
investment risk in Dick Smith. While, JB Hi-Fi’s interest coverage ratio got increased to 33.99
and 0.95 times indicating that it is more able to meet their interest obligations timely whereas
debt coverage got reduced to 0.95 times. Contrary to this, Dick Smith’s interest and debt
coverage goes upward to 13.98 and 5.80 times which is a sign of high ability to meet their fixed
obligations such as interest on right time.
Market performance ratios
See Appendix 9
EPS and DPS is very high in JB Hi-Fi to 137.91 and 88 cents whilst Dick Smith’s ratios
are 16 and 0.15 shows that JB Hi-Fi is providing much better return to their investors on their
capital invested for satisfying their need (Prasad and Shrimal, 2016). While, on the other hand,
Dick Smith declared more dividend out of its total earnings as its dividend payout ratio is 0.94.
Contrary to this, high operating cash flow per share and price earnings ratio to 1.82 and 14.13
demonstrates that JB Hi-Fi is generating more cash flow on each holding and has greater share
price also.
CONCLUSION
Report concluded that Dick Smith’s brought significant level of improvements in their
assets, sales and profitability in 2015. Moreover, analysis of financial statement identified that
profit percentage over total sales is higher in JB Hi-Fi indicates that it has increased its net
earnings to a large extent. In the end, report identified that JB Hi-Fi’s is performing more
effectively in the market and have better liquidity position compare to Dick Smith. But still, it has
high long-term financial risk which needs to be controlled through using more equity capital.
Paraphrase This Document
Need a fresh take? Get an instant paraphrase of this document with our AI Paraphraser
REFERENCE
Books and Journals
Brindescu, O. A. D., 2016. Solvency ratio as a tool for bankruptcy prediction. Ecoforum Journal.
5(2). pp. 22-36.
Byers, S. S., Groth, J. C. and Sakao, T., 2015. Using portfolio theory to improve resource
efficiency of invested capital. Journal of Cleaner Production, 98(12). pp. 156-165.
Goldmann, K., 2017. Financial Liquidity and Profitability Management in Practice of Polish
Business. In Financial Environment and Business Development. Springer International
Publishing. 14(3). pp. 103-112
McCue, M. J., 2016. Early Experience of Financial Performance and Solvency of Medicaid-
Focused Insurers Under ACA Expansion. Medical Care Research and Review. 12(2).
p.1077558716663389.
Miencha, I. O., Selvam, M. and Onchangu, S. A., 2016. Return on Assets Efficiency of Kenyan
Banking Sector. Journal of Internet Banking and Commerce. 21(2). pp. 1-10.
Prasad, H. and Shrimal, K., 2016. An Empirical Study on Effect of Profitability and Market
Value Ratios on Market Capitalization of Infrastructural Companies In India. Global
Journal For Research Analysis. 4(5). pp. 16-30.
Rajitha, P. and Babu, P .C., 2015. A Study on Liquidity and Profitability Position with Reference
to ITL Pvt. Ltd. The International Journal of Business & Management. 3(8). pp. 98-105.
Rehman, M. Z., Khan, M. N. and Khokhar, I., 2015. Investigating Liquidity-Profitability
Relationship: Evidence from Companies Listed in Saudi Stock Exchange (Tadawul).
Journal of Applied Finance and Banking. 5(3). pp. 159-163.
Robinson, T. R. and et.al., 2015. International financial statement analysis. John Wiley & Sons.
Titman, S., Keown, A. J. and Martin, J. D., 2015. Financial management: Principles and
applications. Pearson.
Van den End, J. W., 2016. A macroprudential approach to address liquidity risk with the Loan-to-
Deposit ratio. The European Journal of Finance. 22(3). pp. 237-253.
Weygandt, J. J., Kimmel, P. D. and Kieso, D. E., 2015. Financial & Managerial Accounting.
John Wiley & Sons.
Online
Dick Smith’s annual report. 2015. [PDF]. Available through: <
http://www.asx.com.au/asxpdf/20150818/pdf/430kvhrl8cpg0l.pdf>. [Accessed on 24th
October 2016].
APPENDIX
1. Horizontal and vertical analysis of JB Hi-Fi’s income statement
JB HI FI INCOME
STATEMENT
HORIZONTAL
ANALYSIS / VERTICAL
ANALYSIS
Year ended
30 June
2015
Year ended
30 June
2014
HORIZONTAL
ANALYSIS
VERTICAL
ANALYSIS
$'000 $'000 (% CHANGE)
(% REL TO TOTAL
REVENUE)
2015 2014
Revenue 3,652,136 3,483,775 4.83% 100.00% 100.00%
Cost of sales -2,853,883 -2,727,794 4.62% -78.14% -78.30%
GROSS PROFIT 798,253 755,981 5.59% 21.86% 21.70%
Other Income 631 520 21.35% 0.02% 0.01%
Marketing sales and costs -374,084 -355,694 5.17% -10.24% -10.21%
Occupancy and rental
expenses -160,216 -148,969 7.55% -4.39% -4.28%
Administration costs -27,711 -27,600 0.40% -0.76% -0.79%
Other expenses -35,414 -32,716 8.25% -0.97% -0.94%
Finance costs -5,927 -8,845 -32.99% -0.16% -0.25%
PROFIT BEFORE
INCOME TAX
(EXPENSE)/BENEFIT 195,532 182,677 7.04% 5.35% 5.24%
Income tax (expense)/benefit -59,021 -54,230 8.83% -1.62% -1.56%
NET PROFIT FOR THE
YEAR 136,511 128,447 6.28% 3.74% 3.69%
Attributable to:
Owners of the company 136,511 128,359 6.35% 3.74% 3.68%
Non-controlling interests - 88
Earnings per share
Basic (cents per share) 137.91 128.39 7.41%
Diluted (cents per share) 136.46 126.89 7.54%
Other comprehensive income
Items that may be reclassified subsequently to profit or loss:
Net fair value gain/(loss) on
hedging instruments 1 576 -99.83% - 0.02%
Exchange differences on
translating foreign operations -2,509 4,728 -153.07% -0.07% 0.14%
Other comprehensive income, -2,508 5,304 -147.29% -0.07% 0.15%
⊘ This is a preview!⊘
Do you want full access?
Subscribe today to unlock all pages.
Trusted by 1+ million students worldwide
net of tax
Total comprehensive income
for the year 134,003 133,751 0.19% 3.67% 3.84%
Total comprehensive income is attributable to:
Owners of the company 134,003 133,663 0.25% 3.67% 3.84%
Non-controlling interests - 88
2. Horizontal and Vertical analysis of JB Hi-Fi’s balance sheet
JB HI FI
BALANCE SHEET HORIZONTAL VERTICAL ANALYSIS
As at As at ANALYSIS
(% RELATIVE TO
TOTAL ASSETS)
28-Jun-
15 29-Jun-14 (% CHANGE)
$'000 $'000 2015 2015 2014
Current Assets
Cash and cash equivalents 49,131 43,445 13.09% 5.49% 5.05%
Trade and other recieveables 81,480 70,745 15.17% 9.10% 8.23%
Inventories 478,871 458,625 4.41% 53.50% 53.34%
Other current assets 7,416 5,332 39.08% 0.83% 0.62%
TOTAL CURRENT ASSETS 616,898 578,147 6.70% 68.93% 67.24%
Non-current assets
Plant and equipment 176,208 181,564 -2.95% 19.69% 21.12%
Deferred tax assets 17,363 14,909 16.46% 1.94% 1.73%
Intangible assets 84,541 85,218 -0.79% 9.45% 9.91%
Other financial assets 3 3 0.00%
TOTAL NON-CURRENT
ASSETS 278,115 281,694 -1.27% 31.07% 32.76%
TOTAL ASSETS 895,013 859,841 4.09% 100.00% 100.00%
Current liabilities
Trade and other payables 325,604 302,979 7.47% 36.38% 35.24%
Provisions 40,585 36,840 10.17% 4.53% 4.28%
Other current liabilities 4,566 4,111 11.07% 0.51% 0.48%
Current tax liabilities 9,474 8,184 15.76% 1.06% 0.95%
Other financial liabilities 107 79 35.44% 0.01% 0.01%
TOTAL CURRENT
LIABILITIES 380,336 352,193 7.99% 42.50% 40.96%
Non-current liabilities
Borrowings 139,461 179,653 -22.37% 15.58% 20.89%
Provisions 6,073 8,699 -30.19% 0.68% 1.01%
Other non-current liabilities 25,664 24,638 4.16% 2.87% 2.87%
Other financial liabilities - 25
TOTAL NON-CURRENT
LIABILITIES 171,198 213,015 -19.63% 19.13% 24.77%
0.00%
Paraphrase This Document
Need a fresh take? Get an instant paraphrase of this document with our AI Paraphraser
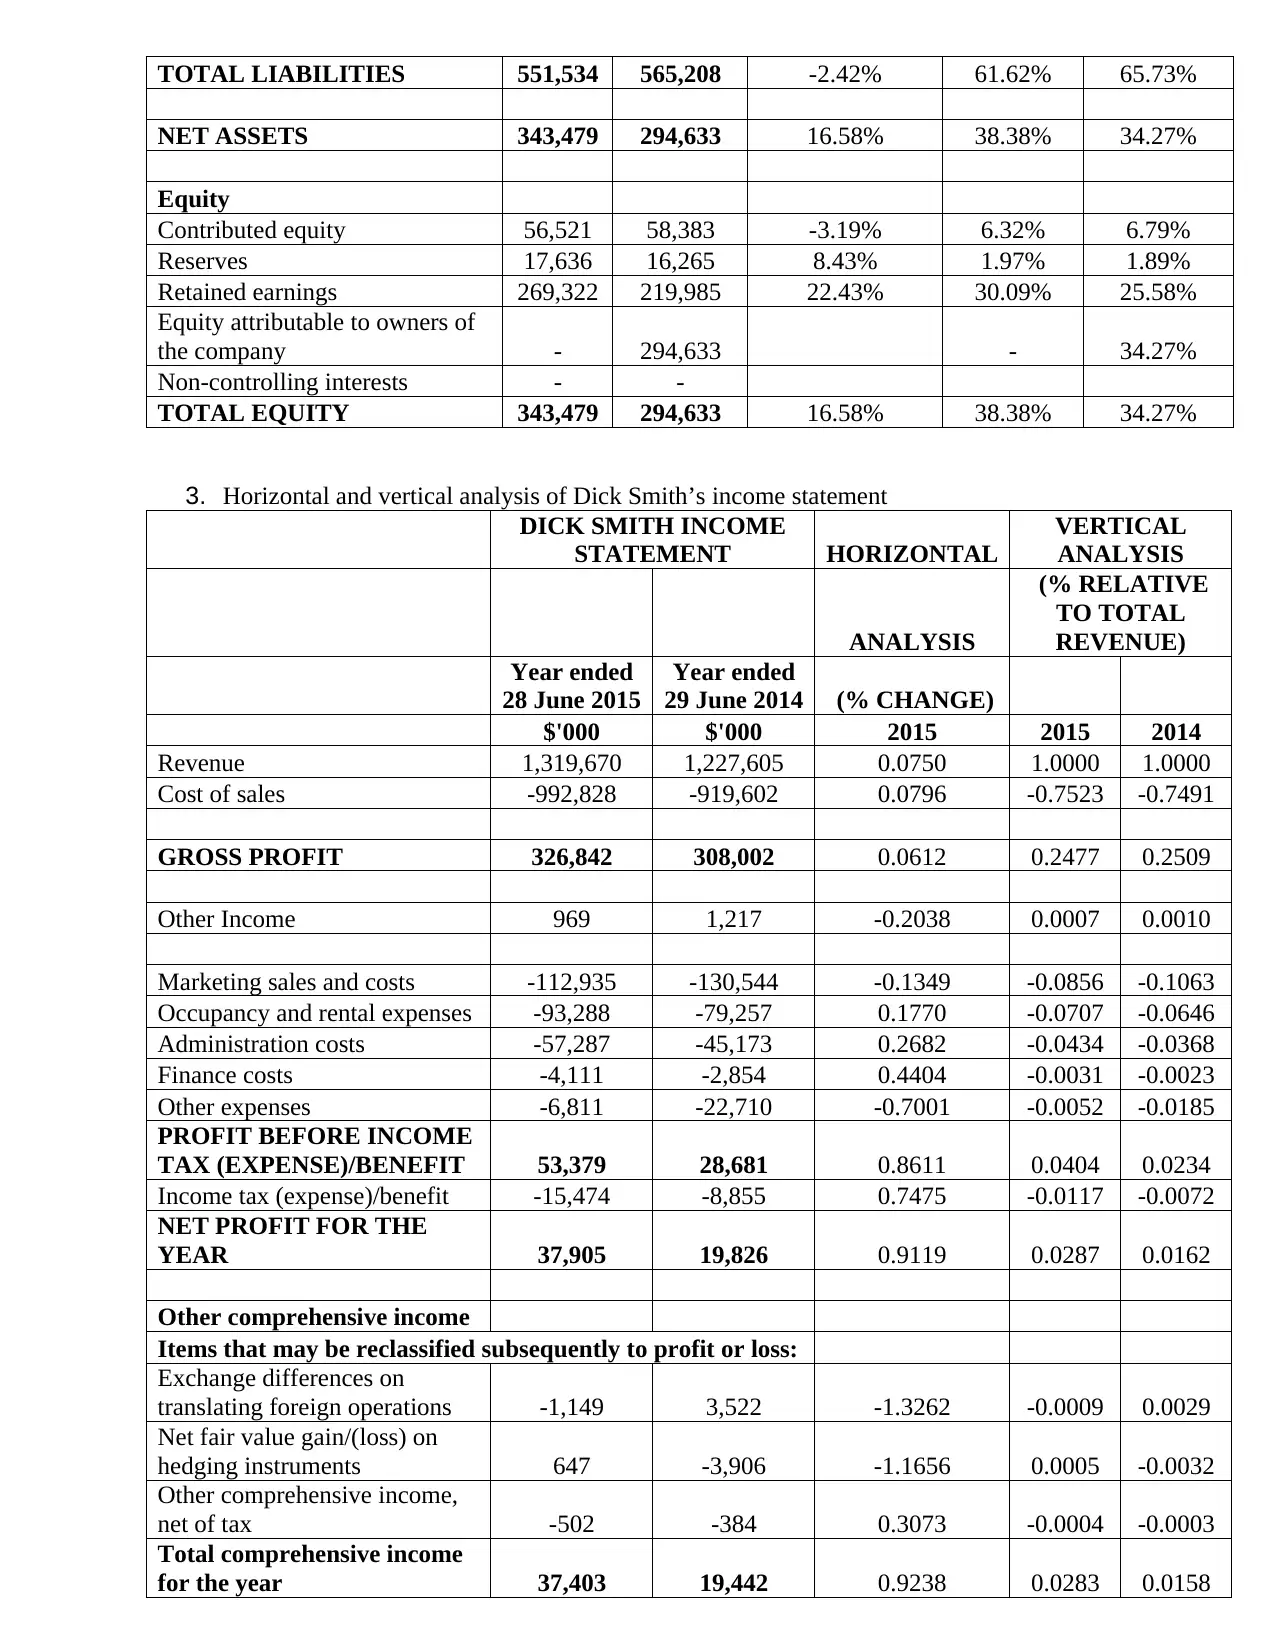
TOTAL LIABILITIES 551,534 565,208 -2.42% 61.62% 65.73%
NET ASSETS 343,479 294,633 16.58% 38.38% 34.27%
Equity
Contributed equity 56,521 58,383 -3.19% 6.32% 6.79%
Reserves 17,636 16,265 8.43% 1.97% 1.89%
Retained earnings 269,322 219,985 22.43% 30.09% 25.58%
Equity attributable to owners of
the company - 294,633 - 34.27%
Non-controlling interests - -
TOTAL EQUITY 343,479 294,633 16.58% 38.38% 34.27%
3. Horizontal and vertical analysis of Dick Smith’s income statement
DICK SMITH INCOME
STATEMENT HORIZONTAL
VERTICAL
ANALYSIS
ANALYSIS
(% RELATIVE
TO TOTAL
REVENUE)
Year ended
28 June 2015
Year ended
29 June 2014 (% CHANGE)
$'000 $'000 2015 2015 2014
Revenue 1,319,670 1,227,605 0.0750 1.0000 1.0000
Cost of sales -992,828 -919,602 0.0796 -0.7523 -0.7491
GROSS PROFIT 326,842 308,002 0.0612 0.2477 0.2509
Other Income 969 1,217 -0.2038 0.0007 0.0010
Marketing sales and costs -112,935 -130,544 -0.1349 -0.0856 -0.1063
Occupancy and rental expenses -93,288 -79,257 0.1770 -0.0707 -0.0646
Administration costs -57,287 -45,173 0.2682 -0.0434 -0.0368
Finance costs -4,111 -2,854 0.4404 -0.0031 -0.0023
Other expenses -6,811 -22,710 -0.7001 -0.0052 -0.0185
PROFIT BEFORE INCOME
TAX (EXPENSE)/BENEFIT 53,379 28,681 0.8611 0.0404 0.0234
Income tax (expense)/benefit -15,474 -8,855 0.7475 -0.0117 -0.0072
NET PROFIT FOR THE
YEAR 37,905 19,826 0.9119 0.0287 0.0162
Other comprehensive income
Items that may be reclassified subsequently to profit or loss:
Exchange differences on
translating foreign operations -1,149 3,522 -1.3262 -0.0009 0.0029
Net fair value gain/(loss) on
hedging instruments 647 -3,906 -1.1656 0.0005 -0.0032
Other comprehensive income,
net of tax -502 -384 0.3073 -0.0004 -0.0003
Total comprehensive income
for the year 37,403 19,442 0.9238 0.0283 0.0158
Earnings per share
Basic $0.16 $0.08 1.0000
Diluted $0.16 $0.08 1.0000
4. Horizontal and vertical analysis of Dick Smith’s balance sheet
DICK SMITH BALANCE
SHEET HORIZONTAL
VERTICAL
ANALYSIS
As at As at ANALYSIS
(% RELATIVE TO
TOTAL REVENUE)
28-Jun-15 29-Jun-14 (% CHANGE)
$'000 $'000 2015 2015 2014
Current Assets
Cash and cash equivalents 29,511 29,944 -1.45% 5.80% 6.64%
Trade and other receivables 53,323 46,688 14.21% 10.49% 10.35%
Current tax receivables 10,460 2,021 417.57% 2.06% 0.45%
Inventories 293,044 253,814 15.46% 57.63% 56.26%
Financial Assets 1,755 0 0.35% 0.00%
Other current assets 1,886 3,439 -45.16% 0.37% 0.76%
TOTAL CURRENT
ASSETS 389,979 335,906 16.10% 76.69% 74.45%
Non-current assets
Plant and equipment 92,548 78,764 17.50% 18.20% 17.46%
Deferred tax assets 25,994 36,501 -28.79% 5.11% 8.09%
TOTAL NON-CURRENT
ASSETS 118,542 115,265 2.84% 23.31% 25.55%
TOTAL ASSETS 508,521 451,171 12.71% 100.00% 100.00%
Current liabilities
Trade and other payables 228,442 247,691 -7.77% 44.92% 54.90%
Borrowings 70,500 - 13.86%
Provisions 13,294 13,643 -2.56% 2.61% 3.02%
Financial liabilities - 1,304 0.29%
Current tax liabilities - 11
Lease liabilities 1,911 1,368 39.69% 0.38% 0.30%
Deferred income 2,380 2,790 -14.70% 0.47% 0.62%
TOTAL CURRENT
LIABILITIES 316,527 266,807 18.64% 62.24% 59.14%
Non-current liabilities
Provisions 6,054 7,332 -17.43% 1.19% 1.63%
Lease liabilities 16,793 10,092 66.40% 3.30% 2.24%
TOTAL NON-CURRENT
LIABILITIES 22,847 17,424 31.12% 4.49% 3.86%
TOTAL LIABILITIES 339,374 284,231 19.40% 66.74% 63.00%
⊘ This is a preview!⊘
Do you want full access?
Subscribe today to unlock all pages.
Trusted by 1+ million students worldwide
1 out of 14
Related Documents


Your All-in-One AI-Powered Toolkit for Academic Success.
+13062052269
info@desklib.com
Available 24*7 on WhatsApp / Email
![[object Object]](/_next/static/media/star-bottom.7253800d.svg)
Unlock your academic potential
Copyright © 2020–2026 A2Z Services. All Rights Reserved. Developed and managed by ZUCOL.