BMP6015 - Financial Reporting: Heywood Plc Performance Analysis
VerifiedAdded on 2023/06/11
|18
|3226
|378
Report
AI Summary
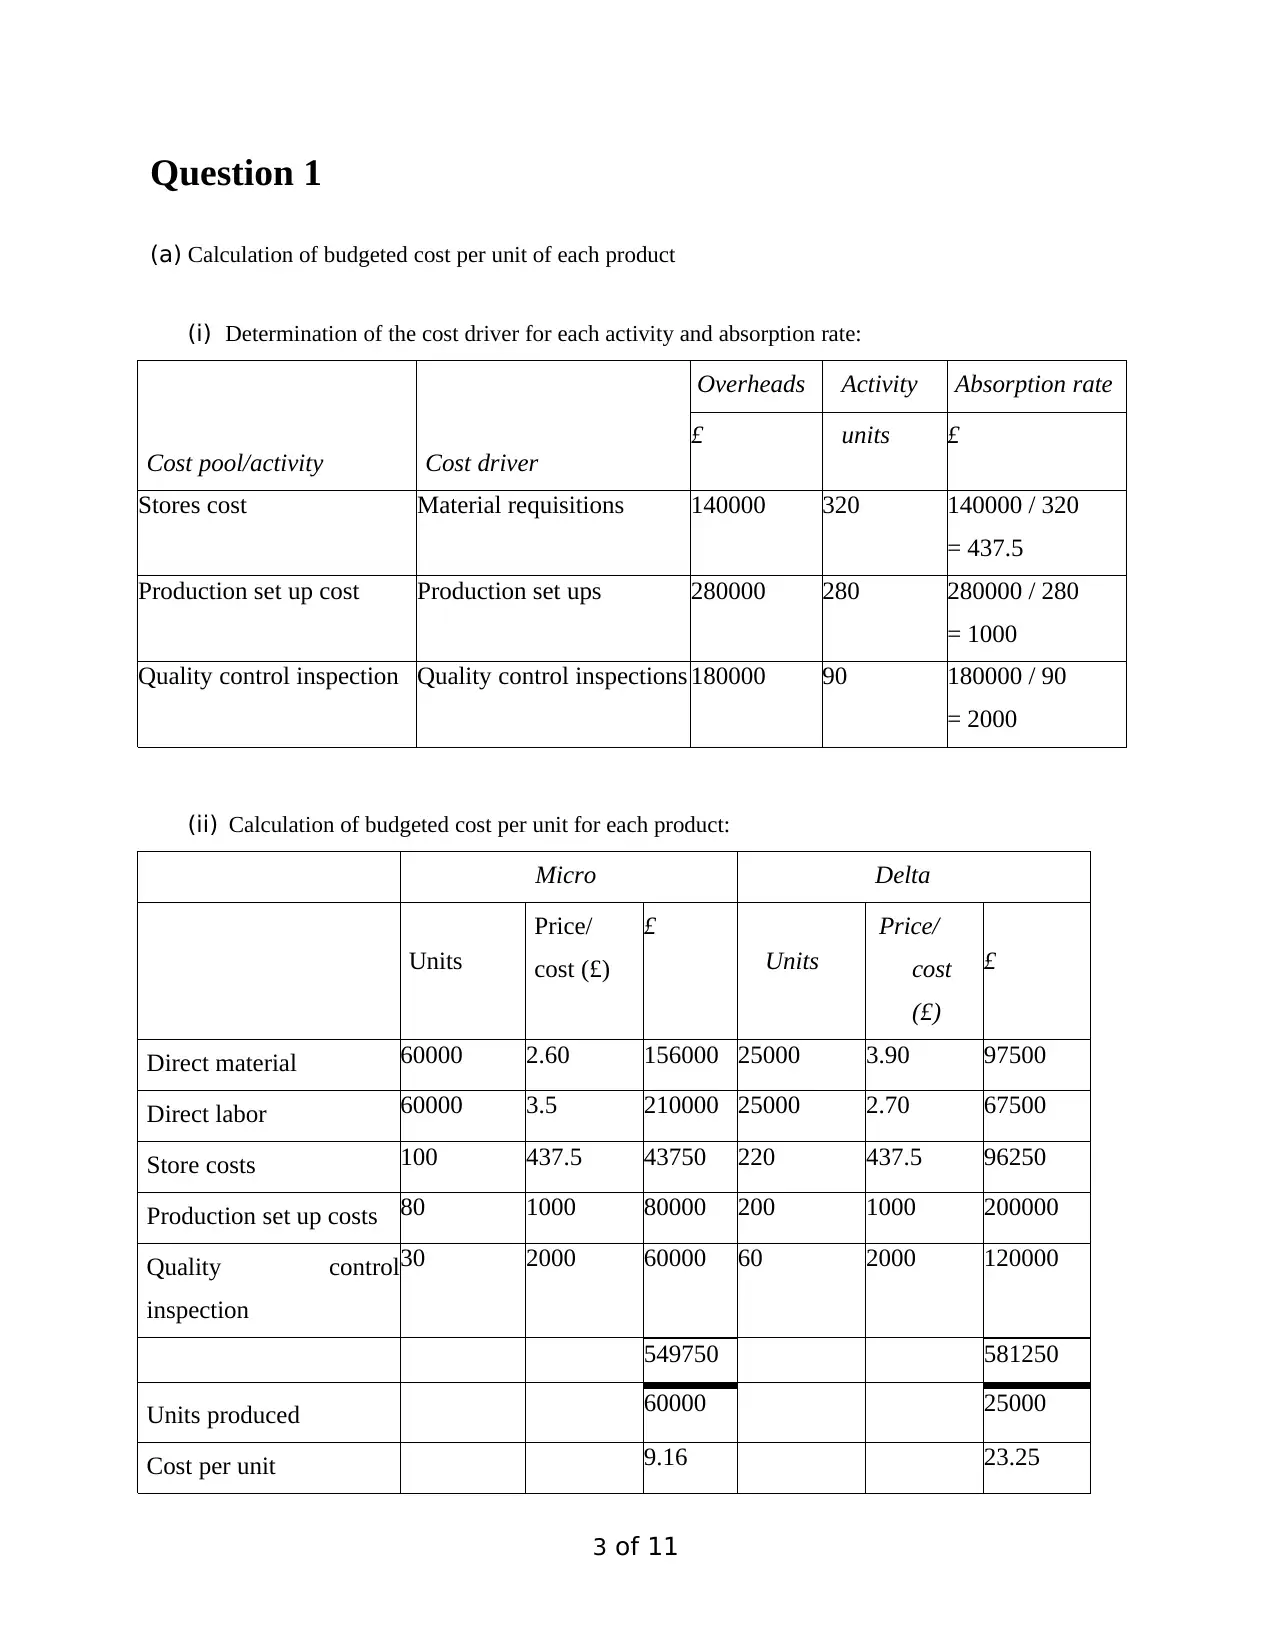
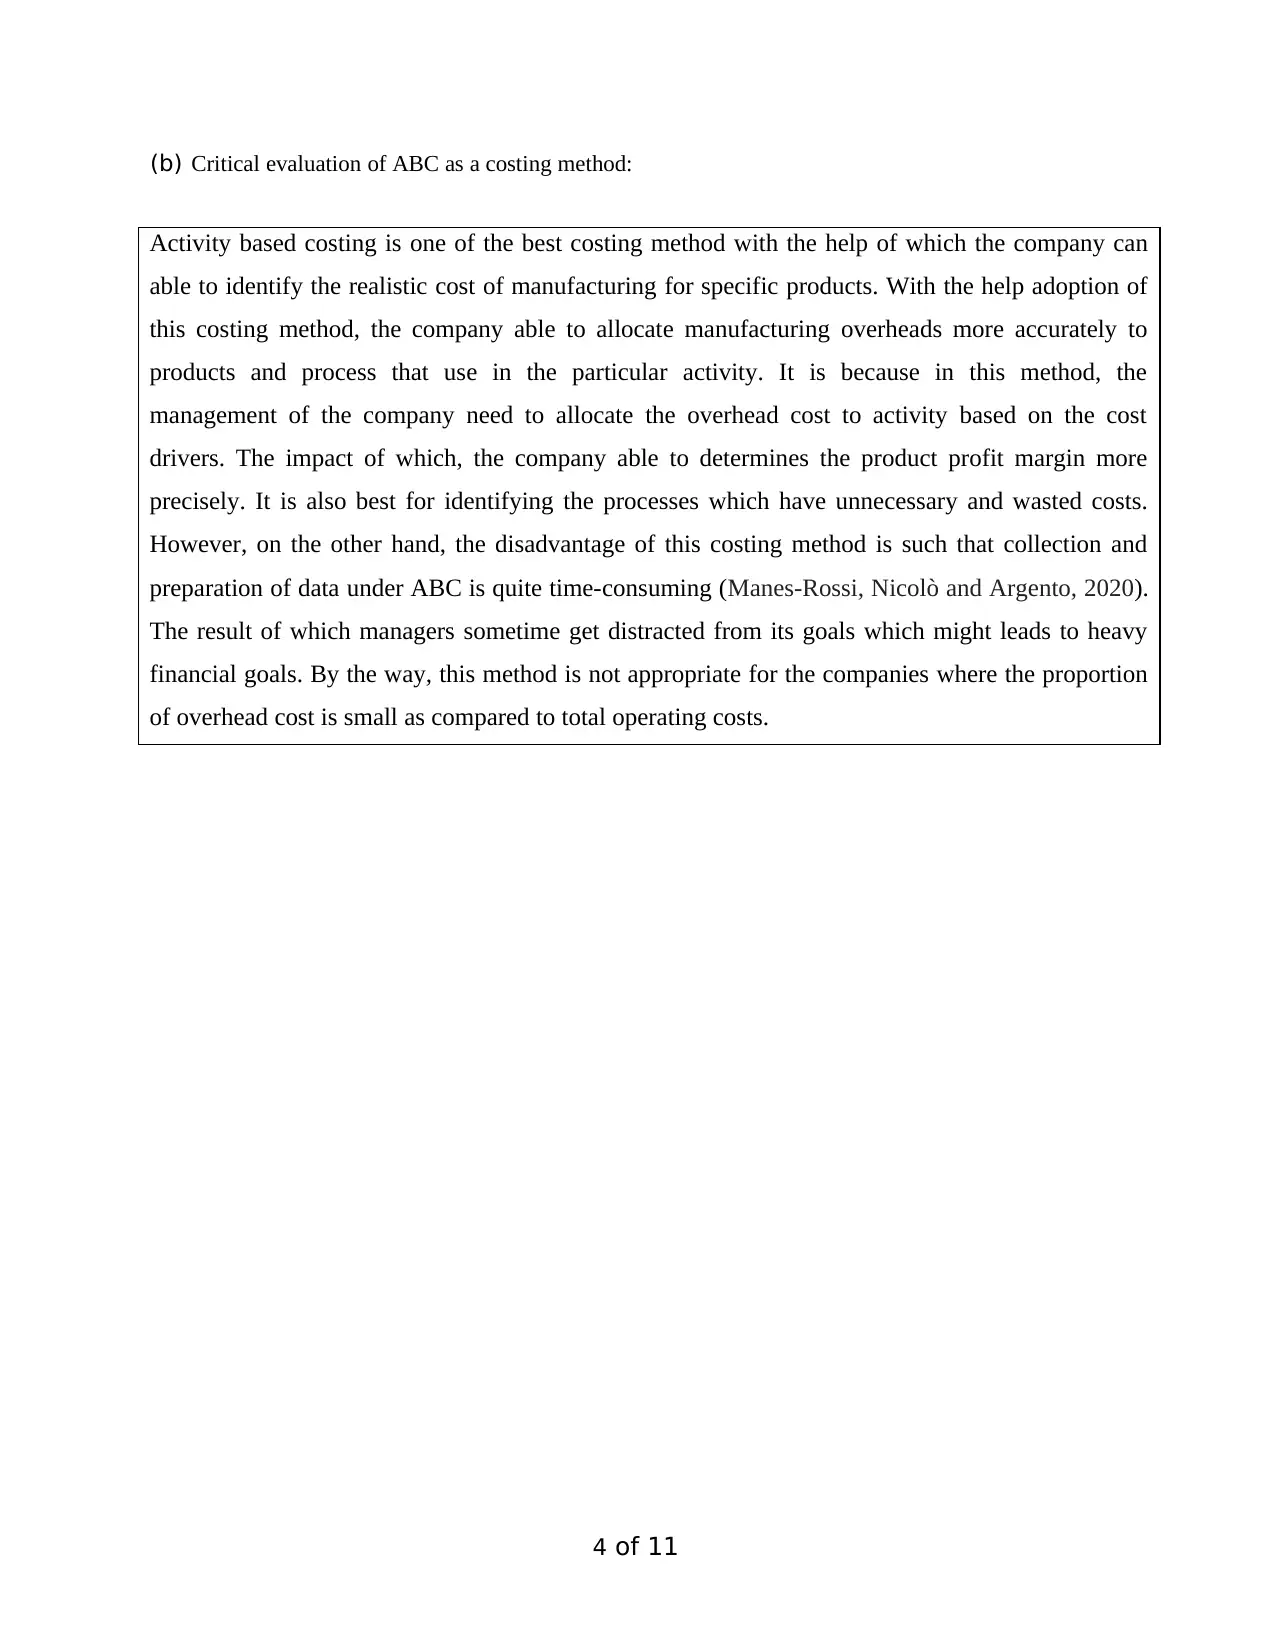
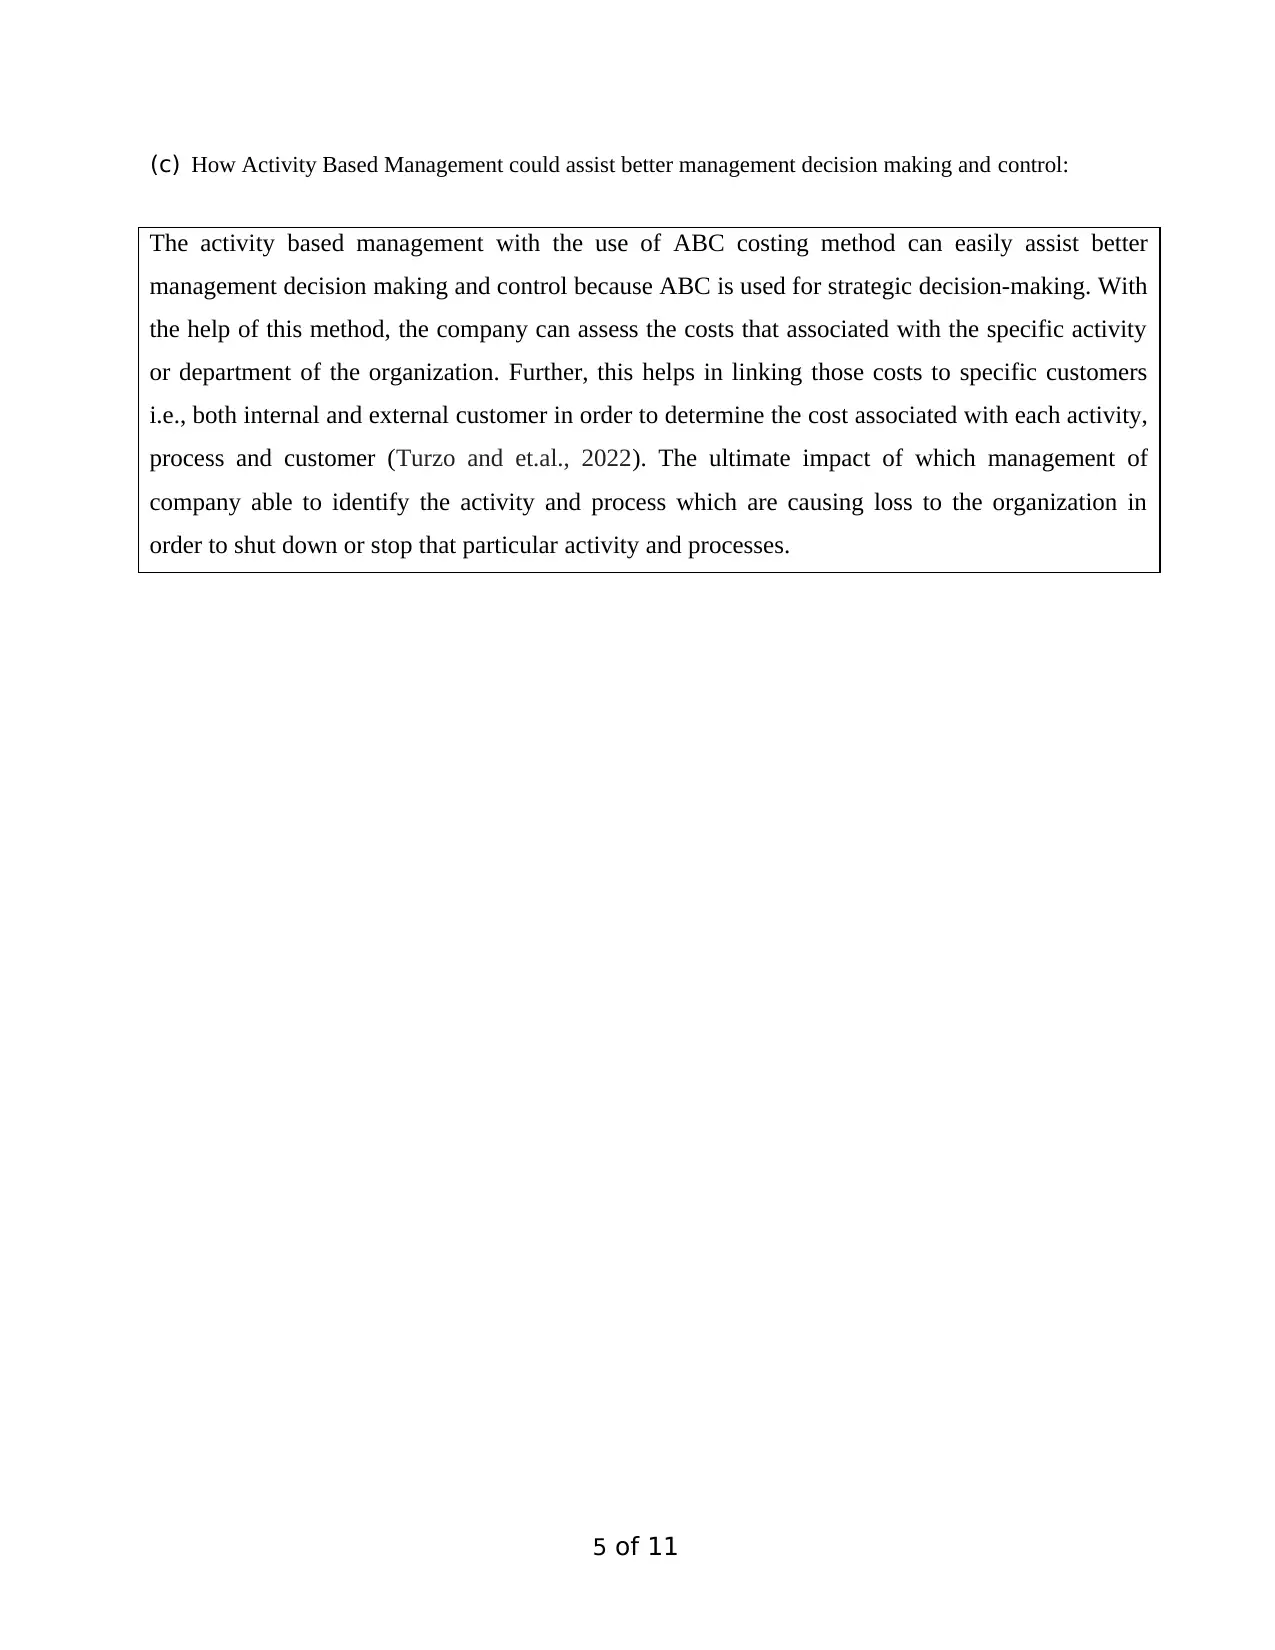
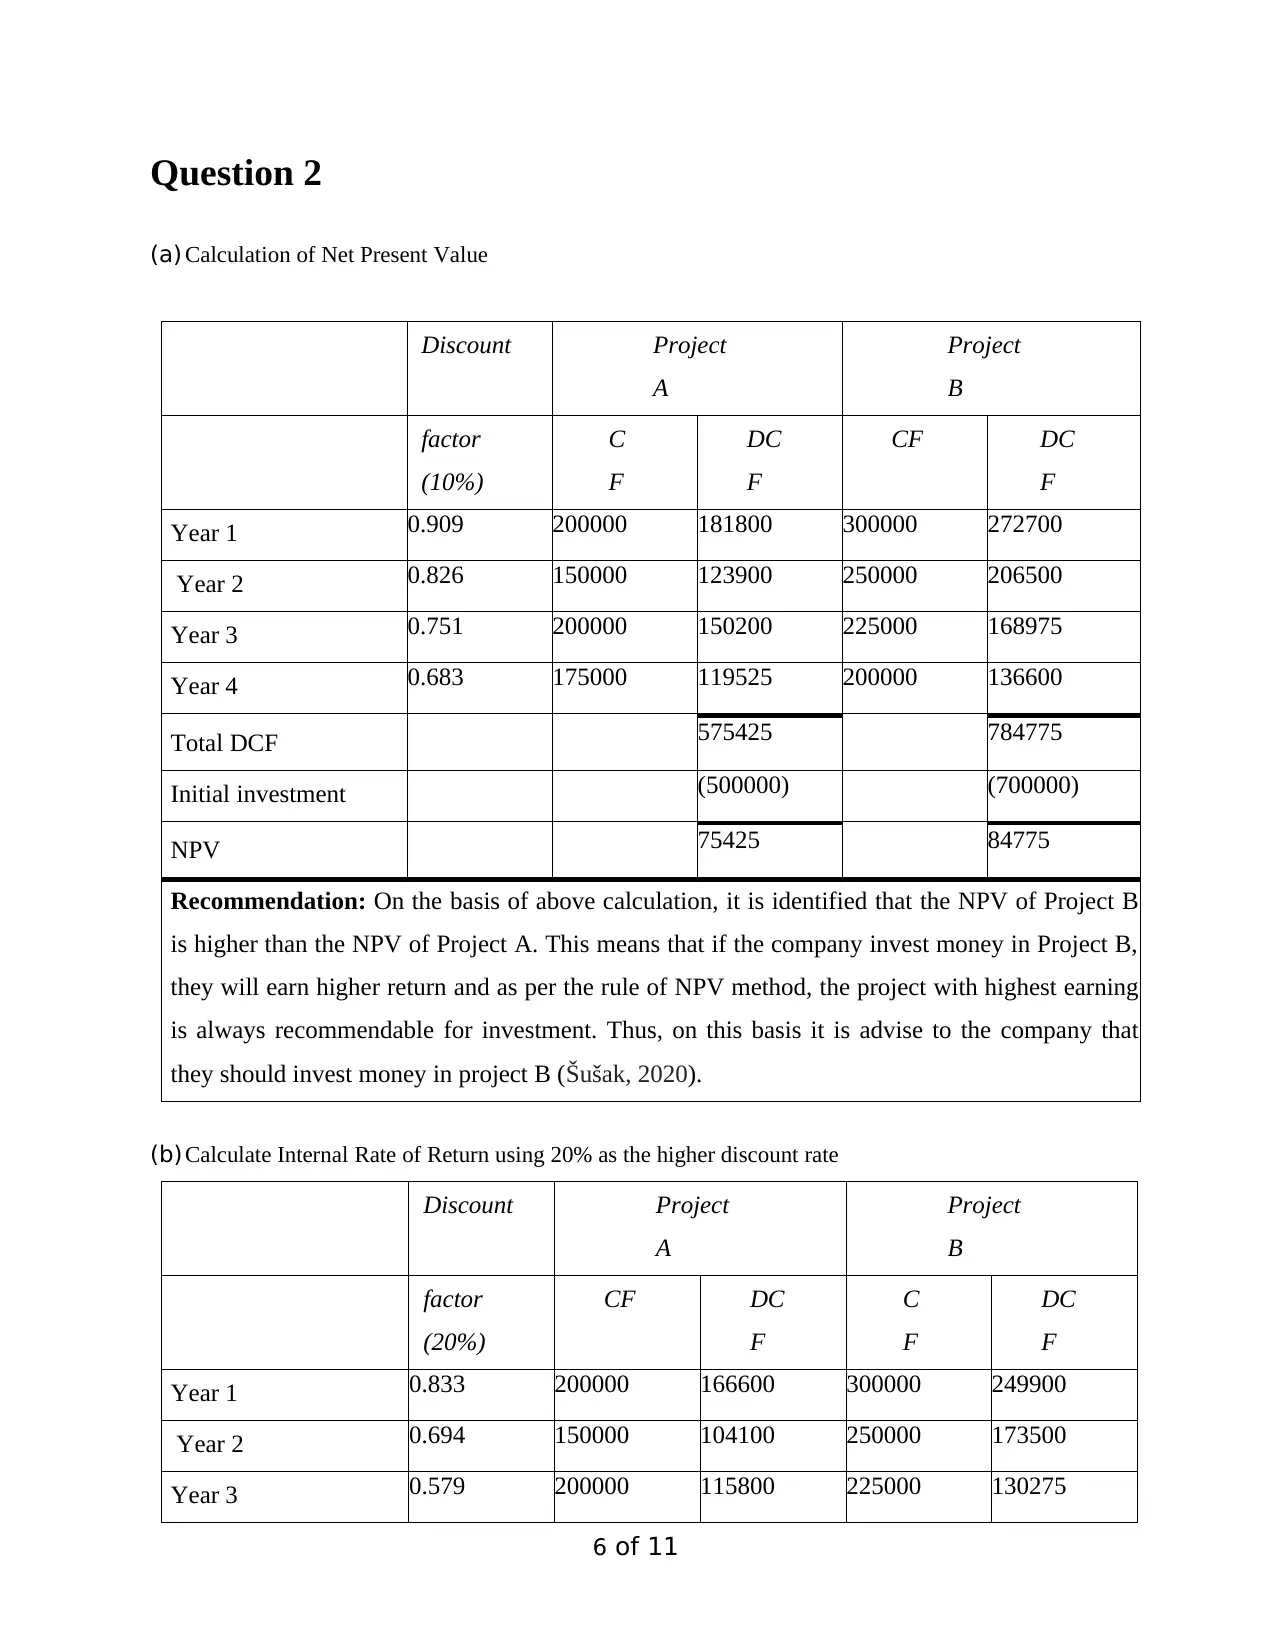
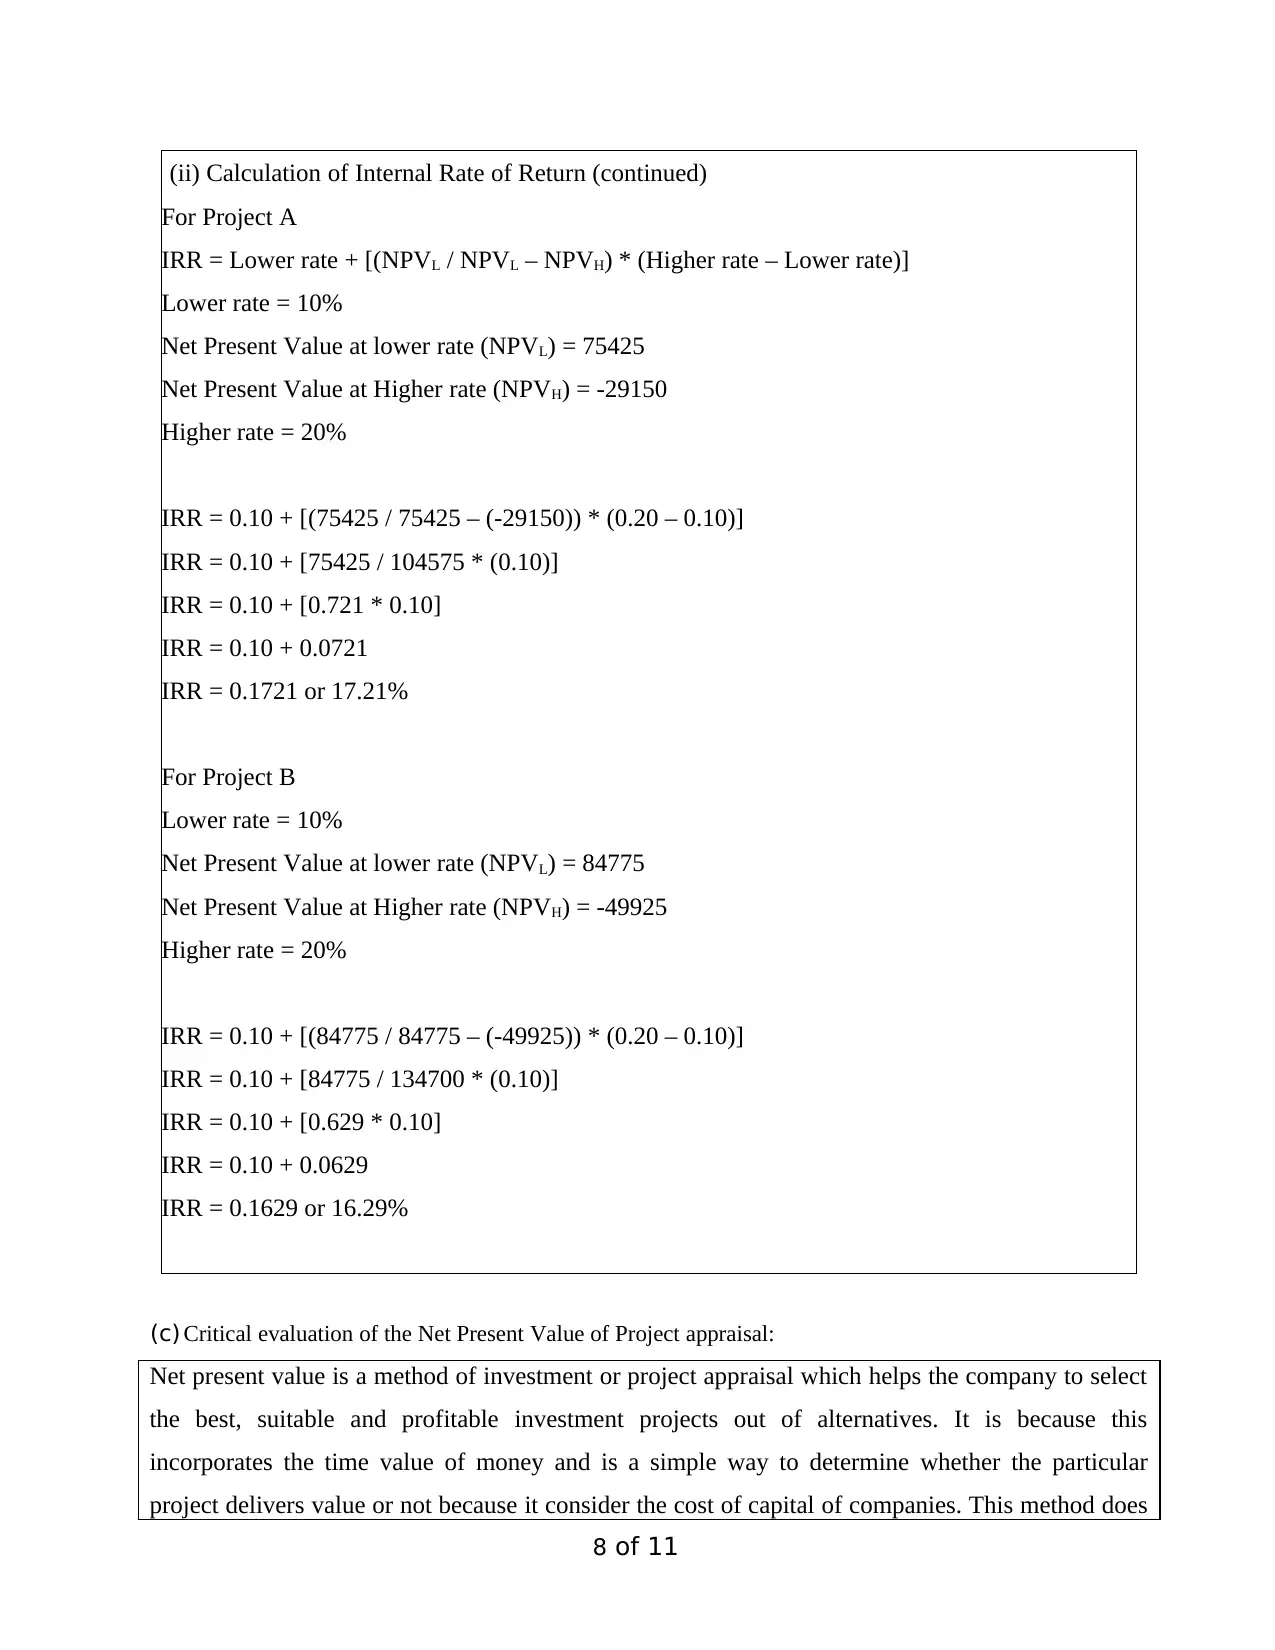
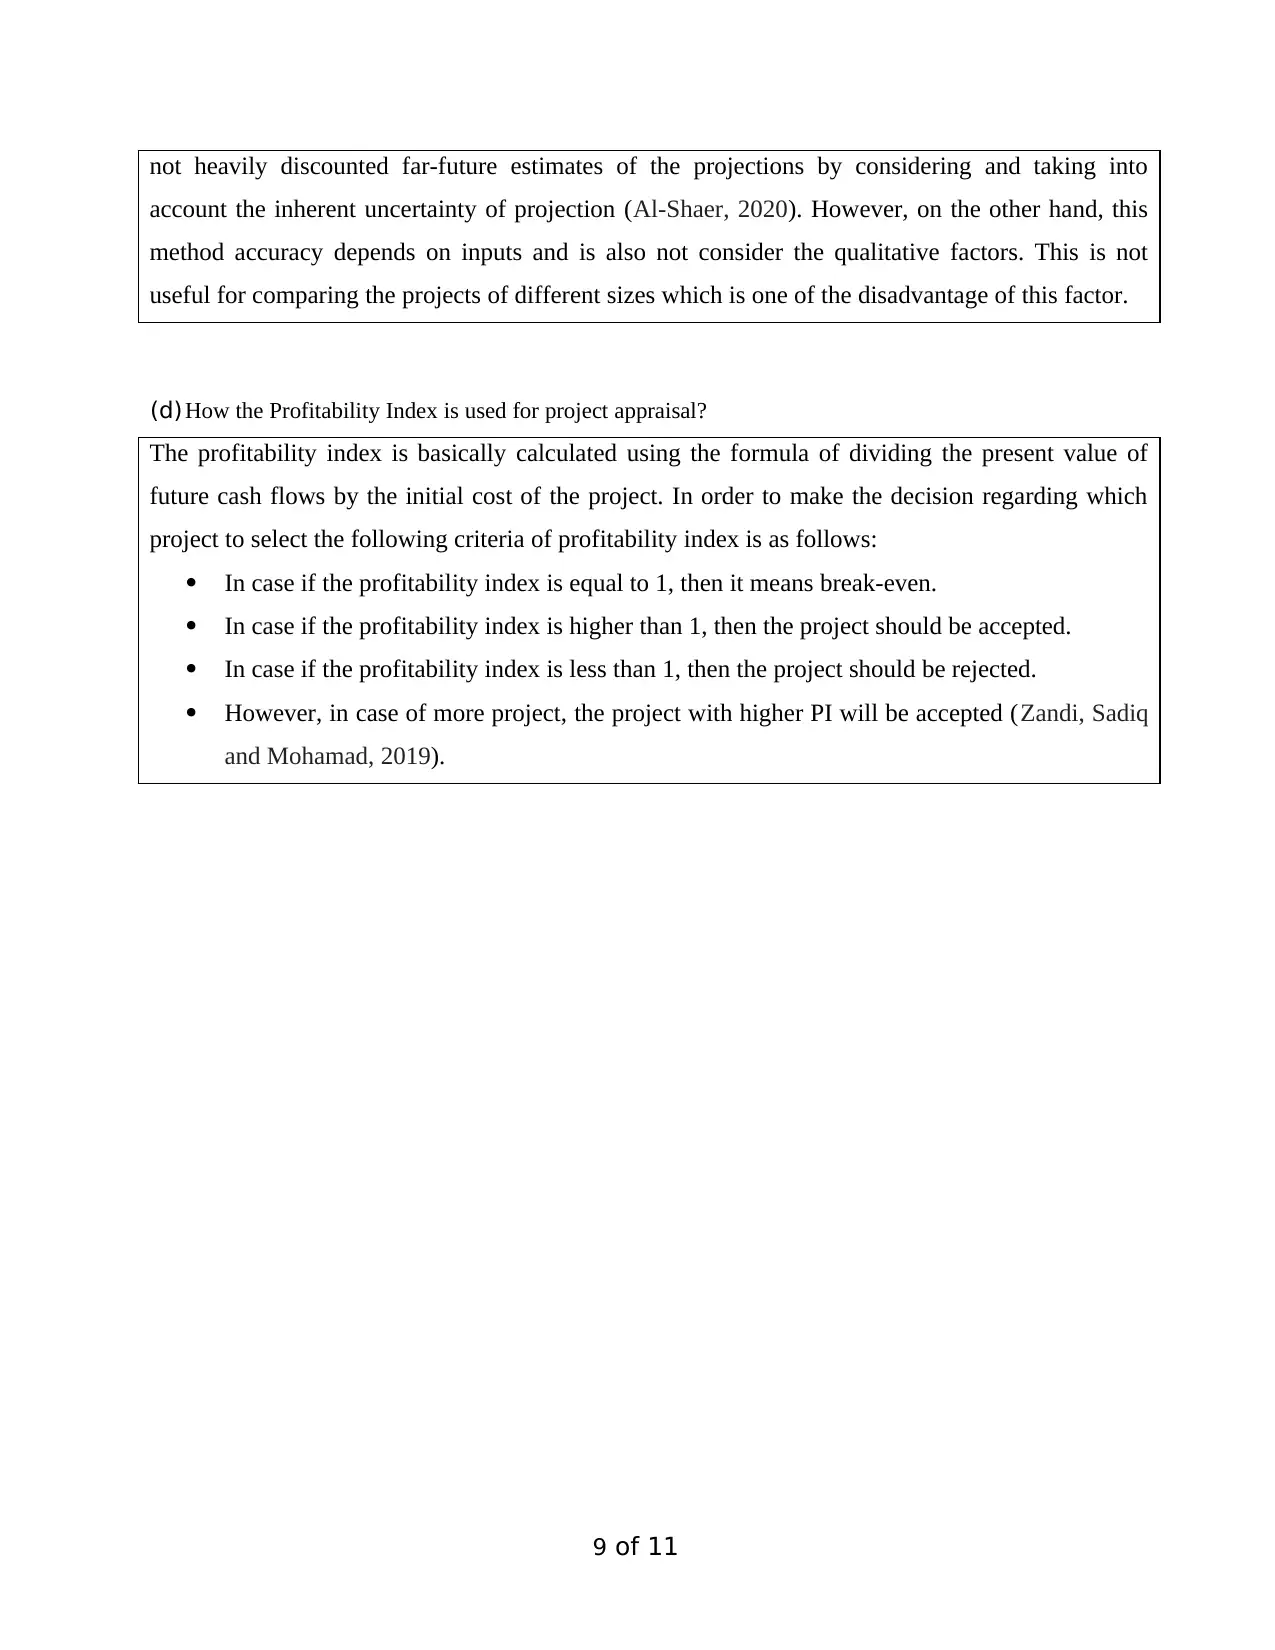
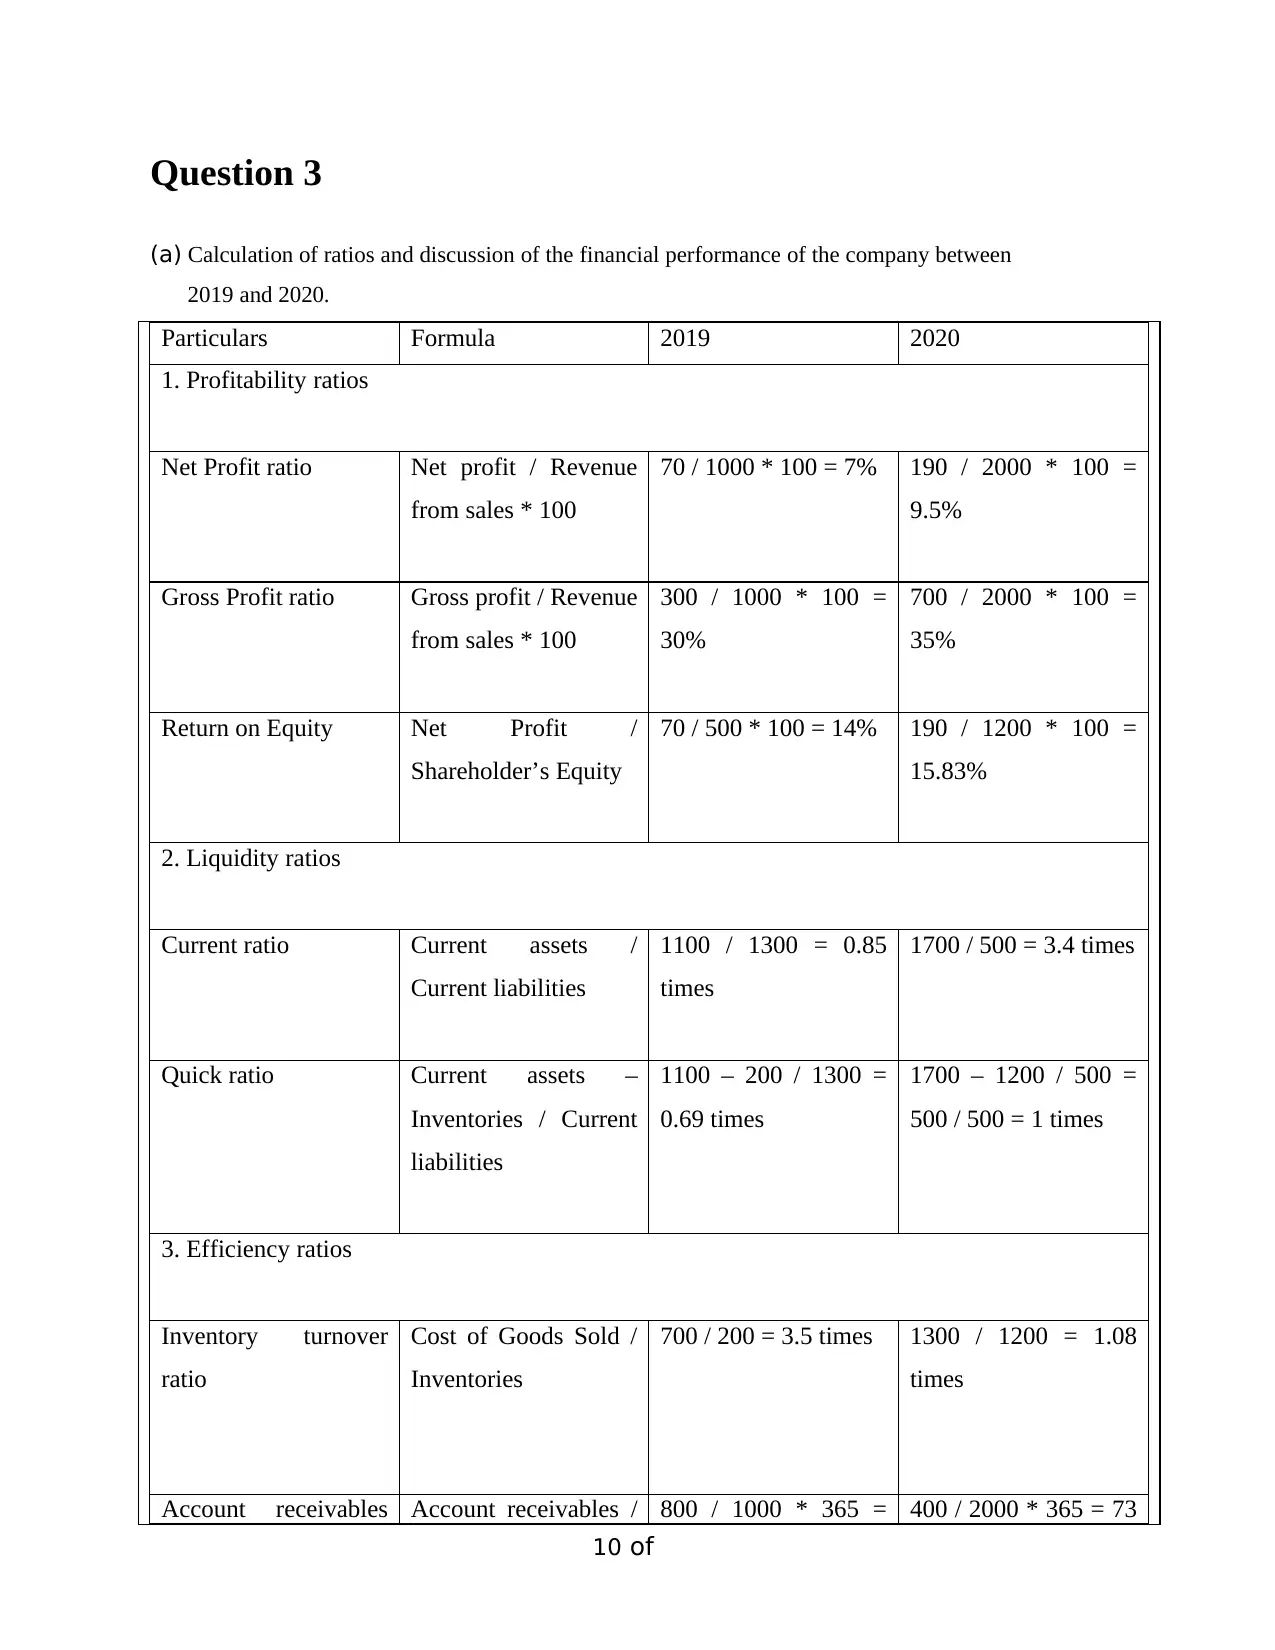
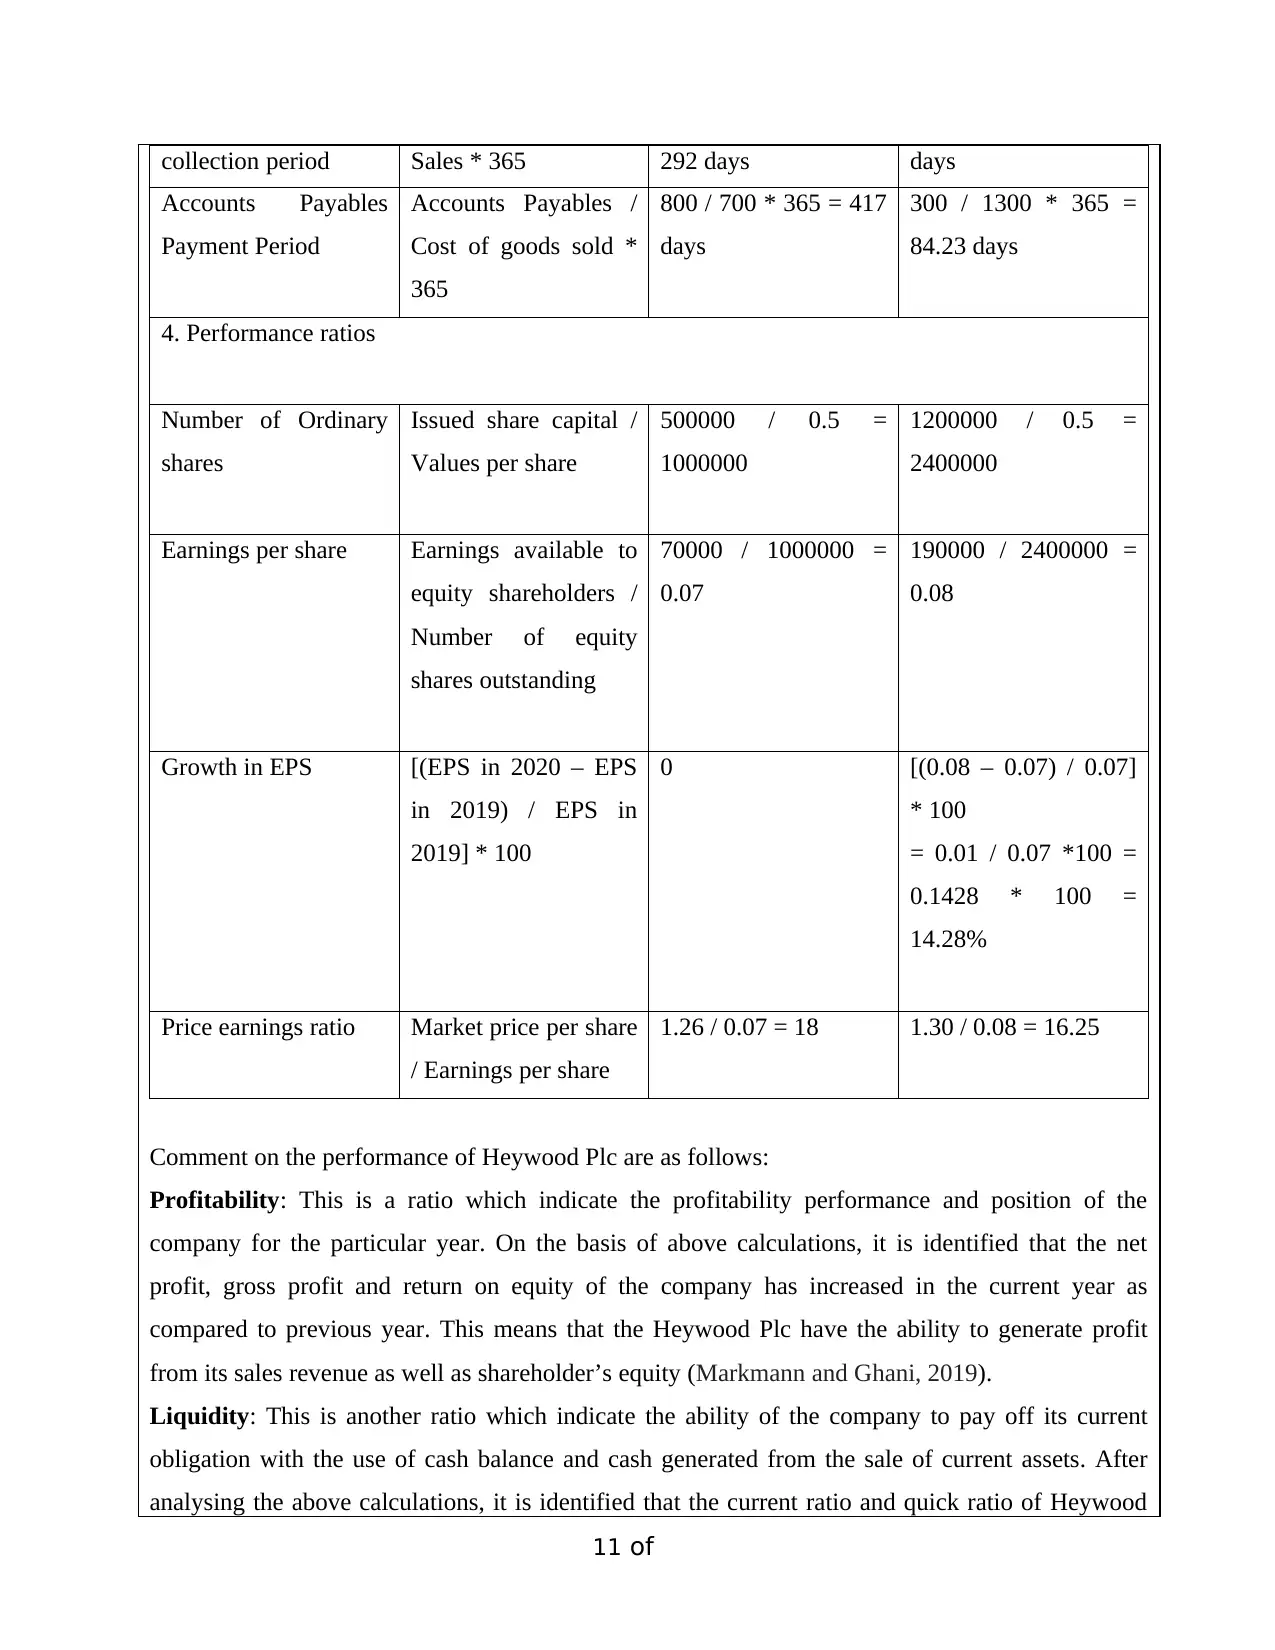
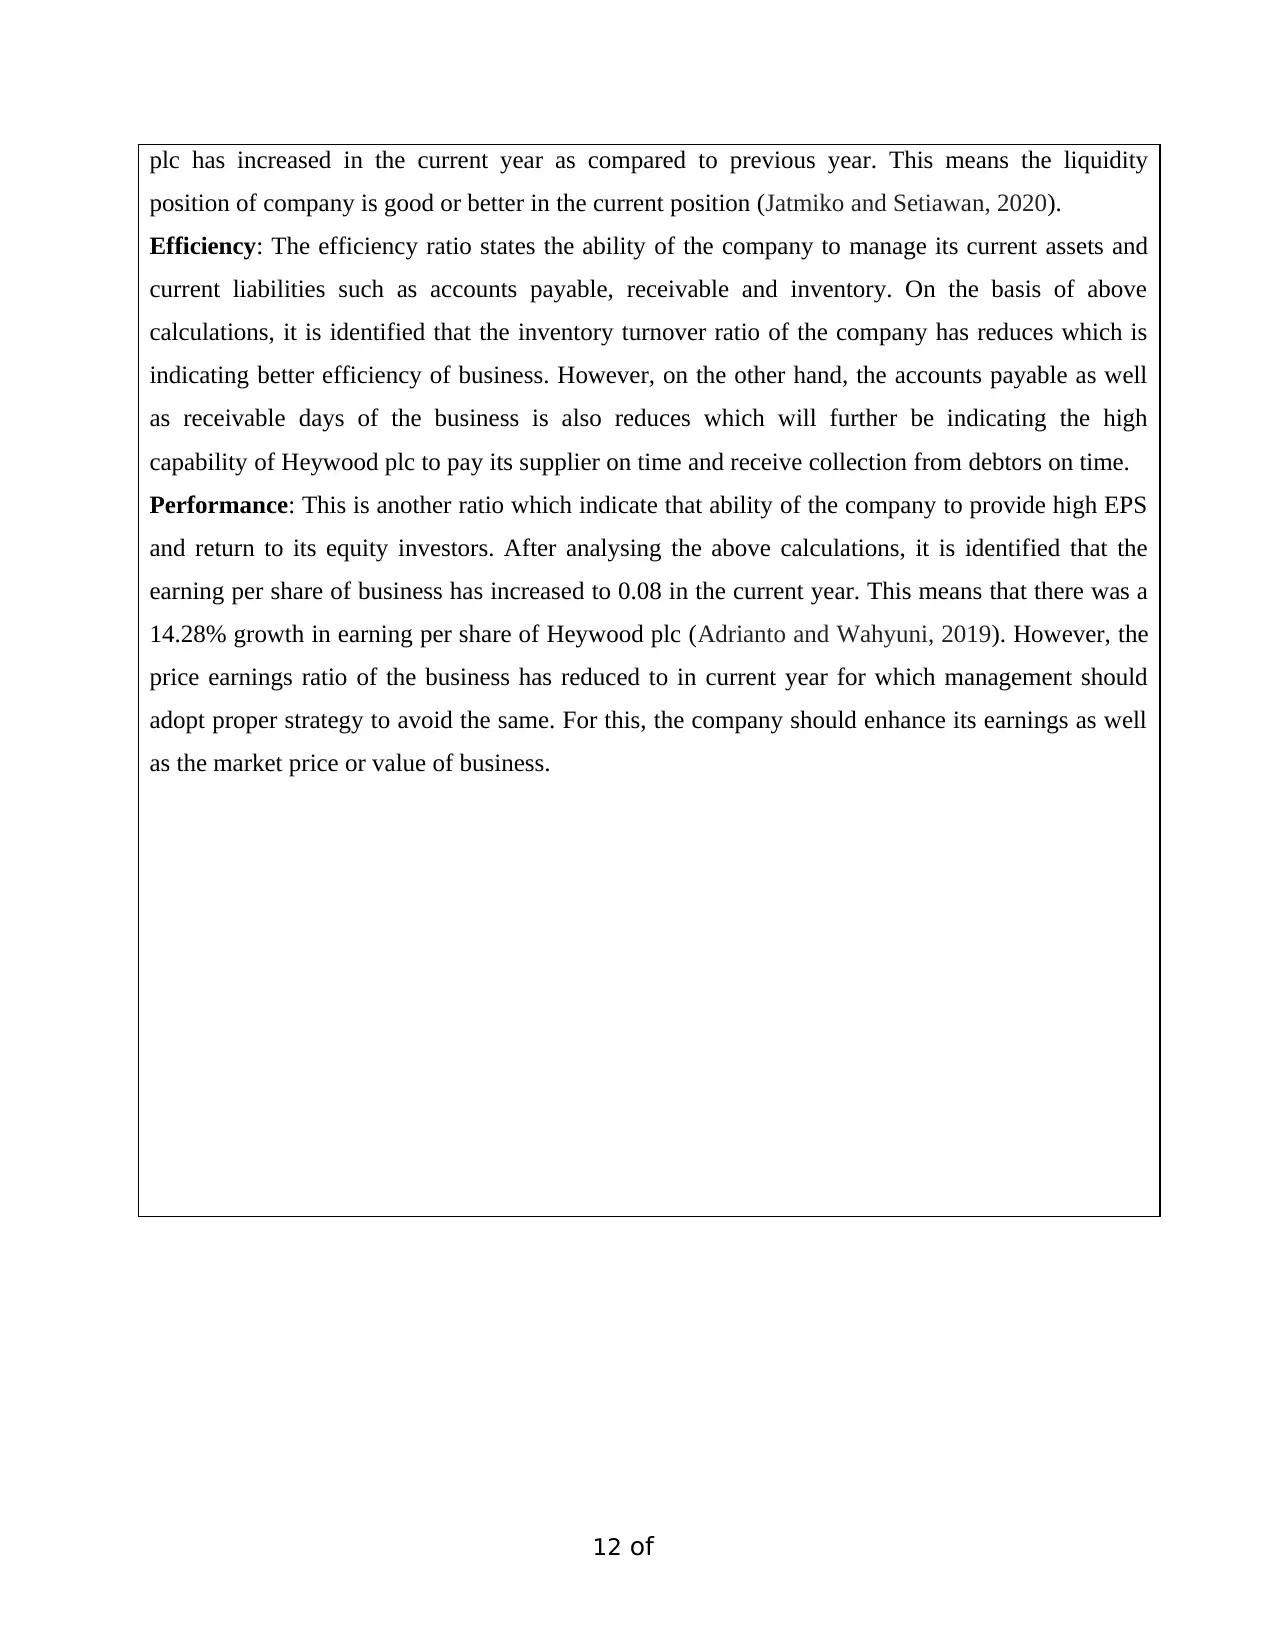
This report provides a comprehensive financial analysis of Heywood Plc, examining its performance between 2019 and 2020. The analysis includes calculations and discussions of key financial ratios such as profitability, liquidity, and efficiency ratios, along with performance metrics like earnings per share and price-earnings ratio. The report also critically evaluates Activity Based Costing (ABC) and Activity Based Management (ABM), Net Present Value (NPV), Internal Rate of Return (IRR), and the Balanced Scorecard as methods of assessing performance and making management decisions. Investment appraisal techniques are applied to Project A and Project B using NPV and IRR, and recommendations are made based on the results. The document concludes with an assessment of Heywood Plc's financial standing and recommendations for future strategies. Find more solved assignments and study resources on Desklib, your go-to platform for academic support.

1 of 11
FINANCIAL REPORTING FOR
MANAGEMENT
MODULE NO: BMP6015
==============================================================
FINANCIAL REPORTING FOR
MANAGEMENT
MODULE NO: BMP6015
==============================================================
Paraphrase This Document
Need a fresh take? Get an instant paraphrase of this document with our AI Paraphraser

2 of 11
ANSWER BOOKLET
All the pages of the answer booklet should be submitted including blank ones Please
type your answers in the spaces provided
Insert additional pages where required
ANSWER BOOKLET
All the pages of the answer booklet should be submitted including blank ones Please
type your answers in the spaces provided
Insert additional pages where required

3 of 11
Question 1
(a) Calculation of budgeted cost per unit of each product
(i) Determination of the cost driver for each activity and absorption rate:
Cost pool/activity Cost driver
Overheads Activity Absorption rate
£ units £
Stores cost Material requisitions 140000 320 140000 / 320
= 437.5
Production set up cost Production set ups 280000 280 280000 / 280
= 1000
Quality control inspection Quality control inspections 180000 90 180000 / 90
= 2000
(ii) Calculation of budgeted cost per unit for each product:
Micro Delta
Units
Price/
cost (£)
£
Units
Price/
cost
(£)
£
Direct material 60000 2.60 156000 25000 3.90 97500
Direct labor 60000 3.5 210000 25000 2.70 67500
Store costs 100 437.5 43750 220 437.5 96250
Production set up costs 80 1000 80000 200 1000 200000
Quality control
inspection
30 2000 60000 60 2000 120000
549750 581250
Units produced 60000 25000
Cost per unit 9.16 23.25
⊘ This is a preview!⊘
Do you want full access?
Subscribe today to unlock all pages.

Trusted by 1+ million students worldwide

4 of 11
(b) Critical evaluation of ABC as a costing method:
Activity based costing is one of the best costing method with the help of which the company can
able to identify the realistic cost of manufacturing for specific products. With the help adoption of
this costing method, the company able to allocate manufacturing overheads more accurately to
products and process that use in the particular activity. It is because in this method, the
management of the company need to allocate the overhead cost to activity based on the cost
drivers. The impact of which, the company able to determines the product profit margin more
precisely. It is also best for identifying the processes which have unnecessary and wasted costs.
However, on the other hand, the disadvantage of this costing method is such that collection and
preparation of data under ABC is quite time-consuming (Manes-Rossi, Nicolò and Argento, 2020).
The result of which managers sometime get distracted from its goals which might leads to heavy
financial goals. By the way, this method is not appropriate for the companies where the proportion
of overhead cost is small as compared to total operating costs.
Paraphrase This Document
Need a fresh take? Get an instant paraphrase of this document with our AI Paraphraser

5 of 11
(c) How Activity Based Management could assist better management decision making and control:
The activity based management with the use of ABC costing method can easily assist better
management decision making and control because ABC is used for strategic decision-making. With
the help of this method, the company can assess the costs that associated with the specific activity
or department of the organization. Further, this helps in linking those costs to specific customers
i.e., both internal and external customer in order to determine the cost associated with each activity,
process and customer (Turzo and et.al., 2022). The ultimate impact of which management of
company able to identify the activity and process which are causing loss to the organization in
order to shut down or stop that particular activity and processes.

6 of 11
Question 2
(a) Calculation of Net Present Value
Discount Project
A
Project
B
factor
(10%)
C
F
DC
F
CF DC
F
Year 1 0.909 200000 181800 300000 272700
Year 2 0.826 150000 123900 250000 206500
Year 3 0.751 200000 150200 225000 168975
Year 4 0.683 175000 119525 200000 136600
Total DCF 575425 784775
Initial investment (500000) (700000)
NPV 75425 84775
Recommendation: On the basis of above calculation, it is identified that the NPV of Project B
is higher than the NPV of Project A. This means that if the company invest money in Project B,
they will earn higher return and as per the rule of NPV method, the project with highest earning
is always recommendable for investment. Thus, on this basis it is advise to the company that
they should invest money in project B (Šušak, 2020).
(b) Calculate Internal Rate of Return using 20% as the higher discount rate
Discount Project
A
Project
B
factor
(20%)
CF DC
F
C
F
DC
F
Year 1 0.833 200000 166600 300000 249900
Year 2 0.694 150000 104100 250000 173500
Year 3 0.579 200000 115800 225000 130275
⊘ This is a preview!⊘
Do you want full access?
Subscribe today to unlock all pages.

Trusted by 1+ million students worldwide

7 of 11
Year 4 0.482 175000 84350 200000 96400
Total DCF 470850 650075
Initial investment (500000) (700000)
NPV (29150) (49925)
Year 4 0.482 175000 84350 200000 96400
Total DCF 470850 650075
Initial investment (500000) (700000)
NPV (29150) (49925)
Paraphrase This Document
Need a fresh take? Get an instant paraphrase of this document with our AI Paraphraser

8 of 11
(c) Critical evaluation of the Net Present Value of Project appraisal:
Net present value is a method of investment or project appraisal which helps the company to select
the best, suitable and profitable investment projects out of alternatives. It is because this
incorporates the time value of money and is a simple way to determine whether the particular
project delivers value or not because it consider the cost of capital of companies. This method does
(ii) Calculation of Internal Rate of Return (continued)
For Project A
IRR = Lower rate + [(NPVL / NPVL – NPVH) * (Higher rate – Lower rate)]
Lower rate = 10%
Net Present Value at lower rate (NPVL) = 75425
Net Present Value at Higher rate (NPVH) = -29150
Higher rate = 20%
IRR = 0.10 + [(75425 / 75425 – (-29150)) * (0.20 – 0.10)]
IRR = 0.10 + [75425 / 104575 * (0.10)]
IRR = 0.10 + [0.721 * 0.10]
IRR = 0.10 + 0.0721
IRR = 0.1721 or 17.21%
For Project B
Lower rate = 10%
Net Present Value at lower rate (NPVL) = 84775
Net Present Value at Higher rate (NPVH) = -49925
Higher rate = 20%
IRR = 0.10 + [(84775 / 84775 – (-49925)) * (0.20 – 0.10)]
IRR = 0.10 + [84775 / 134700 * (0.10)]
IRR = 0.10 + [0.629 * 0.10]
IRR = 0.10 + 0.0629
IRR = 0.1629 or 16.29%

9 of 11
not heavily discounted far-future estimates of the projections by considering and taking into
account the inherent uncertainty of projection (Al‐Shaer, 2020). However, on the other hand, this
method accuracy depends on inputs and is also not consider the qualitative factors. This is not
useful for comparing the projects of different sizes which is one of the disadvantage of this factor.
(d) How the Profitability Index is used for project appraisal?
The profitability index is basically calculated using the formula of dividing the present value of
future cash flows by the initial cost of the project. In order to make the decision regarding which
project to select the following criteria of profitability index is as follows:
In case if the profitability index is equal to 1, then it means break-even.
In case if the profitability index is higher than 1, then the project should be accepted.
In case if the profitability index is less than 1, then the project should be rejected.
However, in case of more project, the project with higher PI will be accepted (Zandi, Sadiq
and Mohamad, 2019).
⊘ This is a preview!⊘
Do you want full access?
Subscribe today to unlock all pages.

Trusted by 1+ million students worldwide

10 of
11
Question 3
(a) Calculation of ratios and discussion of the financial performance of the company between
2019 and 2020.
Particulars Formula 2019 2020
1. Profitability ratios
Net Profit ratio Net profit / Revenue
from sales * 100
70 / 1000 * 100 = 7% 190 / 2000 * 100 =
9.5%
Gross Profit ratio Gross profit / Revenue
from sales * 100
300 / 1000 * 100 =
30%
700 / 2000 * 100 =
35%
Return on Equity Net Profit /
Shareholder’s Equity
70 / 500 * 100 = 14% 190 / 1200 * 100 =
15.83%
2. Liquidity ratios
Current ratio Current assets /
Current liabilities
1100 / 1300 = 0.85
times
1700 / 500 = 3.4 times
Quick ratio Current assets –
Inventories / Current
liabilities
1100 – 200 / 1300 =
0.69 times
1700 – 1200 / 500 =
500 / 500 = 1 times
3. Efficiency ratios
Inventory turnover
ratio
Cost of Goods Sold /
Inventories
700 / 200 = 3.5 times 1300 / 1200 = 1.08
times
Account receivables Account receivables / 800 / 1000 * 365 = 400 / 2000 * 365 = 73
Paraphrase This Document
Need a fresh take? Get an instant paraphrase of this document with our AI Paraphraser

11 of
11
collection period Sales * 365 292 days days
Accounts Payables
Payment Period
Accounts Payables /
Cost of goods sold *
365
800 / 700 * 365 = 417
days
300 / 1300 * 365 =
84.23 days
4. Performance ratios
Number of Ordinary
shares
Issued share capital /
Values per share
500000 / 0.5 =
1000000
1200000 / 0.5 =
2400000
Earnings per share Earnings available to
equity shareholders /
Number of equity
shares outstanding
70000 / 1000000 =
0.07
190000 / 2400000 =
0.08
Growth in EPS [(EPS in 2020 – EPS
in 2019) / EPS in
2019] * 100
0 [(0.08 – 0.07) / 0.07]
* 100
= 0.01 / 0.07 *100 =
0.1428 * 100 =
14.28%
Price earnings ratio Market price per share
/ Earnings per share
1.26 / 0.07 = 18 1.30 / 0.08 = 16.25
Comment on the performance of Heywood Plc are as follows:
Profitability: This is a ratio which indicate the profitability performance and position of the
company for the particular year. On the basis of above calculations, it is identified that the net
profit, gross profit and return on equity of the company has increased in the current year as
compared to previous year. This means that the Heywood Plc have the ability to generate profit
from its sales revenue as well as shareholder’s equity (Markmann and Ghani, 2019).
Liquidity: This is another ratio which indicate the ability of the company to pay off its current
obligation with the use of cash balance and cash generated from the sale of current assets. After
analysing the above calculations, it is identified that the current ratio and quick ratio of Heywood

12 of
11
plc has increased in the current year as compared to previous year. This means the liquidity
position of company is good or better in the current position (Jatmiko and Setiawan, 2020).
Efficiency: The efficiency ratio states the ability of the company to manage its current assets and
current liabilities such as accounts payable, receivable and inventory. On the basis of above
calculations, it is identified that the inventory turnover ratio of the company has reduces which is
indicating better efficiency of business. However, on the other hand, the accounts payable as well
as receivable days of the business is also reduces which will further be indicating the high
capability of Heywood plc to pay its supplier on time and receive collection from debtors on time.
Performance: This is another ratio which indicate that ability of the company to provide high EPS
and return to its equity investors. After analysing the above calculations, it is identified that the
earning per share of business has increased to 0.08 in the current year. This means that there was a
14.28% growth in earning per share of Heywood plc (Adrianto and Wahyuni, 2019). However, the
price earnings ratio of the business has reduced to in current year for which management should
adopt proper strategy to avoid the same. For this, the company should enhance its earnings as well
as the market price or value of business.
⊘ This is a preview!⊘
Do you want full access?
Subscribe today to unlock all pages.

Trusted by 1+ million students worldwide
1 out of 18
Related Documents
Your All-in-One AI-Powered Toolkit for Academic Success.
+13062052269
info@desklib.com
Available 24*7 on WhatsApp / Email
Unlock your academic potential
Copyright © 2020–2026 A2Z Services. All Rights Reserved. Developed and managed by ZUCOL.


