Financial Performance Evaluation of Woolworths Group Limited Report

Verified

Added on  2021/10/06

|6
|787
|149
Report
AI Summary
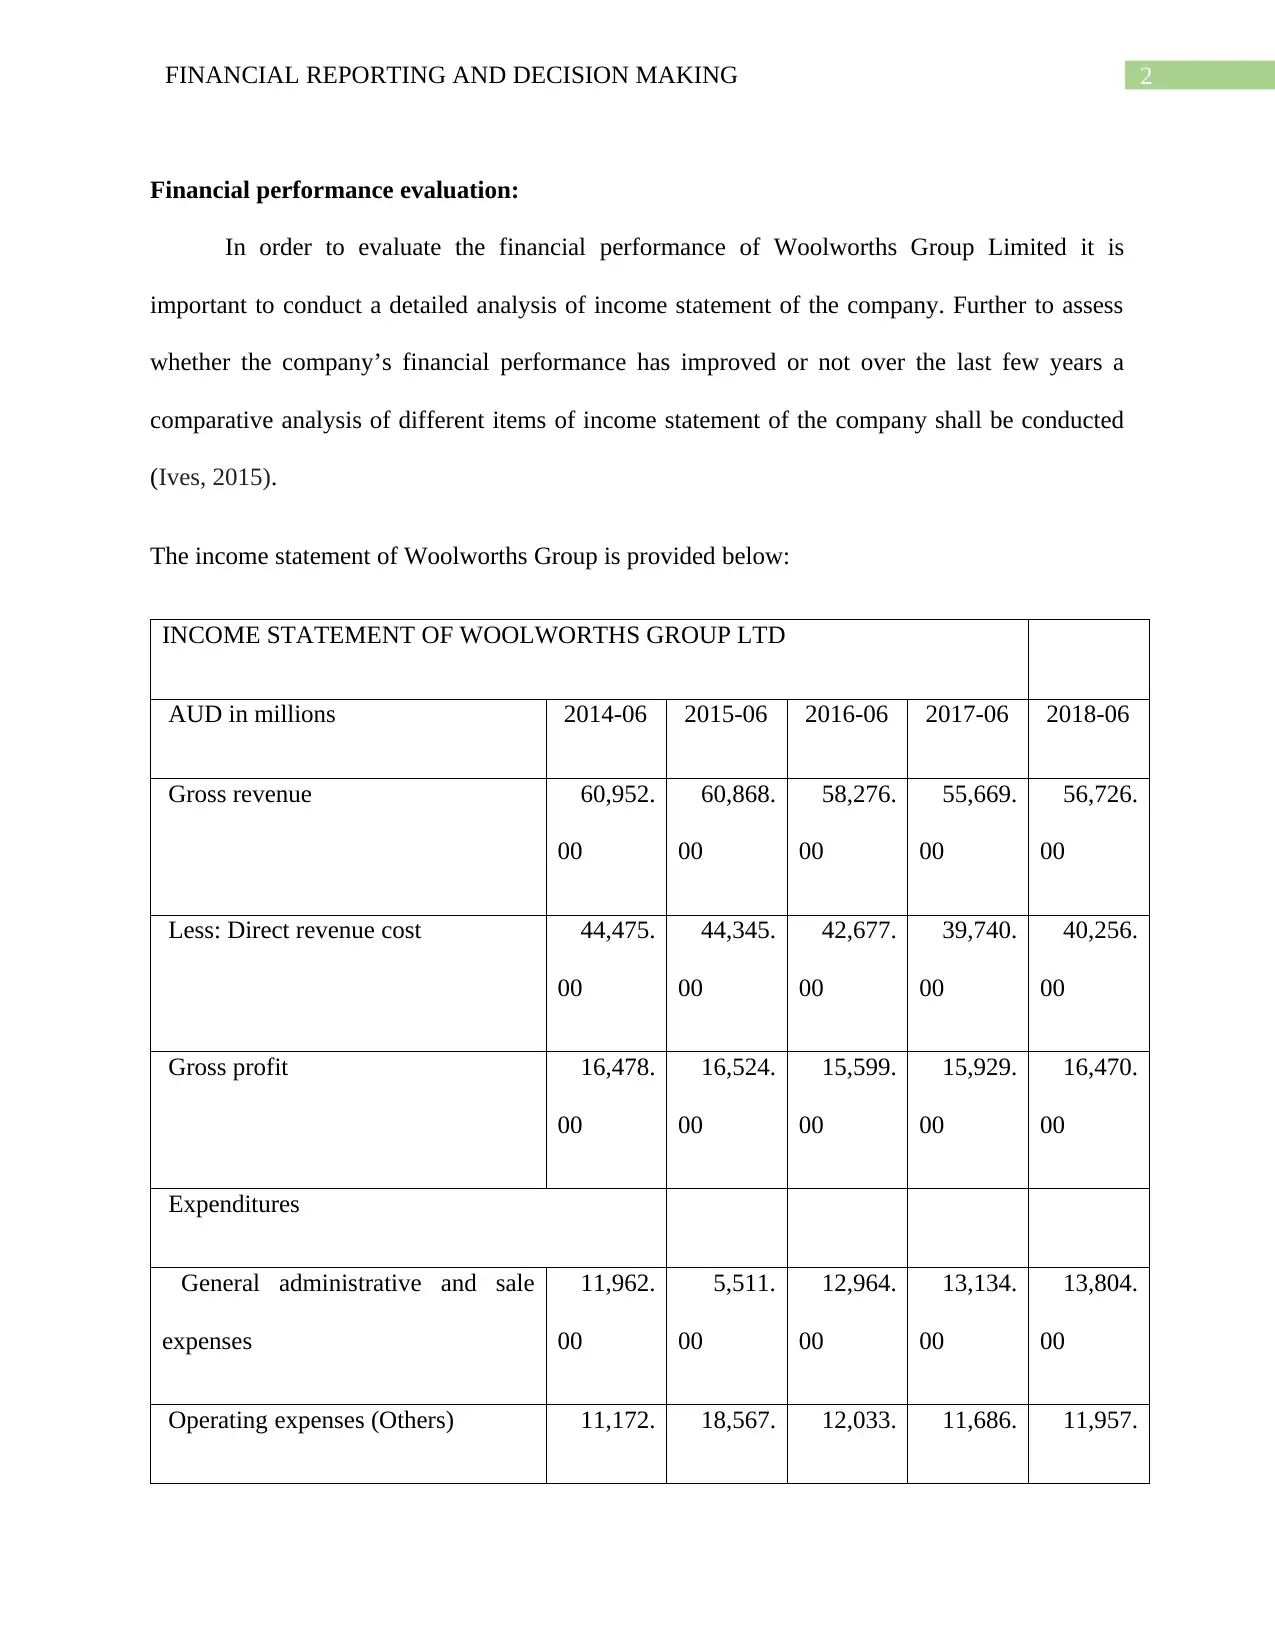
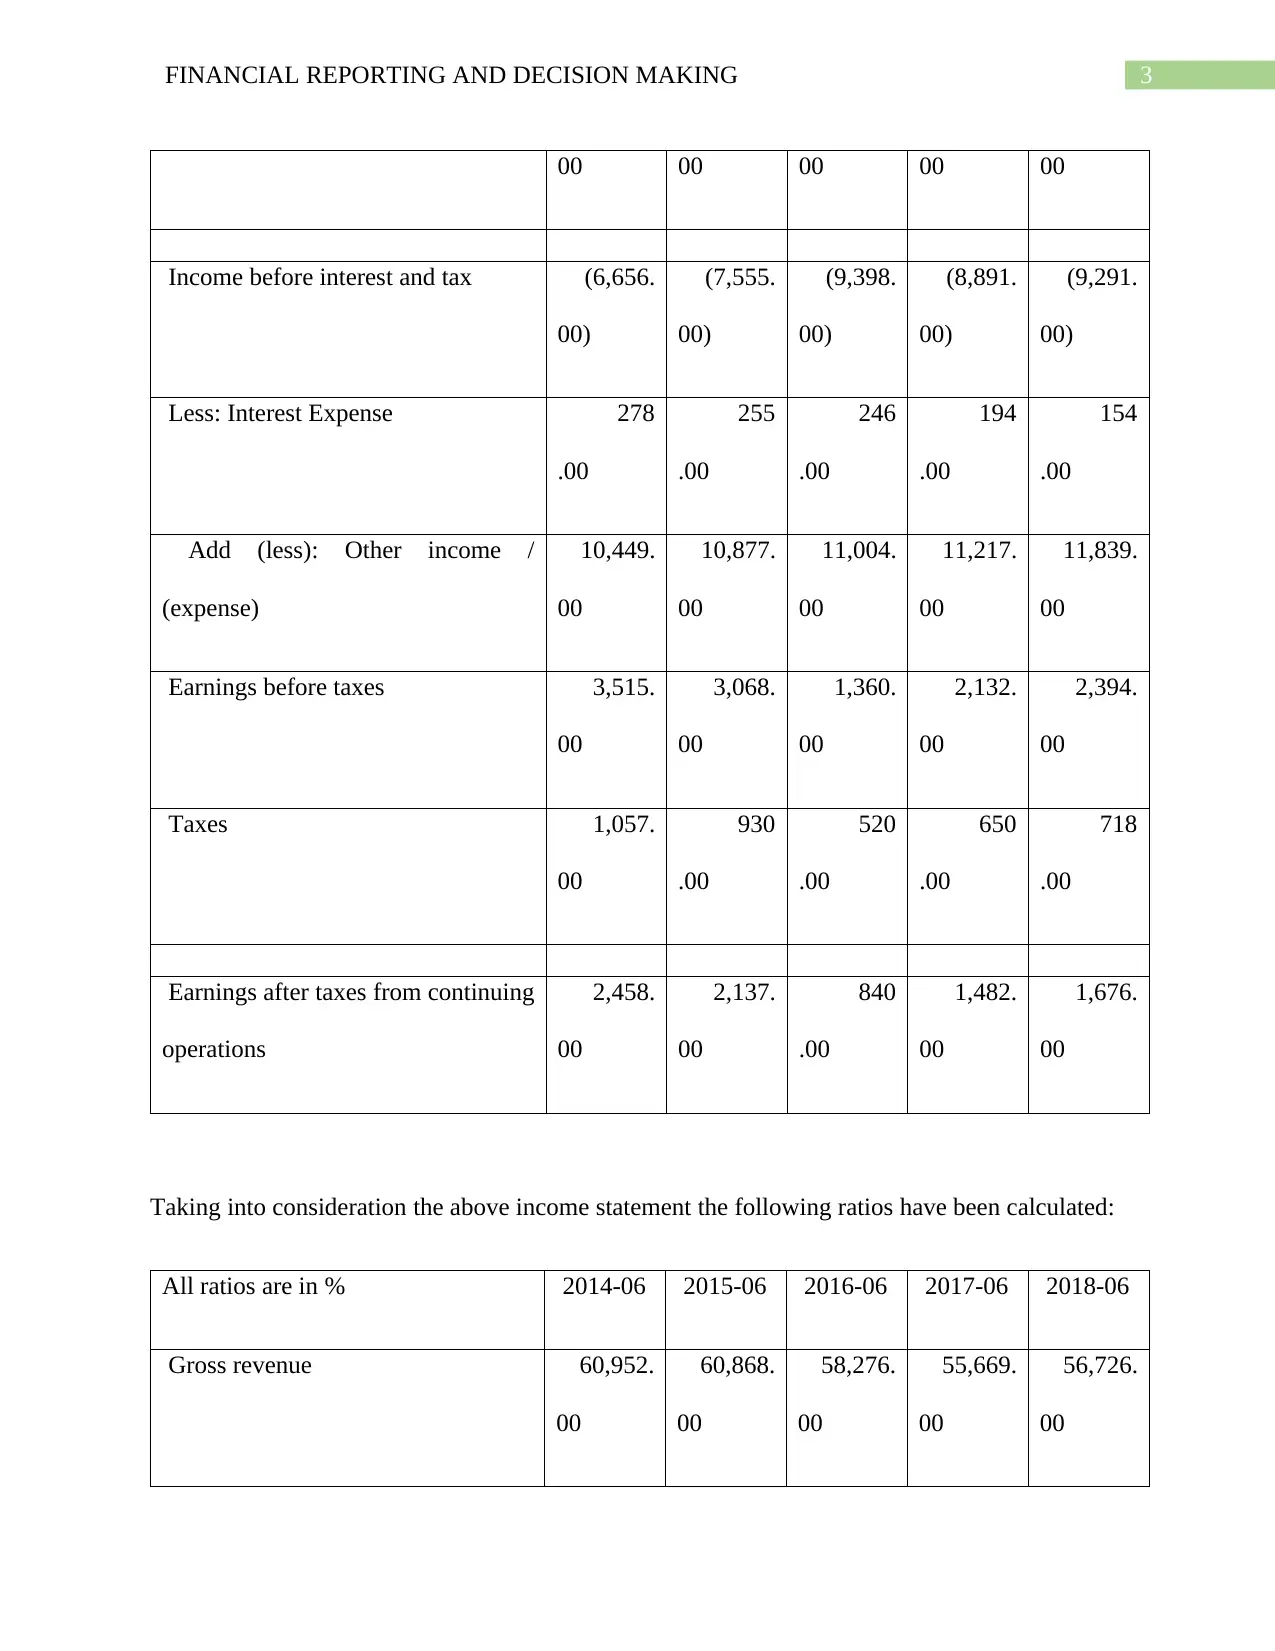
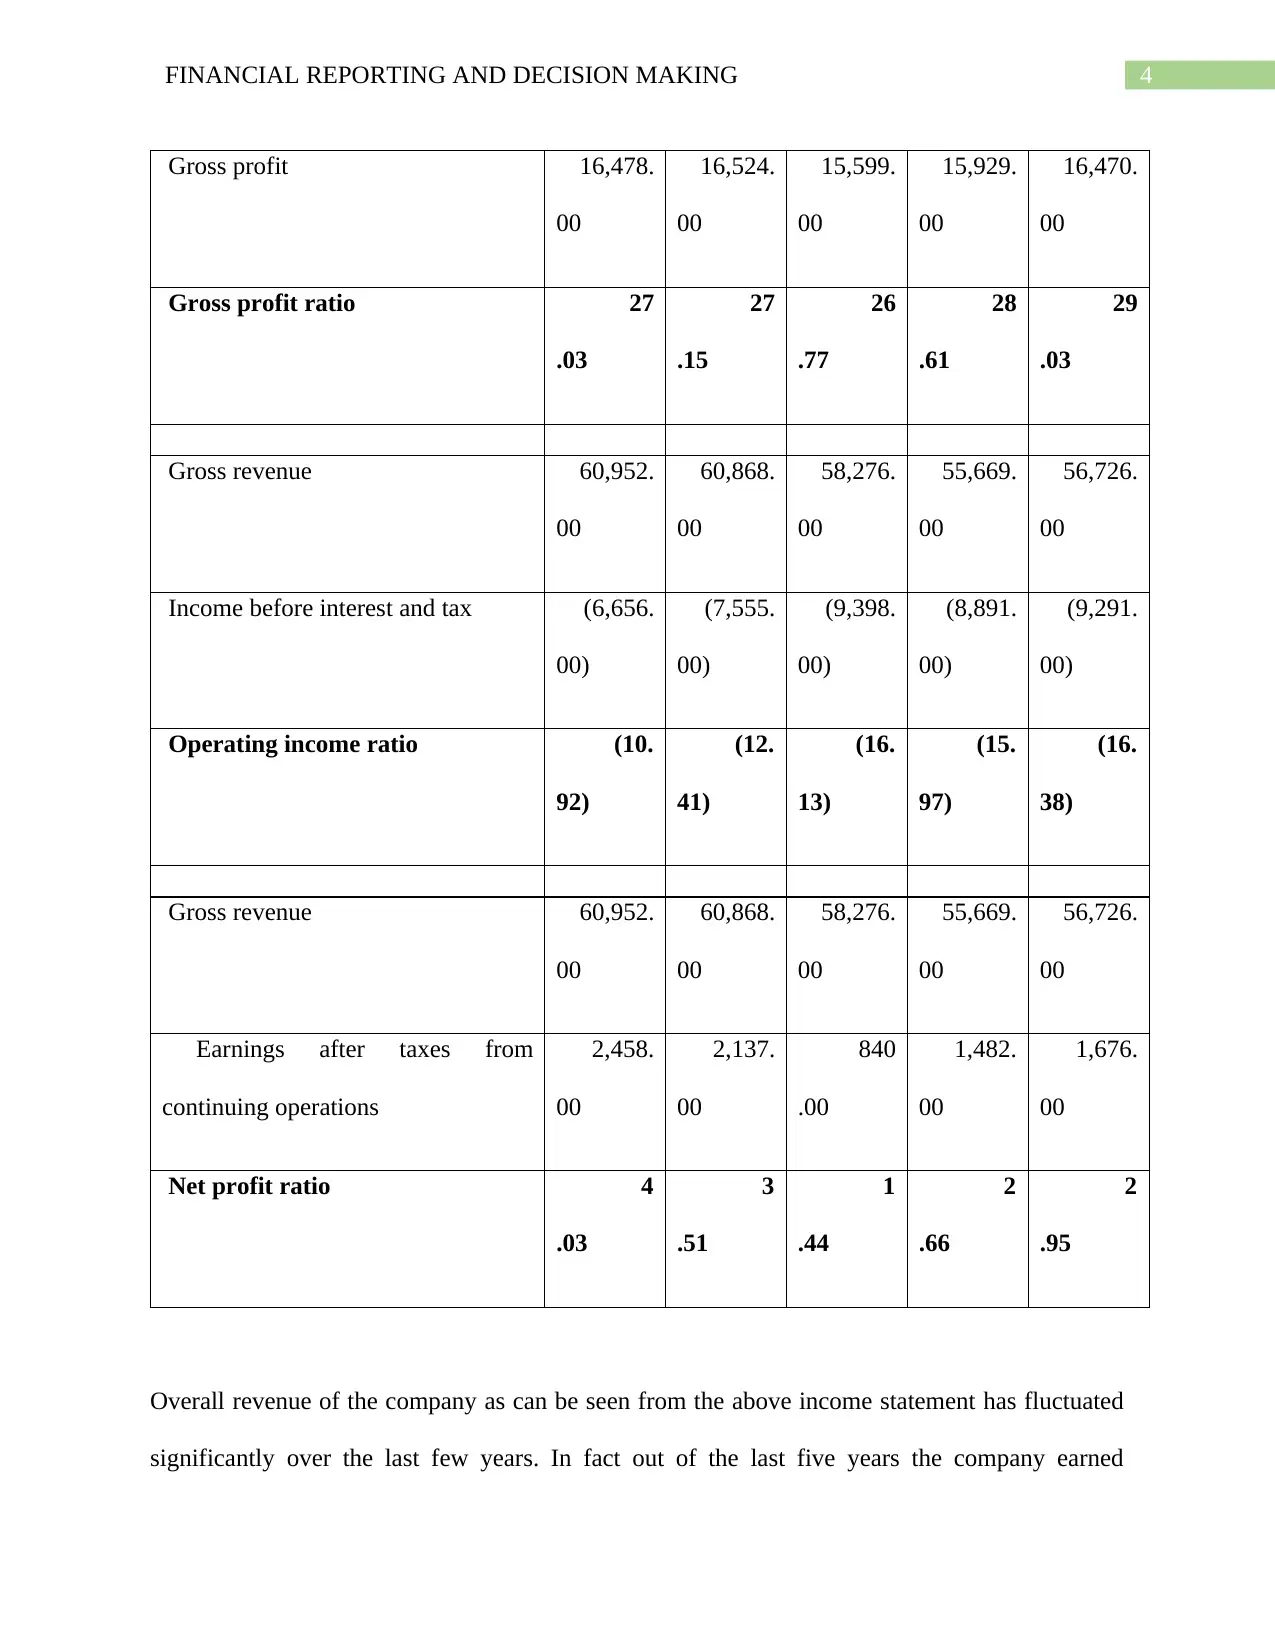
This report provides a comprehensive financial performance evaluation of Woolworths Group Limited, analyzing its income statements from 2014 to 2018. The analysis includes calculations of key financial ratios such as gross profit ratio, operating income ratio, and net profit ratio to assess the company's financial health. The report observes fluctuations in revenue, with a decrease over the observed period, while the gross profit ratio shows improvement. However, operating income and net income have declined, indicating potential challenges in managing operating expenditures. The analysis concludes that the company's overall financial performance has deteriorated, emphasizing the need for strategic adjustments to improve profitability and operational efficiency. The report references several academic sources to support its findings.
Document Page
Running head: FINANCIAL REPORTING AND DECISION MAKING
Financial Reporting and Decision Making
Name of the Student:
Name of the University:
Authors Note:
tabler-icon-diamond-filled.svg

Secure Best Marks with AI Grader

Need help grading? Try our AI Grader for instant feedback on your assignments.
Document Page
1FINANCIAL REPORTING AND DECISION MAKING
Contents
Financial performance evaluation:..................................................................................................2
Observation:.....................................................................................................................................5
References:......................................................................................................................................6
Document Page
2FINANCIAL REPORTING AND DECISION MAKING
Financial performance evaluation:
In order to evaluate the financial performance of Woolworths Group Limited it is
important to conduct a detailed analysis of income statement of the company. Further to assess
whether the company’s financial performance has improved or not over the last few years a
comparative analysis of different items of income statement of the company shall be conducted
(Ives, 2015).
The income statement of Woolworths Group is provided below:
INCOME STATEMENT OF WOOLWORTHS GROUP LTD
AUD in millions 2014-06 2015-06 2016-06 2017-06 2018-06
Gross revenue 60,952.
00
60,868.
00
58,276.
00
55,669.
00
56,726.
00
Less: Direct revenue cost 44,475.
00
44,345.
00
42,677.
00
39,740.
00
40,256.
00
Gross profit 16,478.
00
16,524.
00
15,599.
00
15,929.
00
16,470.
00
Expenditures
General administrative and sale
expenses
11,962.
00
5,511.
00
12,964.
00
13,134.
00
13,804.
00
Operating expenses (Others) 11,172. 18,567. 12,033. 11,686. 11,957.
Document Page
3FINANCIAL REPORTING AND DECISION MAKING
00 00 00 00 00
Income before interest and tax (6,656.
00)
(7,555.
00)
(9,398.
00)
(8,891.
00)
(9,291.
00)
Less: Interest Expense 278
.00
255
.00
246
.00
194
.00
154
.00
Add (less): Other income /
(expense)
10,449.
00
10,877.
00
11,004.
00
11,217.
00
11,839.
00
Earnings before taxes 3,515.
00
3,068.
00
1,360.
00
2,132.
00
2,394.
00
Taxes 1,057.
00
930
.00
520
.00
650
.00
718
.00
Earnings after taxes from continuing
operations
2,458.
00
2,137.
00
840
.00
1,482.
00
1,676.
00
Taking into consideration the above income statement the following ratios have been calculated:
All ratios are in % 2014-06 2015-06 2016-06 2017-06 2018-06
Gross revenue 60,952.
00
60,868.
00
58,276.
00
55,669.
00
56,726.
00
tabler-icon-diamond-filled.svg

Secure Best Marks with AI Grader

Need help grading? Try our AI Grader for instant feedback on your assignments.
Document Page
4FINANCIAL REPORTING AND DECISION MAKING
Gross profit 16,478.
00
16,524.
00
15,599.
00
15,929.
00
16,470.
00
Gross profit ratio 27
.03
27
.15
26
.77
28
.61
29
.03
Gross revenue 60,952.
00
60,868.
00
58,276.
00
55,669.
00
56,726.
00
Income before interest and tax (6,656.
00)
(7,555.
00)
(9,398.
00)
(8,891.
00)
(9,291.
00)
Operating income ratio (10.
92)
(12.
41)
(16.
13)
(15.
97)
(16.
38)
Gross revenue 60,952.
00
60,868.
00
58,276.
00
55,669.
00
56,726.
00
Earnings after taxes from
continuing operations
2,458.
00
2,137.
00
840
.00
1,482.
00
1,676.
00
Net profit ratio 4
.03
3
.51
1
.44
2
.66
2
.95
Overall revenue of the company as can be seen from the above income statement has fluctuated
significantly over the last few years. In fact out of the last five years the company earned
Document Page
5FINANCIAL REPORTING AND DECISION MAKING
maximum amount of revenue in 2014 with AUD 60,952 million. In comparison the revenue of
the company has reduced to AUD 56,726 million in 2018. Thus, instead of increasing the
revenue of the company has decreased in last four years by almost 7% (Fazzini, 2018).
However, one positive that can be pointed out form the ratio analysis is the fact that the
company’s gross profit ratio has increased in each year. In 2014 it was 27.03% which has
improved to 29.03% in 2018. However, the inability of the company to generate positive
operating income as the company has failed to earn positive operating income in all of the last
five years (Easton and Sommers, 2018). The management must take necessary steps to reduce
the operating expenditures to improve its operating income. The net operating loss as can be seen
has increased in each year to stand at AUD 9,291 million. Net income of the company from
continuing operations has also declined in each subsequent year since 2014 to currently stand at
AUD 1,676 million. Compared to a net profit ratio of 4.03% in 2014 the company only managed
to earn 2.95% (Dalnial et. al. 2015).
Observation:
Thus, from the above discussion it is clear that the financial performance of Woolworths Group
Limited has deteriorated significantly over the last few years.
chevron_up_icon
1 out of 6
circle_padding
hide_on_mobile
zoom_out_icon
[object Object]