FNSACC504: Financial Reports - Data Compilation and Presentation
VerifiedAdded on 2023/06/03
|27
|4589
|257
Homework Assignment
AI Summary
This FNSACC504 assessment solution provides detailed answers to questions on data compilation and financial reporting for corporate entities. It includes data conversion and consolidation procedures, spreadsheet tasks involving batting averages of a cricket team, depreciation calculations using diminishing value and prime cost methods, and retail inventory method calculations. The solution also covers journal entries with GST, presentation of car sales data in pie charts and line graphs, and a review of National Australia Bank's financial report for compliance with statutory requirements. Furthermore, it addresses ethical issues in governance and the alignment of organizational policies with statutory reporting requirements. Desklib offers this and many more solved assignments.

Assessment Workbook – FNSACC504 1 | P a g e Version 3.0
Paraphrase This Document
Need a fresh take? Get an instant paraphrase of this document with our AI Paraphraser
Assessment 1: Short Answer Questions
The objective of this section is to demonstrate 1.0 Compile data
Question 2
a. Give three (3) data conversion procedures and explain when you would use them to
compile data in accordance with organisational policy and procedures.
The following are the data conversion procedures:
Running the new system parallel to the old system. In this, both of the systems are run
parallel as against one another.
Phase in the new system. This includes the conversion of just location which contains
the data to migrate.
Direct changeover. This means converting the entire system into the new system
(Small business chron, 2018).
b. Give three (3) consolidation procedures used in accounting and explain used to
compile data in accordance with organisational policy and procedures.
The following are the 3 conversion procedures:
Consolidation: this is when a company (investor) holds more than 51% of the
share capital of the other company (investee). In such cases, both of the books
of the companies are combined as one.
Equity method: this is when an investee possess a minor ownership of the
share capital in the investee.
Assessment Workbook – FNSACC504 2 | P a g e Version 3.0
Equity pick up: this is when the cost method includes the recording of an
investment as an asset and also records the dividends as an income to the
investor (Corporate finance institute, 2018).
Question 3
Complete the tasks below and ensure they are correctly entered into a spreadsheet.
1. Create a new workbook to reflect the batting average of the Australia cricket team
over a designated period in a series of 5 matches.
2. Names of the below batsmen should be listed down in Column A.
a. Michael Clarke
b. George Bailey
c. Pat Cummins
d. Xavier Doherty
e. Aaron Finch
f. Josh Hazlewood
g. Brad Hadin
h. James Faulkner
i. Mitchel Johnson
j. Mitchell Starc
k. David Warner
3. Matches 1, 2, 3, 4 and 5 headings should be in columns B, C, D, E and F respectively.
Input run score for each player of each match. (could be any figures of your choice)
4. Record the individual totals in column G and average score in Column H
5. Calculate minimum and maximum runs for each match and each player in column I
and J respectively
Assessment Workbook – FNSACC504 3 | P a g e Version 3.0
⊘ This is a preview!⊘
Do you want full access?
Subscribe today to unlock all pages.
Trusted by 1+ million students worldwide
6. Use AutoFill wherever necessary.
7. Present the Match totals in a stacked column Bar chart
8. Add a footer with your name, date and filename.
9. Create a column chart on a new sheet showing the averages, minimums and
maximums for each player.
10. Save the workbook as Activity 3
11. Submit the file in your Moodle
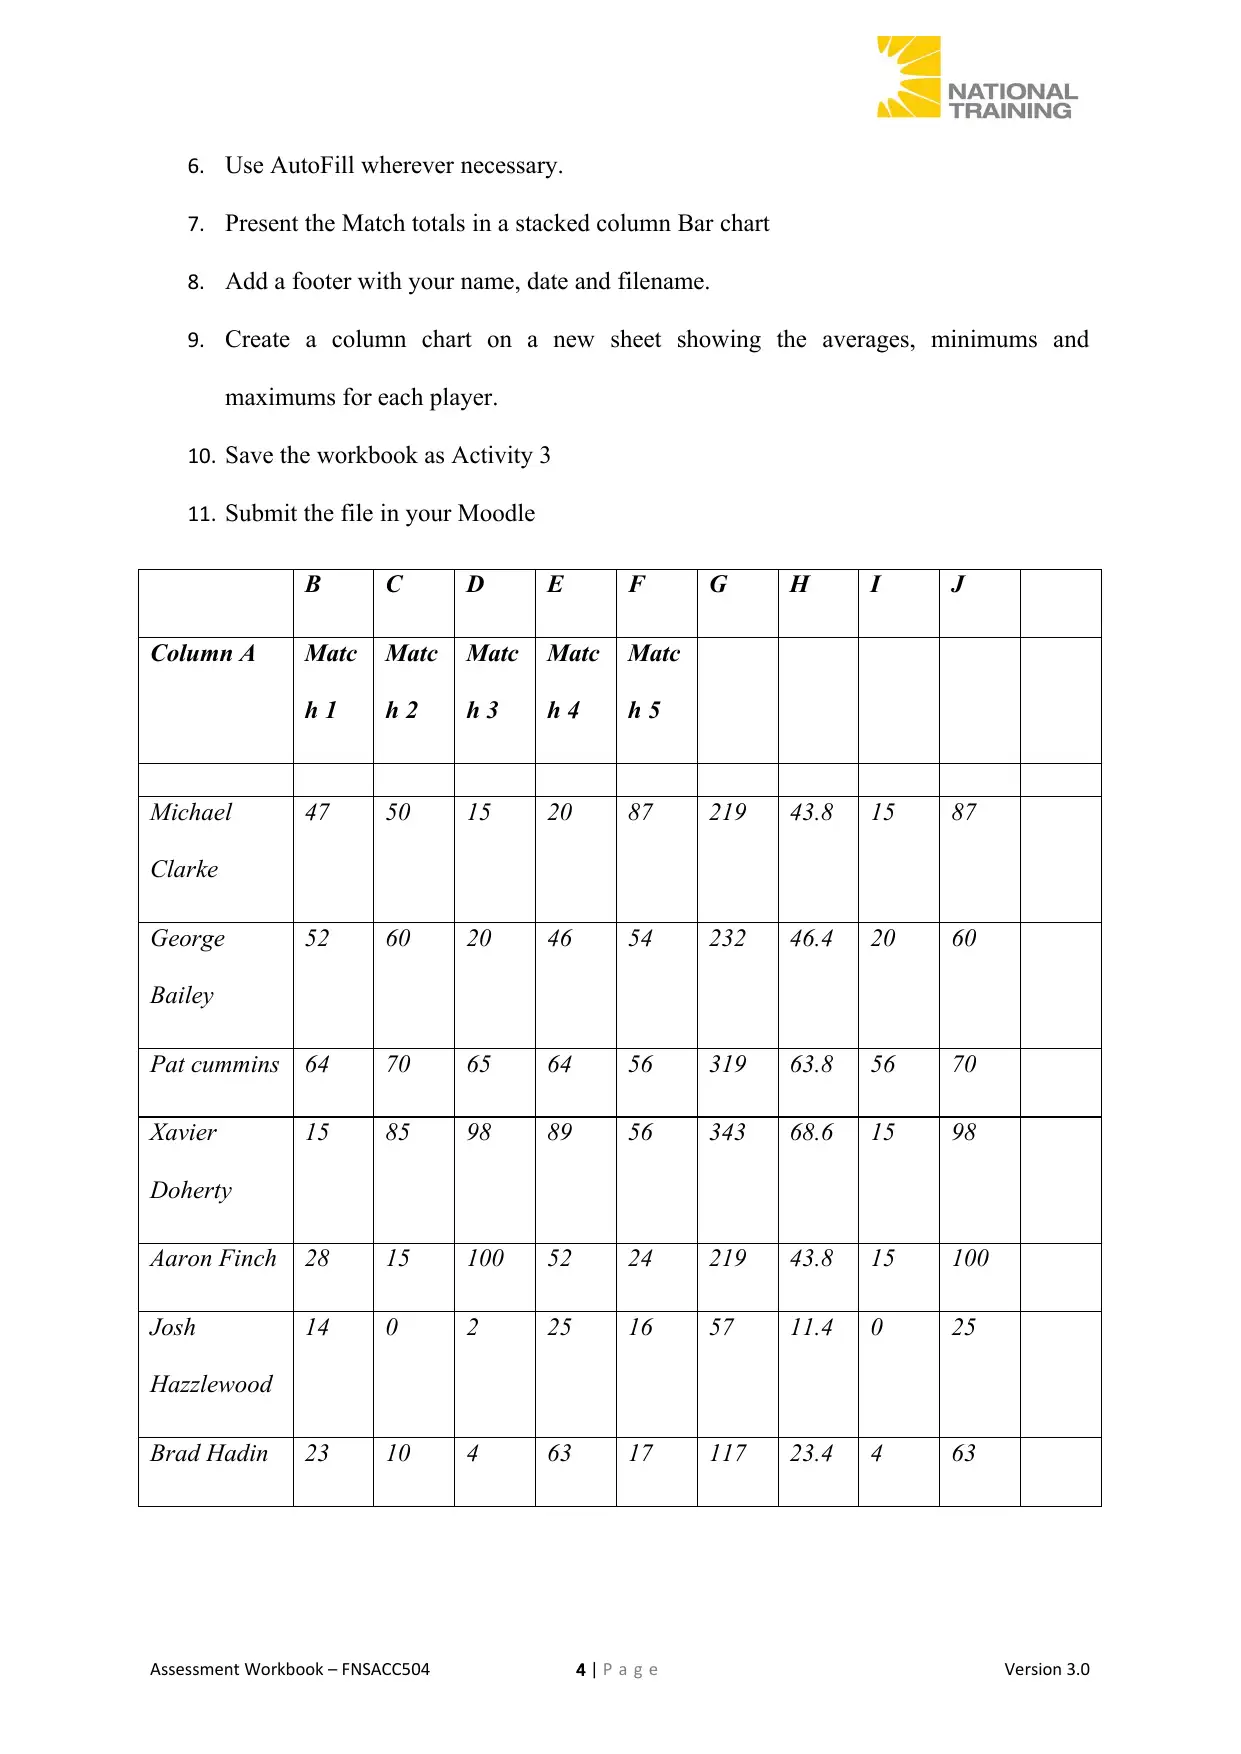
B C D E F G H I J
Column A Matc
h 1
Matc
h 2
Matc
h 3
Matc
h 4
Matc
h 5
Michael
Clarke
47 50 15 20 87 219 43.8 15 87
George
Bailey
52 60 20 46 54 232 46.4 20 60
Pat cummins 64 70 65 64 56 319 63.8 56 70
Xavier
Doherty
15 85 98 89 56 343 68.6 15 98
Aaron Finch 28 15 100 52 24 219 43.8 15 100
Josh
Hazzlewood
14 0 2 25 16 57 11.4 0 25
Brad Hadin 23 10 4 63 17 117 23.4 4 63
Assessment Workbook – FNSACC504 4 | P a g e Version 3.0
7. Present the Match totals in a stacked column Bar chart
8. Add a footer with your name, date and filename.
9. Create a column chart on a new sheet showing the averages, minimums and
maximums for each player.
10. Save the workbook as Activity 3
11. Submit the file in your Moodle
B C D E F G H I J
Column A Matc
h 1
Matc
h 2
Matc
h 3
Matc
h 4
Matc
h 5
Michael
Clarke
47 50 15 20 87 219 43.8 15 87
George
Bailey
52 60 20 46 54 232 46.4 20 60
Pat cummins 64 70 65 64 56 319 63.8 56 70
Xavier
Doherty
15 85 98 89 56 343 68.6 15 98
Aaron Finch 28 15 100 52 24 219 43.8 15 100
Josh
Hazzlewood
14 0 2 25 16 57 11.4 0 25
Brad Hadin 23 10 4 63 17 117 23.4 4 63
Assessment Workbook – FNSACC504 4 | P a g e Version 3.0
Paraphrase This Document
Need a fresh take? Get an instant paraphrase of this document with our AI Paraphraser
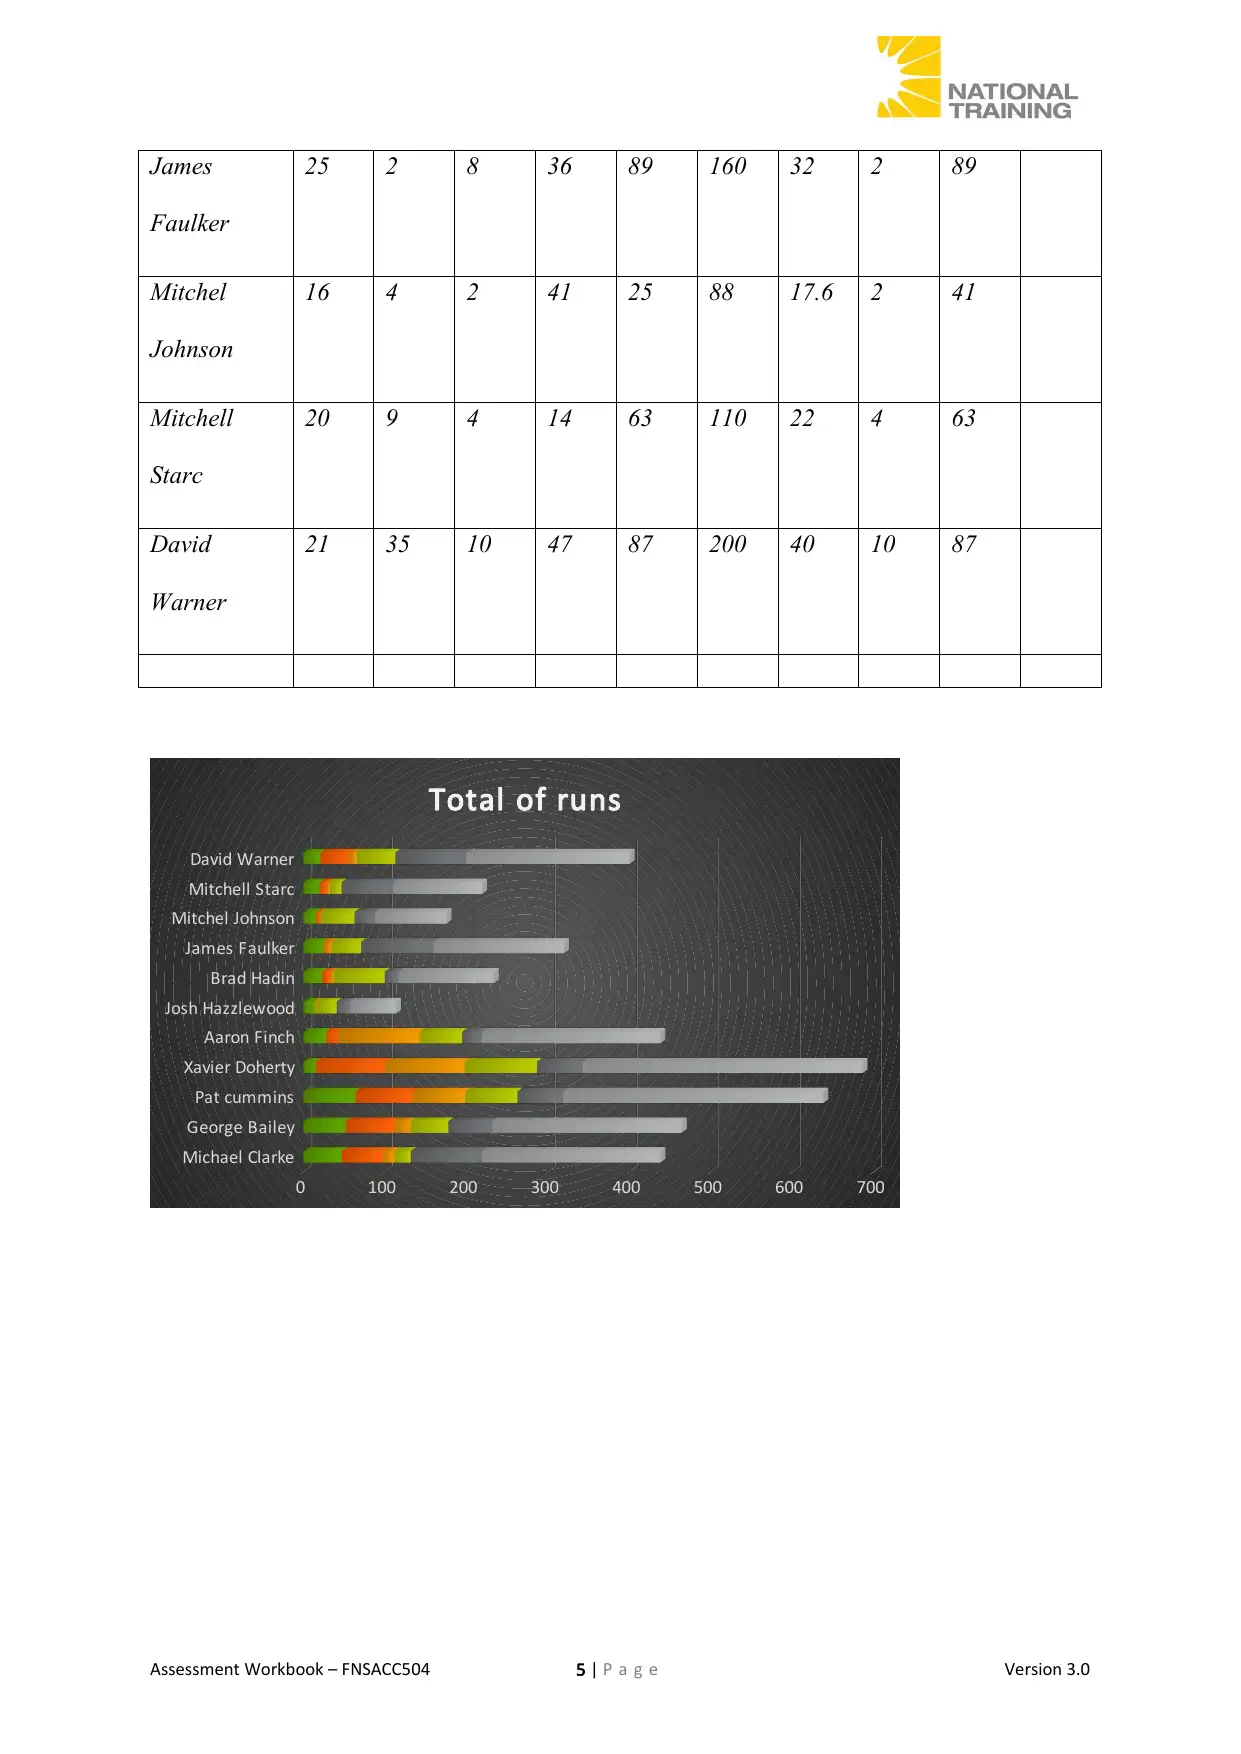
James
Faulker
25 2 8 36 89 160 32 2 89
Mitchel
Johnson
16 4 2 41 25 88 17.6 2 41
Mitchell
Starc
20 9 4 14 63 110 22 4 63
David
Warner
21 35 10 47 87 200 40 10 87
Michael Clarke
George Bailey
Pat cummins
Xavier Doherty
Aaron Finch
Josh Hazzlewood
Brad Hadin
James Faulker
Mitchel Johnson
Mitchell Starc
David Warner
0 100 200 300 400 500 600 700
Total of runs
Assessment Workbook – FNSACC504 5 | P a g e Version 3.0
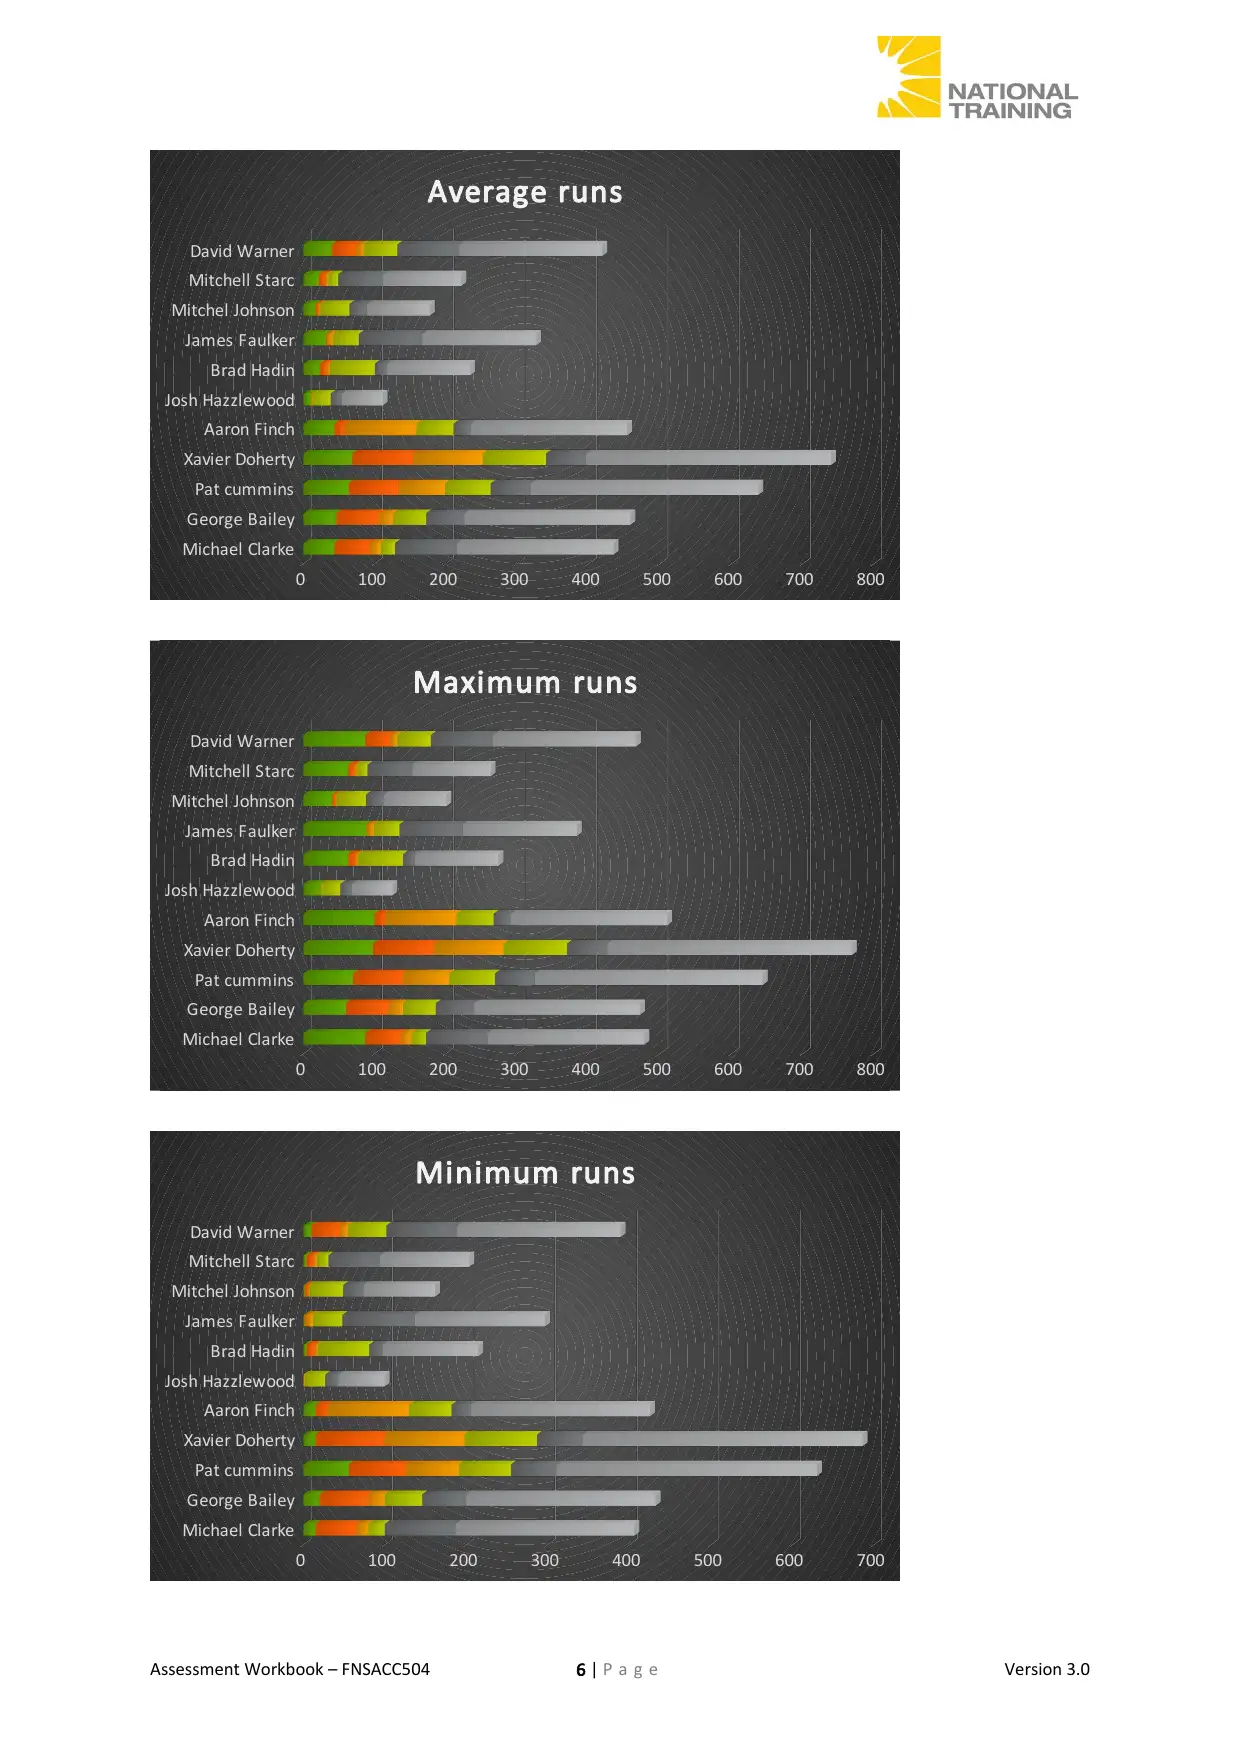
Michael Clarke
George Bailey
Pat cummins
Xavier Doherty
Aaron Finch
Josh Hazzlewood
Brad Hadin
James Faulker
Mitchel Johnson
Mitchell Starc
David Warner
0 100 200 300 400 500 600 700 800
Average runs
Michael Clarke
George Bailey
Pat cummins
Xavier Doherty
Aaron Finch
Josh Hazzlewood
Brad Hadin
James Faulker
Mitchel Johnson
Mitchell Starc
David Warner
0 100 200 300 400 500 600 700 800
Maximum runs
Michael Clarke
George Bailey
Pat cummins
Xavier Doherty
Aaron Finch
Josh Hazzlewood
Brad Hadin
James Faulker
Mitchel Johnson
Mitchell Starc
David Warner
0 100 200 300 400 500 600 700
Minimum runs
Assessment Workbook – FNSACC504 6 | P a g e Version 3.0
George Bailey
Pat cummins
Xavier Doherty
Aaron Finch
Josh Hazzlewood
Brad Hadin
James Faulker
Mitchel Johnson
Mitchell Starc
David Warner
0 100 200 300 400 500 600 700 800
Average runs
Michael Clarke
George Bailey
Pat cummins
Xavier Doherty
Aaron Finch
Josh Hazzlewood
Brad Hadin
James Faulker
Mitchel Johnson
Mitchell Starc
David Warner
0 100 200 300 400 500 600 700 800
Maximum runs
Michael Clarke
George Bailey
Pat cummins
Xavier Doherty
Aaron Finch
Josh Hazzlewood
Brad Hadin
James Faulker
Mitchel Johnson
Mitchell Starc
David Warner
0 100 200 300 400 500 600 700
Minimum runs
Assessment Workbook – FNSACC504 6 | P a g e Version 3.0
⊘ This is a preview!⊘
Do you want full access?
Subscribe today to unlock all pages.
Trusted by 1+ million students worldwide
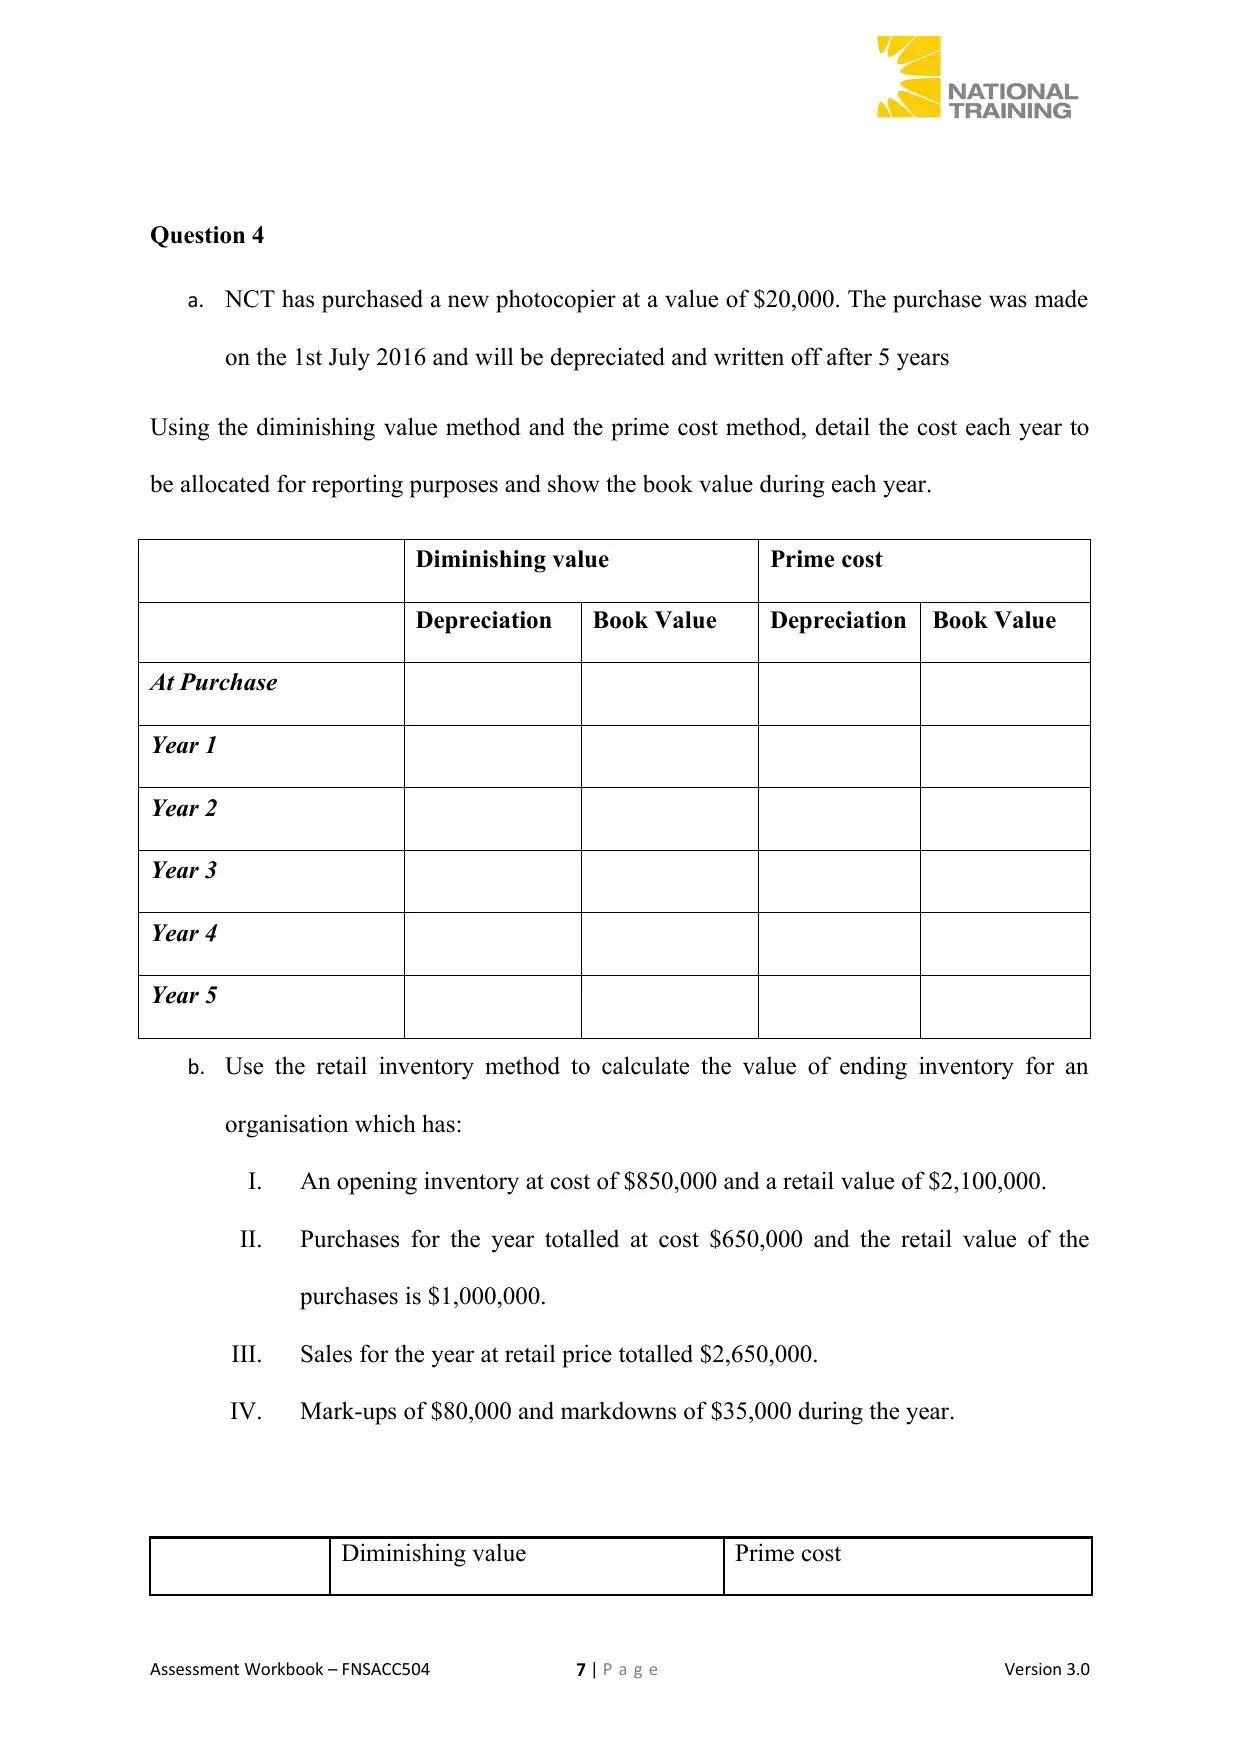
Question 4
a. NCT has purchased a new photocopier at a value of $20,000. The purchase was made
on the 1st July 2016 and will be depreciated and written off after 5 years
Using the diminishing value method and the prime cost method, detail the cost each year to
be allocated for reporting purposes and show the book value during each year.
Diminishing value Prime cost
Depreciation Book Value Depreciation Book Value
At Purchase
Year 1
Year 2
Year 3
Year 4
Year 5
b. Use the retail inventory method to calculate the value of ending inventory for an
organisation which has:
I. An opening inventory at cost of $850,000 and a retail value of $2,100,000.
II. Purchases for the year totalled at cost $650,000 and the retail value of the
purchases is $1,000,000.
III. Sales for the year at retail price totalled $2,650,000.
IV. Mark-ups of $80,000 and markdowns of $35,000 during the year.
Diminishing value Prime cost
Assessment Workbook – FNSACC504 7 | P a g e Version 3.0
Paraphrase This Document
Need a fresh take? Get an instant paraphrase of this document with our AI Paraphraser
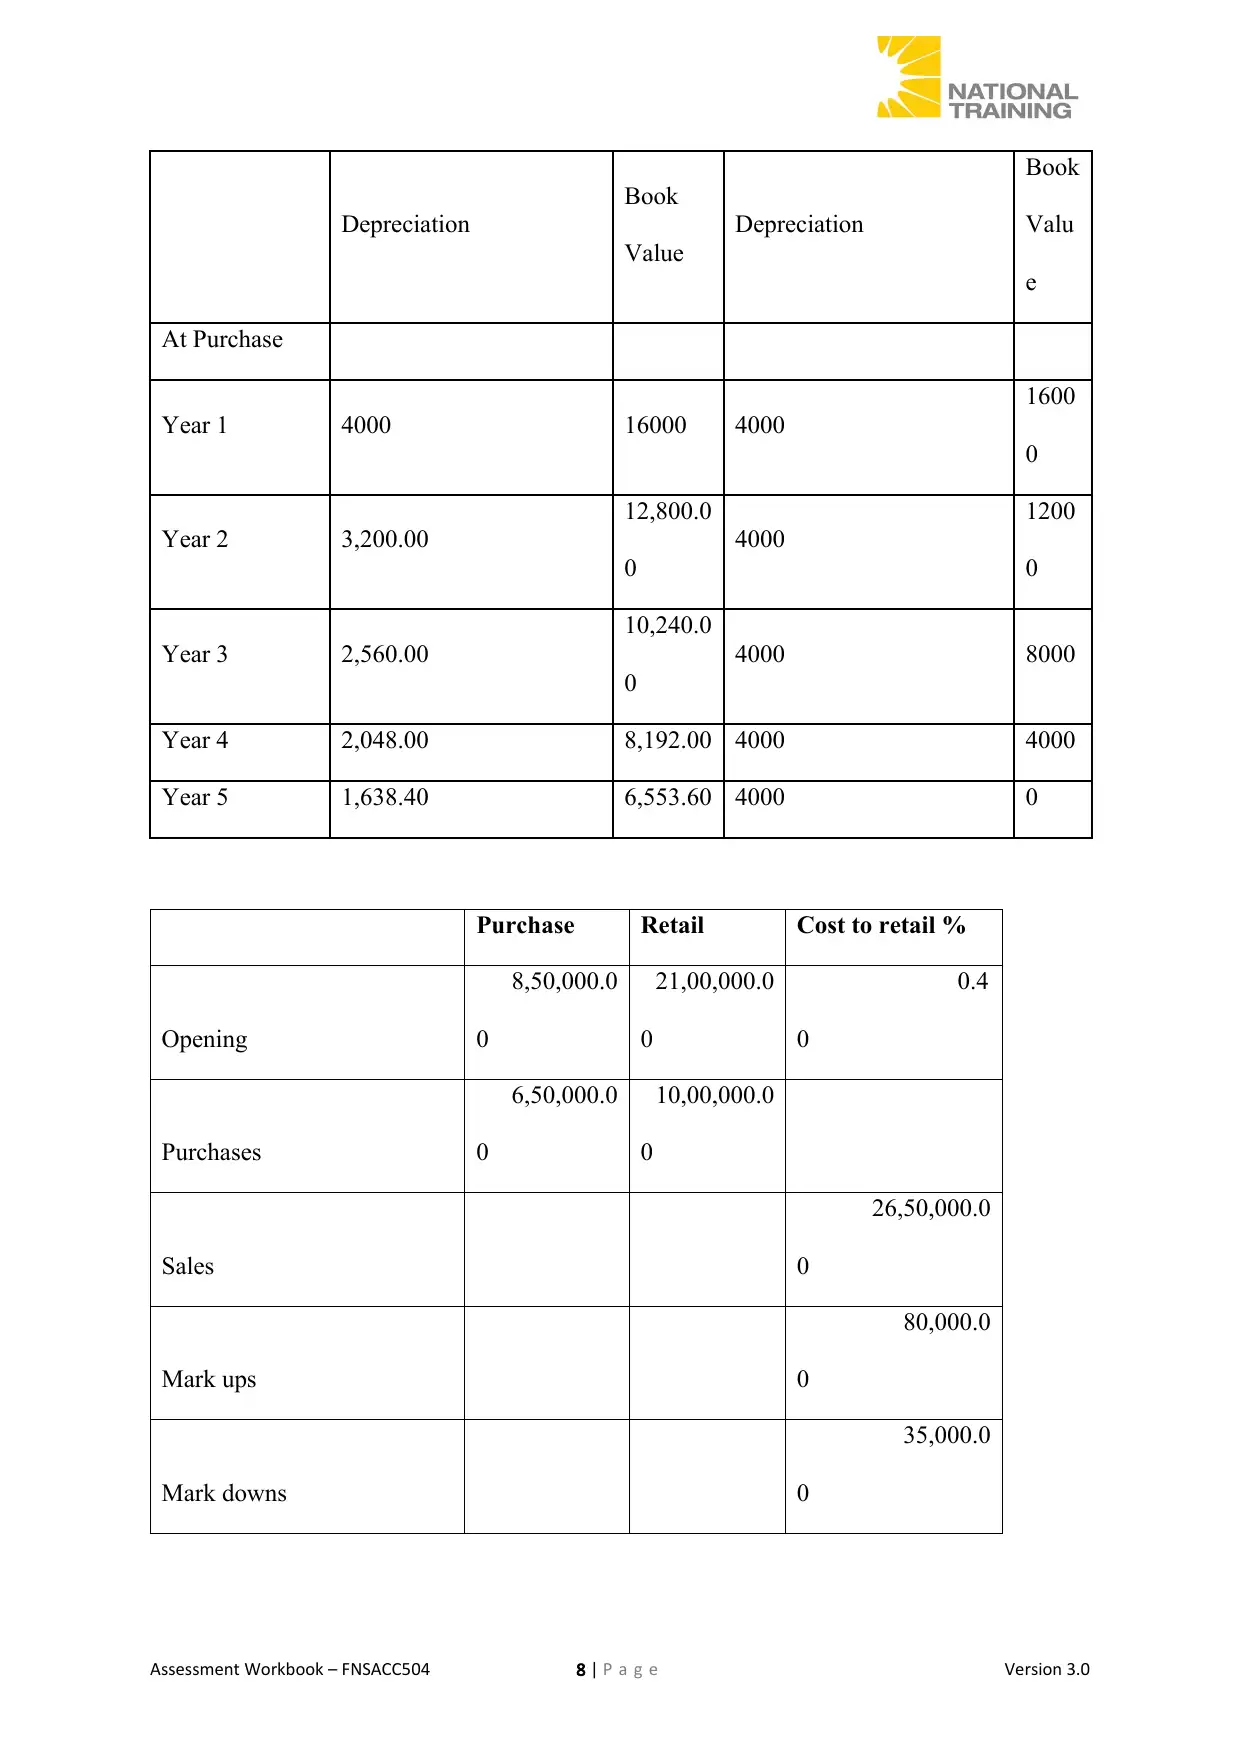
Depreciation
Book
Value
Depreciation
Book
Valu
e
At Purchase
Year 1 4000 16000 4000
1600
0
Year 2 3,200.00
12,800.0
0
4000
1200
0
Year 3 2,560.00
10,240.0
0
4000 8000
Year 4 2,048.00 8,192.00 4000 4000
Year 5 1,638.40 6,553.60 4000 0
Purchase Retail Cost to retail %
Opening
8,50,000.0
0
21,00,000.0
0
0.4
0
Purchases
6,50,000.0
0
10,00,000.0
0
Sales
26,50,000.0
0
Mark ups
80,000.0
0
Mark downs
35,000.0
0
Assessment Workbook – FNSACC504 8 | P a g e Version 3.0
Book
Value
Depreciation
Book
Valu
e
At Purchase
Year 1 4000 16000 4000
1600
0
Year 2 3,200.00
12,800.0
0
4000
1200
0
Year 3 2,560.00
10,240.0
0
4000 8000
Year 4 2,048.00 8,192.00 4000 4000
Year 5 1,638.40 6,553.60 4000 0
Purchase Retail Cost to retail %
Opening
8,50,000.0
0
21,00,000.0
0
0.4
0
Purchases
6,50,000.0
0
10,00,000.0
0
Sales
26,50,000.0
0
Mark ups
80,000.0
0
Mark downs
35,000.0
0
Assessment Workbook – FNSACC504 8 | P a g e Version 3.0
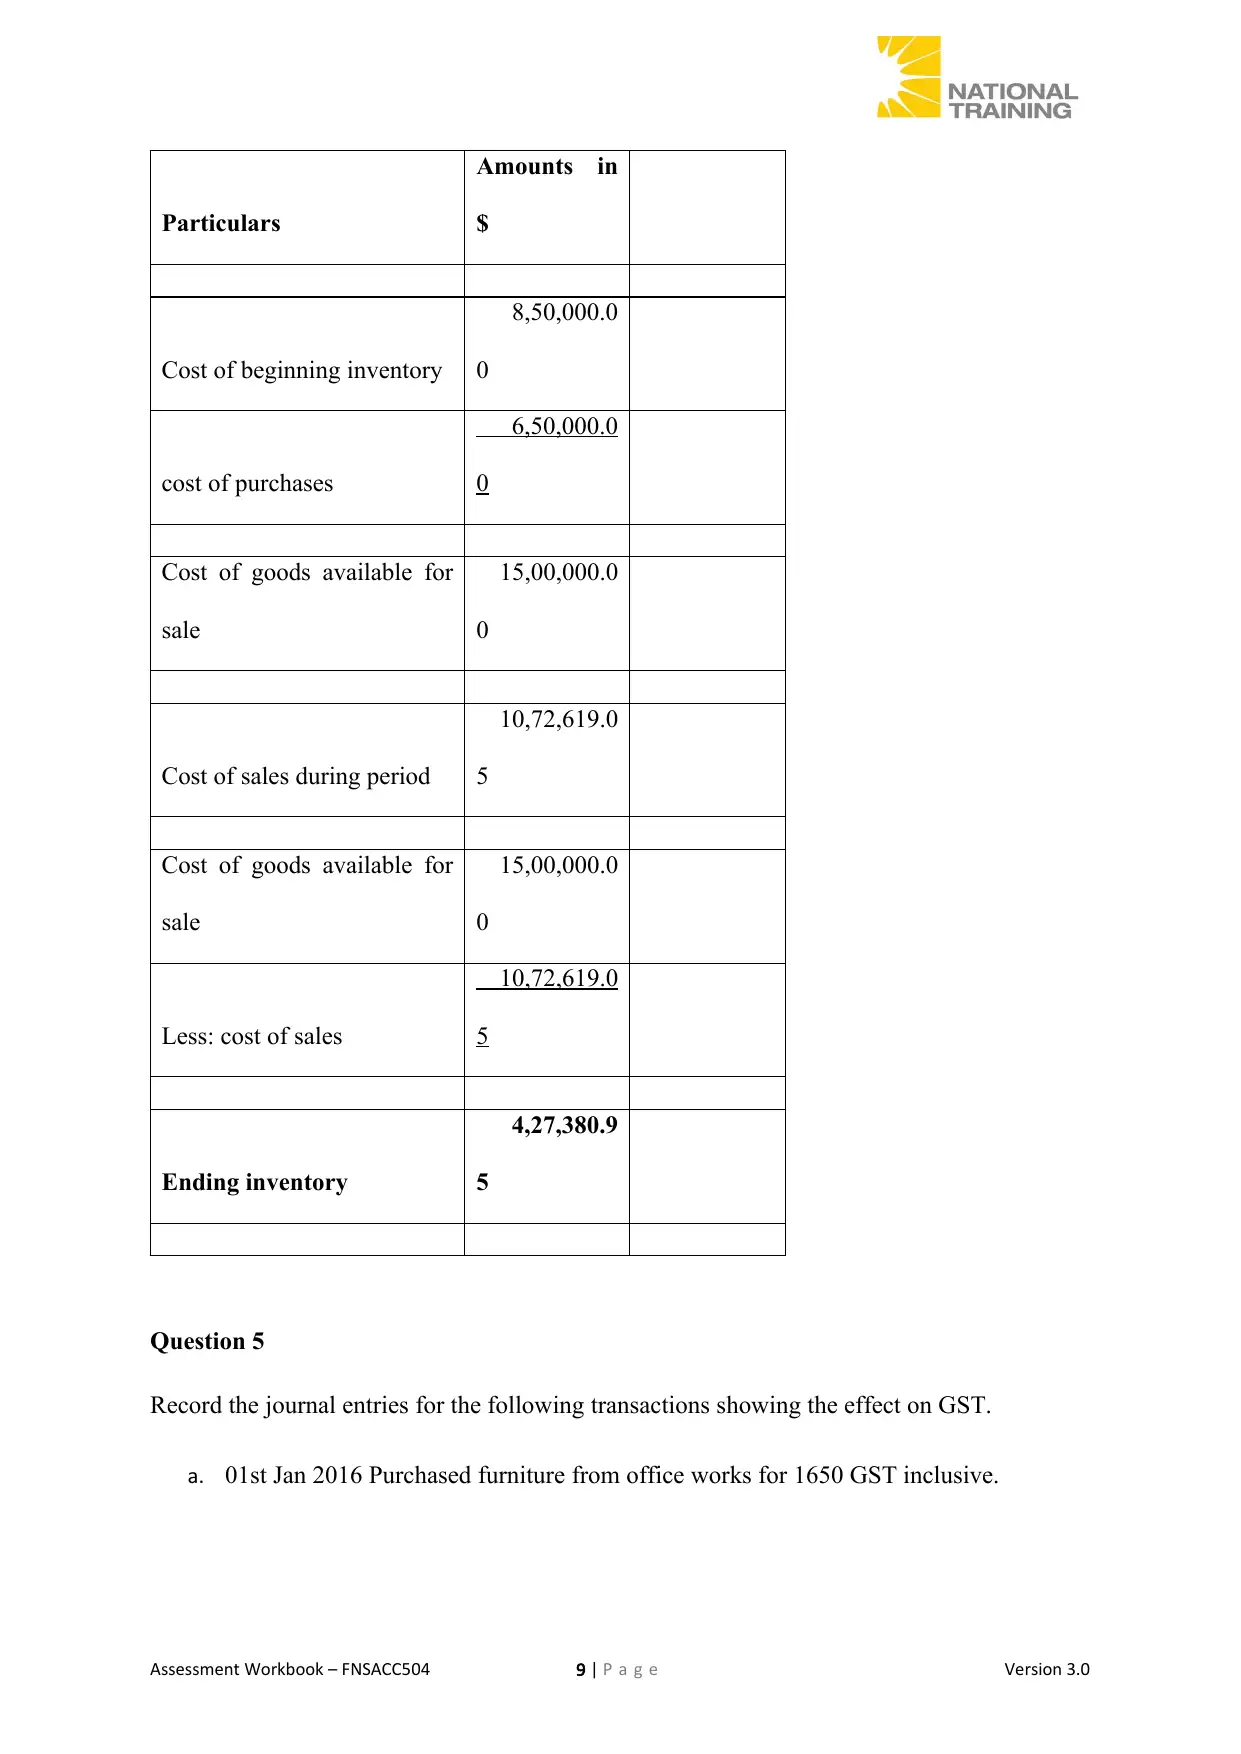
Particulars
Amounts in
$
Cost of beginning inventory
8,50,000.0
0
cost of purchases
6,50,000.0
0
Cost of goods available for
sale
15,00,000.0
0
Cost of sales during period
10,72,619.0
5
Cost of goods available for
sale
15,00,000.0
0
Less: cost of sales
10,72,619.0
5
Ending inventory
4,27,380.9
5
Question 5
Record the journal entries for the following transactions showing the effect on GST.
a. 01st Jan 2016 Purchased furniture from office works for 1650 GST inclusive.
Assessment Workbook – FNSACC504 9 | P a g e Version 3.0
⊘ This is a preview!⊘
Do you want full access?
Subscribe today to unlock all pages.
Trusted by 1+ million students worldwide
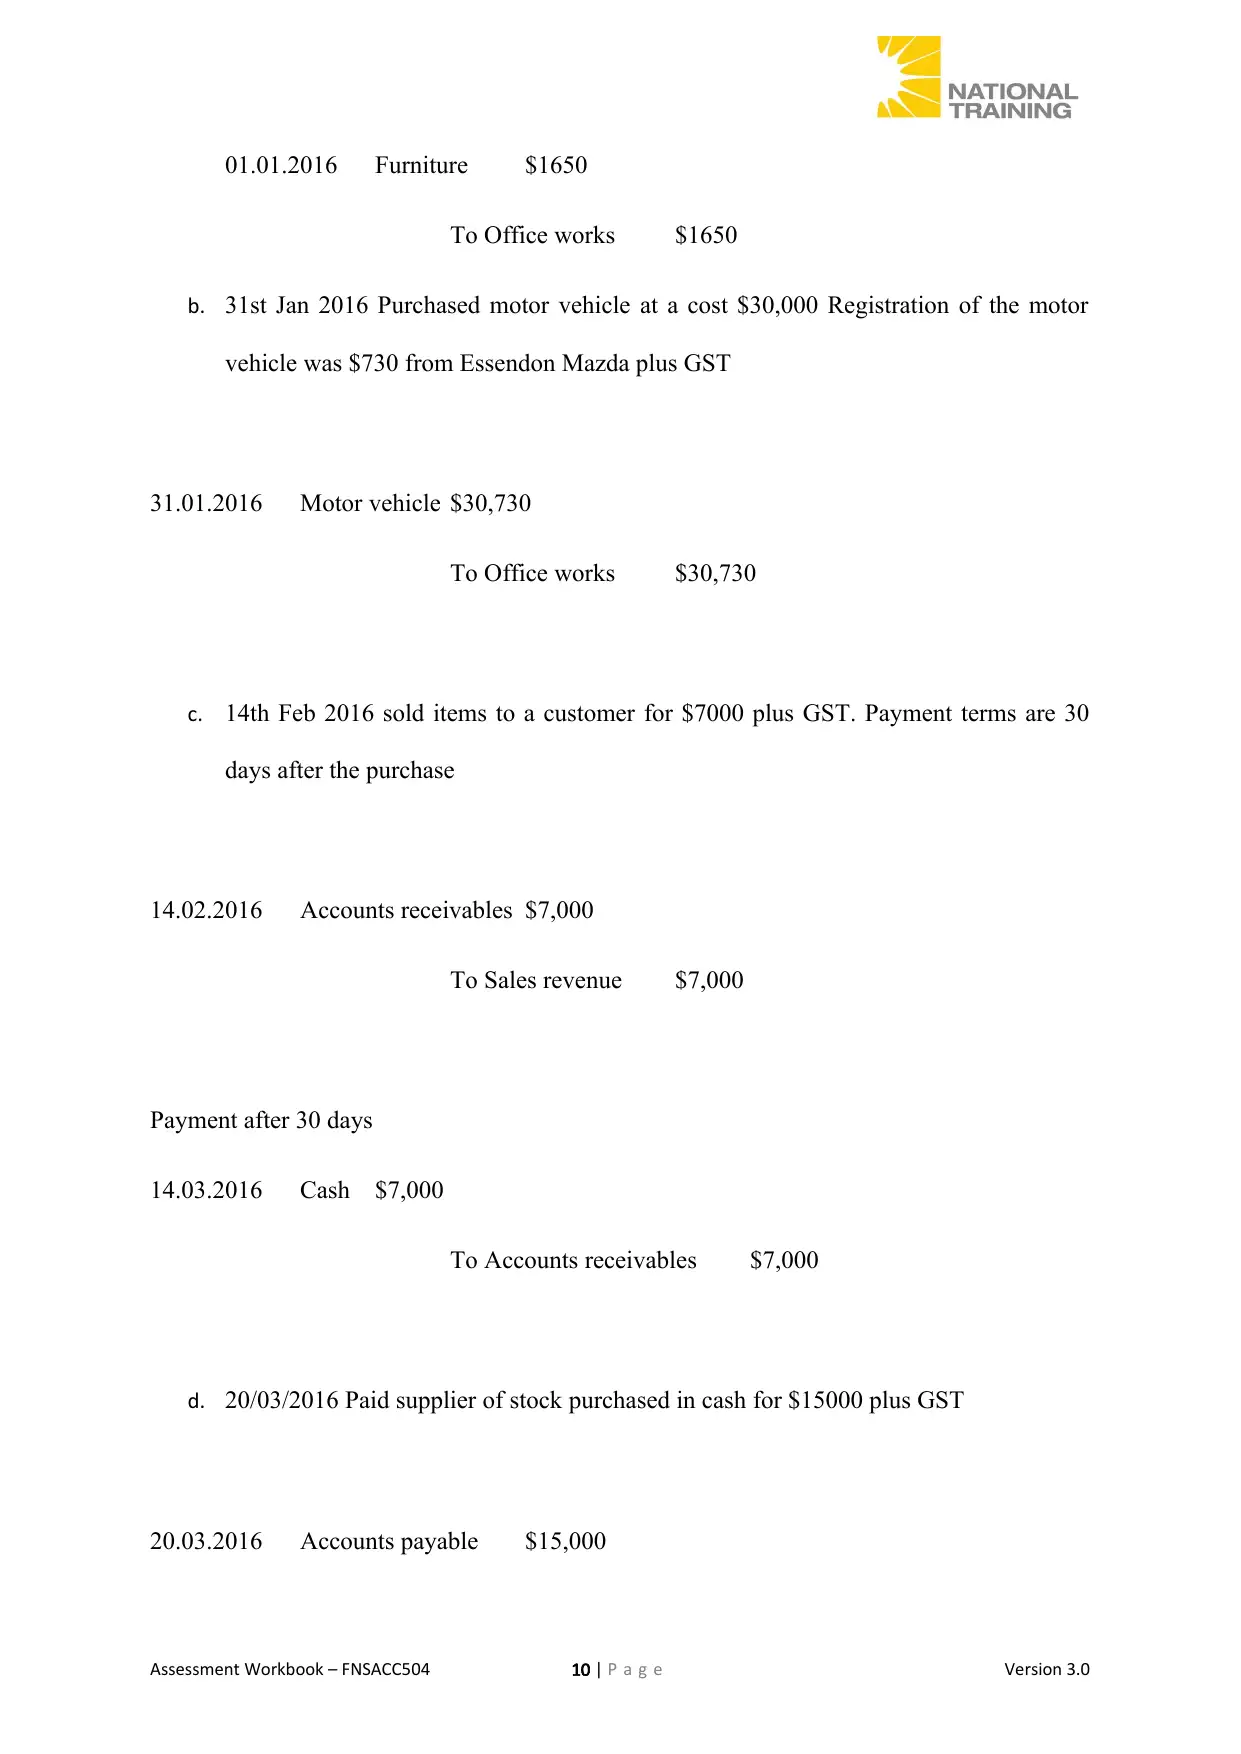
01.01.2016 Furniture $1650
To Office works $1650
b. 31st Jan 2016 Purchased motor vehicle at a cost $30,000 Registration of the motor
vehicle was $730 from Essendon Mazda plus GST
31.01.2016 Motor vehicle $30,730
To Office works $30,730
c. 14th Feb 2016 sold items to a customer for $7000 plus GST. Payment terms are 30
days after the purchase
14.02.2016 Accounts receivables $7,000
To Sales revenue $7,000
Payment after 30 days
14.03.2016 Cash $7,000
To Accounts receivables $7,000
d. 20/03/2016 Paid supplier of stock purchased in cash for $15000 plus GST
20.03.2016 Accounts payable $15,000
Assessment Workbook – FNSACC504 10 | P a g e Version 3.0
Paraphrase This Document
Need a fresh take? Get an instant paraphrase of this document with our AI Paraphraser
To Cash $15,000
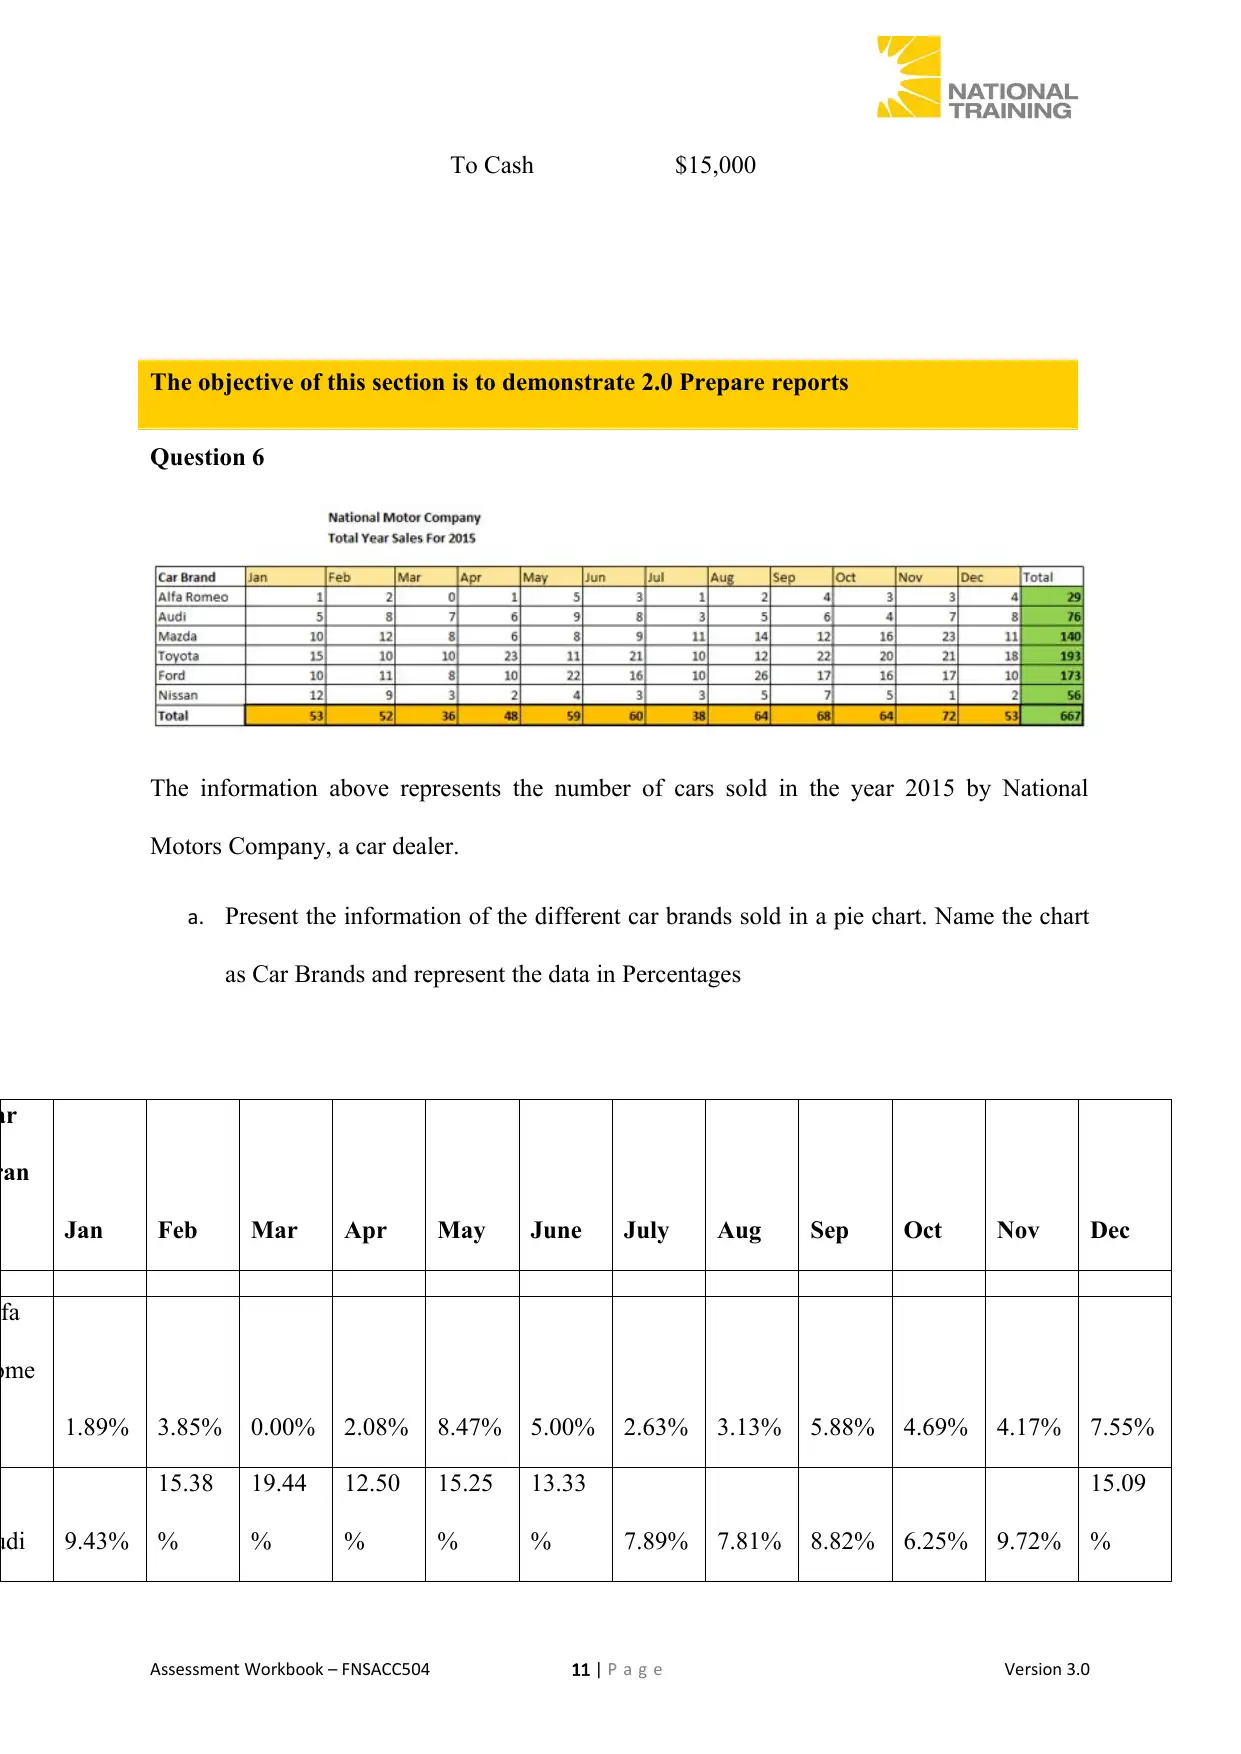
The objective of this section is to demonstrate 2.0 Prepare reports
Question 6
The information above represents the number of cars sold in the year 2015 by National
Motors Company, a car dealer.
a. Present the information of the different car brands sold in a pie chart. Name the chart
as Car Brands and represent the data in Percentages
ar
ran
Jan Feb Mar Apr May June July Aug Sep Oct Nov Dec
lfa
ome
1.89% 3.85% 0.00% 2.08% 8.47% 5.00% 2.63% 3.13% 5.88% 4.69% 4.17% 7.55%
udi 9.43%
15.38
%
19.44
%
12.50
%
15.25
%
13.33
% 7.89% 7.81% 8.82% 6.25% 9.72%
15.09
%
Assessment Workbook – FNSACC504 11 | P a g e Version 3.0
azd 18.87
%
23.08
%
22.22
%
12.50
%
13.56
%
15.00
%
28.95
%
21.88
%
17.65
%
25.00
%
31.94
%
20.75
%
oyot 28.30
%
19.23
%
27.78
%
47.92
%
18.64
%
35.00
%
26.32
%
18.75
%
32.35
%
31.25
%
29.17
%
33.96
%
ord
18.87
%
21.15
%
22.22
%
20.83
%
37.29
%
26.67
%
26.32
%
40.63
%
25.00
%
25.00
%
23.61
%
18.87
%
issa 22.64
%
17.31
% 8.33% 4.17% 6.78% 5.00% 7.89% 7.81%
10.29
% 7.81% 1.39% 3.77%
otal 1 1 1 1 1 1 1 1 1 1 1 1
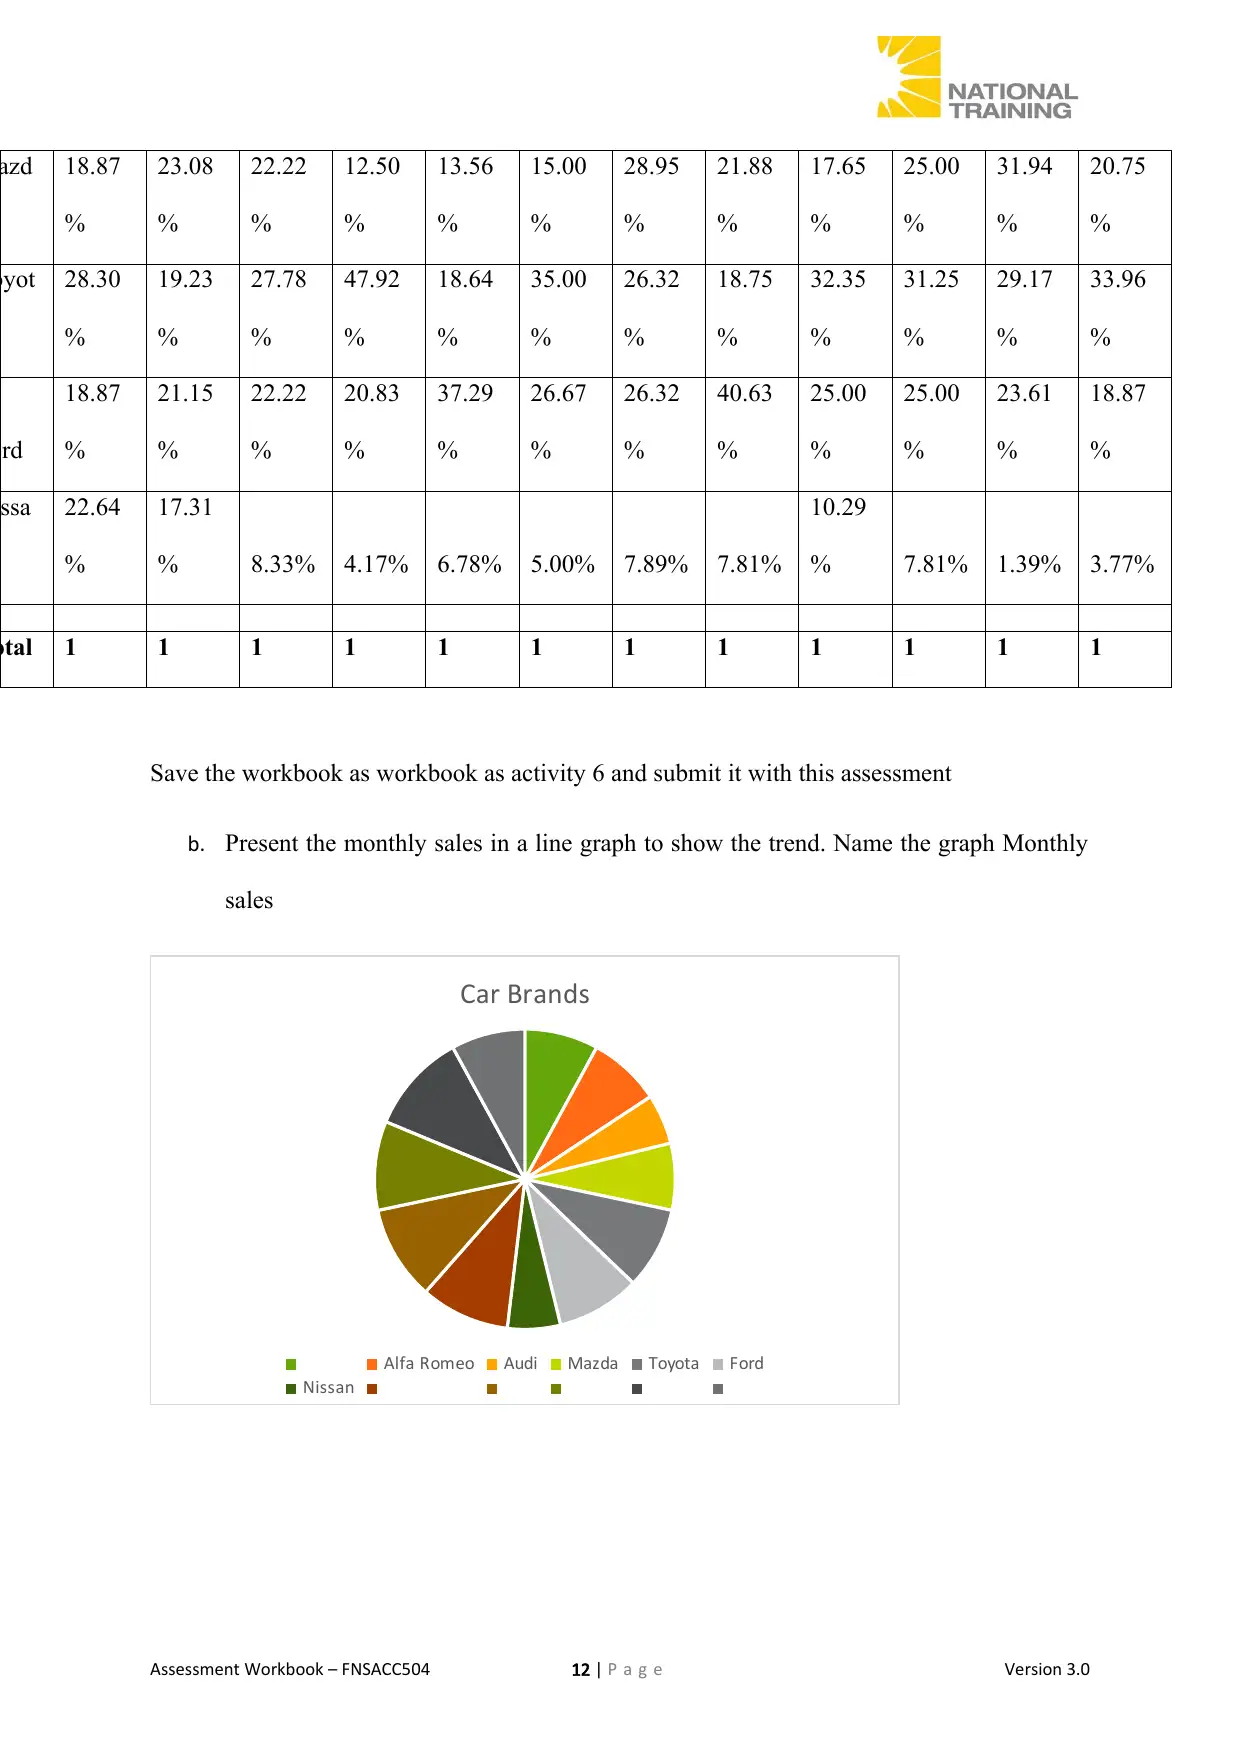
Save the workbook as workbook as activity 6 and submit it with this assessment
b. Present the monthly sales in a line graph to show the trend. Name the graph Monthly
sales
Car Brands
Alfa Romeo Audi Mazda Toyota Ford
Nissan
Assessment Workbook – FNSACC504 12 | P a g e Version 3.0
%
23.08
%
22.22
%
12.50
%
13.56
%
15.00
%
28.95
%
21.88
%
17.65
%
25.00
%
31.94
%
20.75
%
oyot 28.30
%
19.23
%
27.78
%
47.92
%
18.64
%
35.00
%
26.32
%
18.75
%
32.35
%
31.25
%
29.17
%
33.96
%
ord
18.87
%
21.15
%
22.22
%
20.83
%
37.29
%
26.67
%
26.32
%
40.63
%
25.00
%
25.00
%
23.61
%
18.87
%
issa 22.64
%
17.31
% 8.33% 4.17% 6.78% 5.00% 7.89% 7.81%
10.29
% 7.81% 1.39% 3.77%
otal 1 1 1 1 1 1 1 1 1 1 1 1
Save the workbook as workbook as activity 6 and submit it with this assessment
b. Present the monthly sales in a line graph to show the trend. Name the graph Monthly
sales
Car Brands
Alfa Romeo Audi Mazda Toyota Ford
Nissan
Assessment Workbook – FNSACC504 12 | P a g e Version 3.0
⊘ This is a preview!⊘
Do you want full access?
Subscribe today to unlock all pages.
Trusted by 1+ million students worldwide
1 out of 27
Your All-in-One AI-Powered Toolkit for Academic Success.
+13062052269
info@desklib.com
Available 24*7 on WhatsApp / Email
![[object Object]](/_next/static/media/star-bottom.7253800d.svg)
Unlock your academic potential
Copyright © 2020–2026 A2Z Services. All Rights Reserved. Developed and managed by ZUCOL.