Comprehensive Report on Managing Financial Resources in Business
VerifiedAdded on 2020/12/09
|13
|3524
|240
Report
AI Summary
This report provides a comprehensive analysis of financial resource management, focusing on cost analysis, break-even points, and cash budgeting within the context of a UK-based company, New Horizons Accountants Ltd. The report begins with an introduction to financial resources and their importance, followed by a detailed examination of various cost types (fixed, variable, and semi-variable), and their impact on business operations. It also includes the use of a cost-volume-profit graph to illustrate the relationship between costs, volume, and profit, alongside the calculation of break-even points in both units and pound sterling for Beta Company. Furthermore, the report addresses the preparation of a cash budget for Alpha Ltd and explores the effects of changes in sales volume and costs on profitability and break-even points. The report concludes with a cash budget and a summary of the key findings.
MANAGING
FINANCIAL
RESOURCES
FINANCIAL
RESOURCES
Paraphrase This Document
Need a fresh take? Get an instant paraphrase of this document with our AI Paraphraser
Table of Contents
INTRODUCTION ..........................................................................................................................3
TASK 1 A........................................................................................................................................3
1.Various types cost in a business...............................................................................................3
2. Use of cost volume profit graph..............................................................................................6
TASK 1 B........................................................................................................................................7
1. Break even point in unit and pound sterling...........................................................................7
2. CVP graph showing break even point.....................................................................................8
3. Income at desired sales 18500 units........................................................................................9
4. If managers is paid £6 per blouse, than effect on BEP:..........................................................9
5. Change in profit when selling 23500 units...........................................................................10
6. Change in BEP if salaries are increased by 214000..............................................................10
TASK 2..........................................................................................................................................10
1. Cash budget...........................................................................................................................10
CONCLUSION..............................................................................................................................12
REFERENCES..............................................................................................................................13
INTRODUCTION
The financial resources are important part of organization and set of liquid assets of an
organization such as cash, liquid financial investment (stocks, bonds), short term bank deposits.
These resources are mostly using for move out to operate business operation like as buying
goods and services, and carry out long term investments. Managing financial resources involved
management of financial resources in organization prospective. It aims to provide terms and
techniques of accountancy to manager to easily understand of financial report sand communicate
about that. In this project the company taken is New Horizons accountants Ltd, which is related
to UK.
This project report included various tasks which are classify in types of costs with
examples, cost information on a cost volume profit graph, calculation of break even point in unit
and pound sterling of Beta Company, prepare cash budget of Alpha Ltd and cover all
adjustments in task.
TASK 1 A
1.Various types cost in a business
Cost - The word 'cost' means the sum of expenditure(actual or imaginary) incurred on
specified things or activity. It is a monetary amount that a company incurred in order to produce
goods and services. It is usually a monetary terms of resources, efforts, risk incurred, time and
utilities consumed, materials and possibility forgone in production or the goods and services
delivered. All expenditure are considered as a costs but all costs (such as which is obtained by
acquiring of an income- generating assets)are not considered as a expenditure. All this expenses
were recorded in bookkeeping records. For example, if we calculate the cost for preparing a
pizza, it itself incurred many other costs such as the flour cost, labor, other overheads. In the
same way , cost of production of any products or work as specified by the firm can be ascertain.
From the buyer's viewpoint, its is also called the price, it simply means that the amount which
the seller charges for the particular product. Cost is associated with factors of production such as
cost of capital, cost of labor, cost of a fixed assets. Cost of capital is measured in terms of
interest expenses which is specifically used to purchase the fixed assets. Cost of labor, which
were used to measured the remuneration and welfare basically used for manufacture of services
and goods. Cost of fixed assets, which measured in depreciation and were used for production.
⊘ This is a preview!⊘
Do you want full access?
Subscribe today to unlock all pages.
Trusted by 1+ million students worldwide
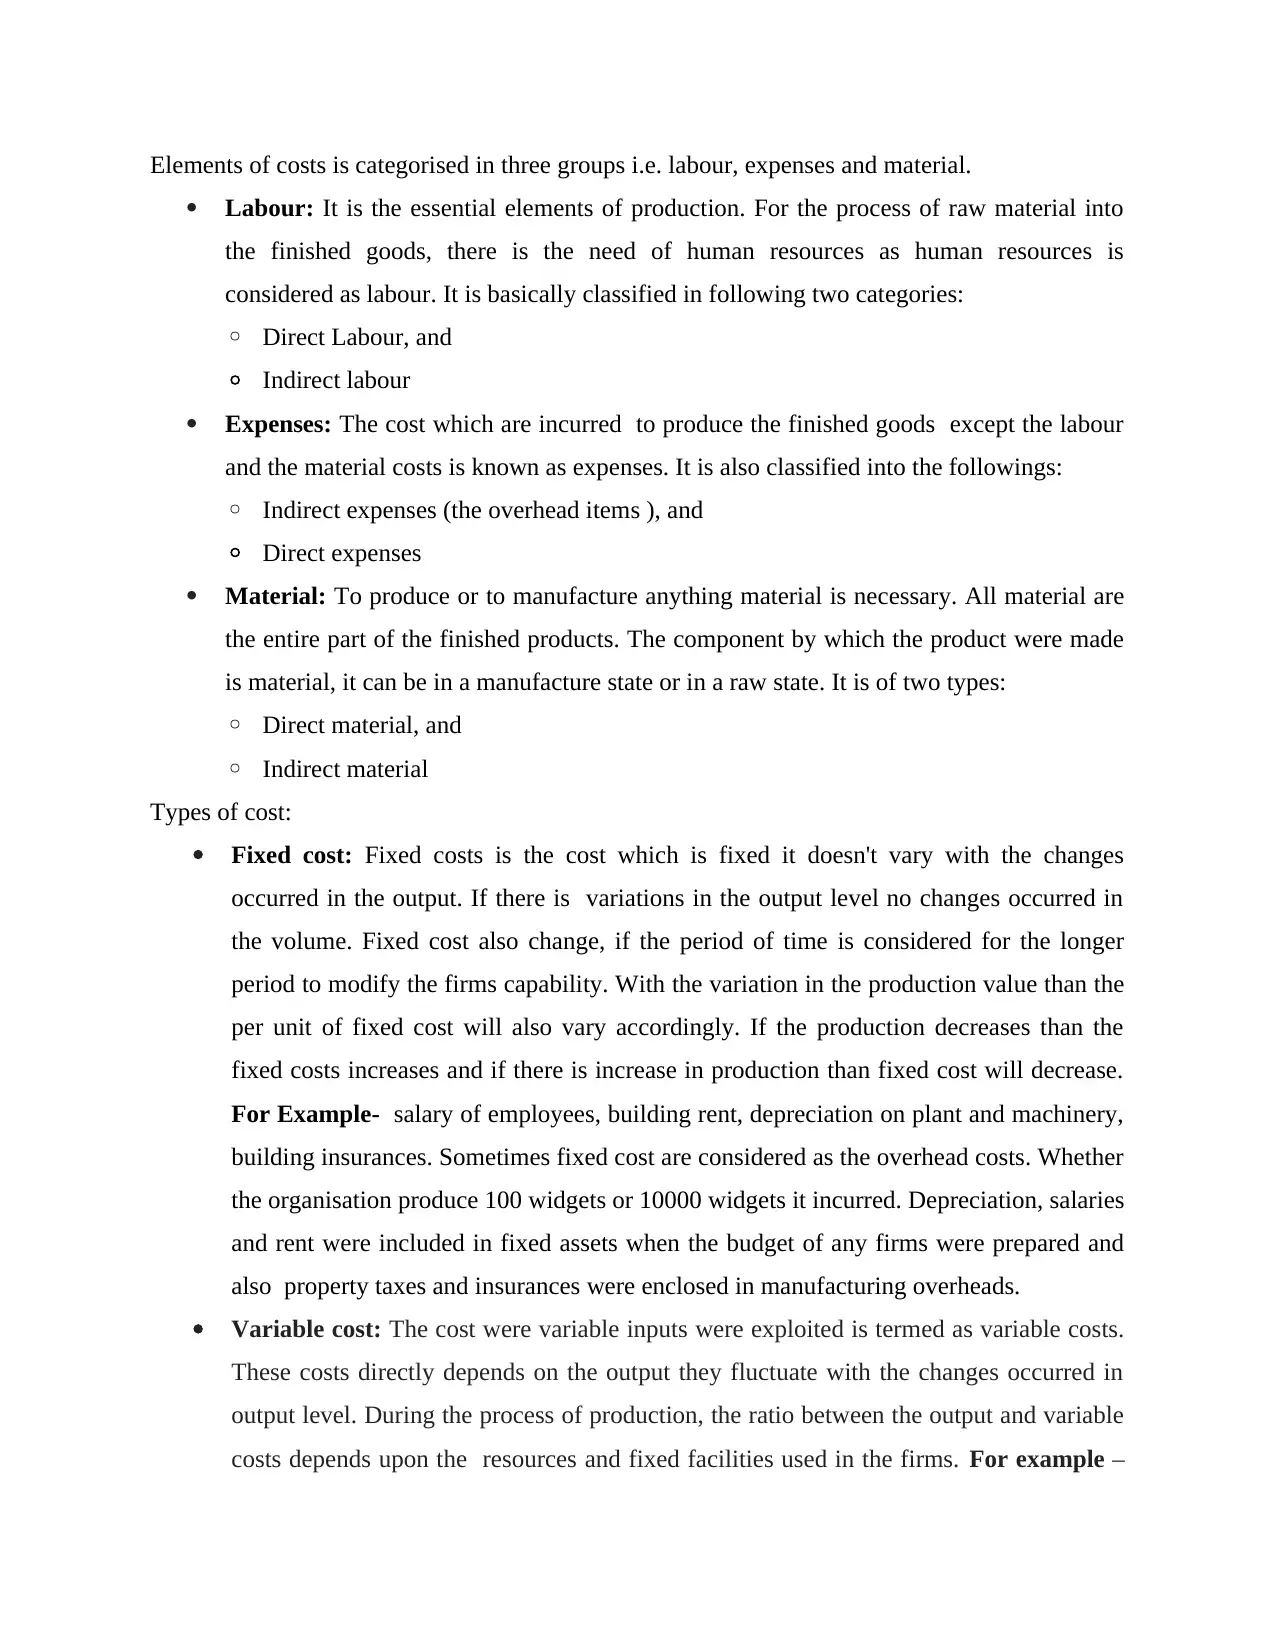
Elements of costs is categorised in three groups i.e. labour, expenses and material.
Labour: It is the essential elements of production. For the process of raw material into
the finished goods, there is the need of human resources as human resources is
considered as labour. It is basically classified in following two categories:
◦ Direct Labour, and
◦ Indirect labour
Expenses: The cost which are incurred to produce the finished goods except the labour
and the material costs is known as expenses. It is also classified into the followings:
◦ Indirect expenses (the overhead items ), and
◦ Direct expenses
Material: To produce or to manufacture anything material is necessary. All material are
the entire part of the finished products. The component by which the product were made
is material, it can be in a manufacture state or in a raw state. It is of two types:
◦ Direct material, and
◦ Indirect material
Types of cost:
Fixed cost: Fixed costs is the cost which is fixed it doesn't vary with the changes
occurred in the output. If there is variations in the output level no changes occurred in
the volume. Fixed cost also change, if the period of time is considered for the longer
period to modify the firms capability. With the variation in the production value than the
per unit of fixed cost will also vary accordingly. If the production decreases than the
fixed costs increases and if there is increase in production than fixed cost will decrease.
For Example- salary of employees, building rent, depreciation on plant and machinery,
building insurances. Sometimes fixed cost are considered as the overhead costs. Whether
the organisation produce 100 widgets or 10000 widgets it incurred. Depreciation, salaries
and rent were included in fixed assets when the budget of any firms were prepared and
also property taxes and insurances were enclosed in manufacturing overheads.
Variable cost: The cost were variable inputs were exploited is termed as variable costs.
These costs directly depends on the output they fluctuate with the changes occurred in
output level. During the process of production, the ratio between the output and variable
costs depends upon the resources and fixed facilities used in the firms. For example –
Paraphrase This Document
Need a fresh take? Get an instant paraphrase of this document with our AI Paraphraser
expenditure on labour, raw material cost, repair costs. Direct labour, direct material and
direct expense are also the examples of variable costs. Variable costs increases and
decreases according to the changes occurred in the volume of production. Let's take the
example of toys manufacturer - before shipping a toy manufacturer always packed the
product. It is considered as a variable costs, if the manufacturer manufacture more
products i.e. toys then the cost of packaging also increases. Yet if the manufacturer's
production level of toy decreases then the variable costs which is associated with the
packaging will also decrease. For an organisation variable cost is considered as the
financial impact when the services or products were delivered or produces.
Semi - variable cost: The costs which contains both the elements fixed costs as well as
the variable costs is known as semi- variable costs. Its is partially affected by the
variations occurred in the activity activity level. It is the cost , where some portion
remains fixed at the given production level and the other portion fluctuate with the
variations occurred in the mass of production but doesn't occurred in the same proportion
of the different production. For example - if the output of production is upto 50%,
expenses may not vary but if it may gain by 5% for all 20% gain in product over 50%
but up to 70%.
formula: By using the formula , semi- variable costs are separated into the variable costs
and fixed costs:
Semi- variable cost = Fixed cost + variable costs
Variable cost per unit = change in cost / change in output
2. Use of cost volume profit graph
Cost volume profit is a part of cost accounting and using for short run decision and
elementary instruction. Cost volume profit chart is a graphical representation of cost production
profit analysis. It is show relationship between produced volume units and produced cost units
like as fixed costs, total sales and total costs. After result management using this information for
calculate estimate budget and also for predict sales which is based on production schedules. If
projected sales are not met so manager using this graph for predict future losses. Through this
graph simply calculated break even analysis, target income sales. It also analysis of short run
investments in operational decisions. Role of CVP analysis is more in management accounting as
compared with financial accounting. With the help of this analysis, decision making process is
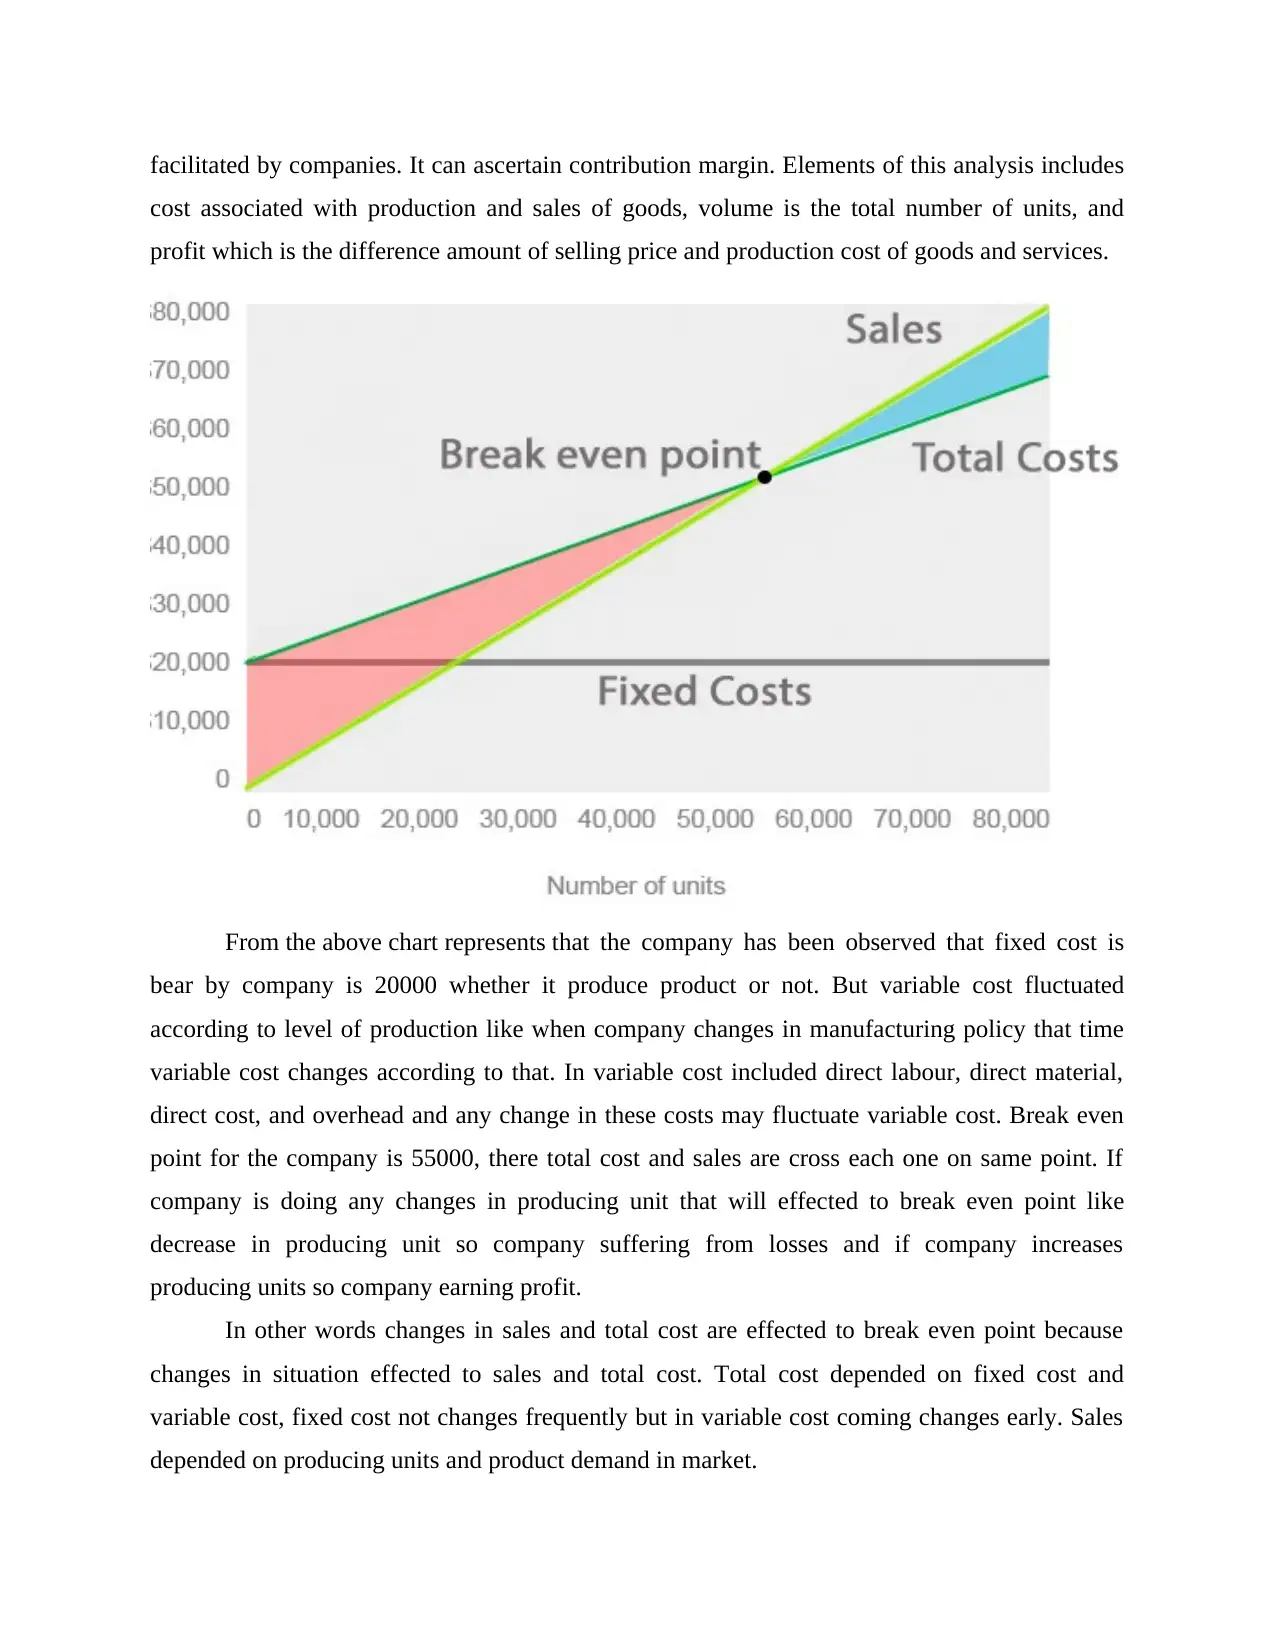
facilitated by companies. It can ascertain contribution margin. Elements of this analysis includes
cost associated with production and sales of goods, volume is the total number of units, and
profit which is the difference amount of selling price and production cost of goods and services.
From the above chart represents that the company has been observed that fixed cost is
bear by company is 20000 whether it produce product or not. But variable cost fluctuated
according to level of production like when company changes in manufacturing policy that time
variable cost changes according to that. In variable cost included direct labour, direct material,
direct cost, and overhead and any change in these costs may fluctuate variable cost. Break even
point for the company is 55000, there total cost and sales are cross each one on same point. If
company is doing any changes in producing unit that will effected to break even point like
decrease in producing unit so company suffering from losses and if company increases
producing units so company earning profit.
In other words changes in sales and total cost are effected to break even point because
changes in situation effected to sales and total cost. Total cost depended on fixed cost and
variable cost, fixed cost not changes frequently but in variable cost coming changes early. Sales
depended on producing units and product demand in market.
⊘ This is a preview!⊘
Do you want full access?
Subscribe today to unlock all pages.
Trusted by 1+ million students worldwide
TASK 1 B
1. Break even point in unit and pound sterling
Break even analysis: A company can determine its position with the help of this
financial instrument, will be gainful. In other words, it's a financial calculation for know the
number of products or services a company should sell to cover it's costs (particularly fixed cost).
Break even is that point where you not making profit or not making loss because it's a mid point
of profit and loss and it have been covered all costs. It is useful for studying the relation between
the fixed cost, variable cost and revenues. In general way if company have low fixed costs so
they have low break even point of sale. Key features to understand break even analysis are as
follows -
The break even analysis is not favorite analysis because frequently mistaken for payback
period, it takes time to recover an investment. Some peoples think they have wrong
because there are many variations on break even. So every one mostly use common
method but it is not possible.
It relies on fixed costs, because fixed costs continue to incur even if a company is having
zero production and sales. So, break even analysis provides a better view of spending on
variable costs.
In Beta Company break even analysis is used by the managers to evaluate the level when
company can absorb its costs from the sale of products.
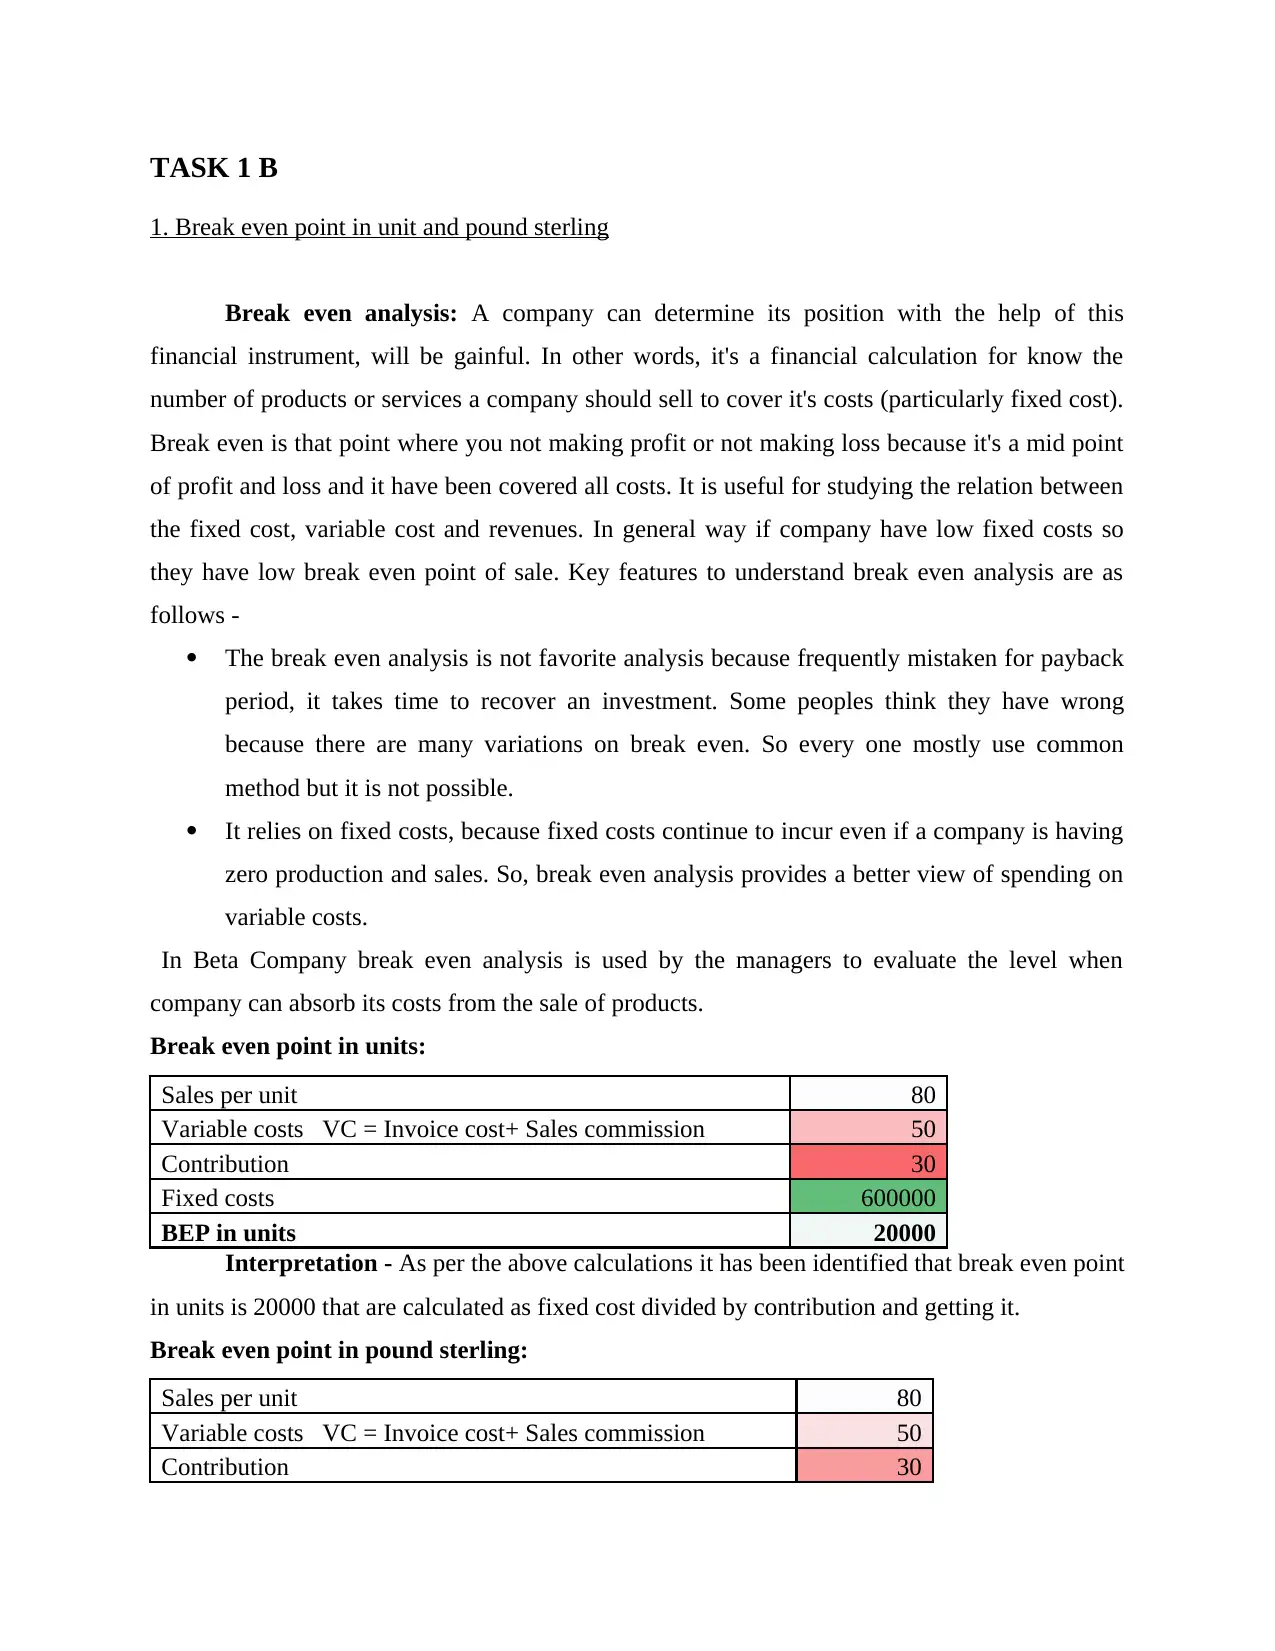
Break even point in units:
Sales per unit 80
Variable costs VC = Invoice cost+ Sales commission 50
Contribution 30
Fixed costs 600000
BEP in units 20000
Interpretation - As per the above calculations it has been identified that break even point
in units is 20000 that are calculated as fixed cost divided by contribution and getting it.
Break even point in pound sterling:
Sales per unit 80
Variable costs VC = Invoice cost+ Sales commission 50
Contribution 30
1. Break even point in unit and pound sterling
Break even analysis: A company can determine its position with the help of this
financial instrument, will be gainful. In other words, it's a financial calculation for know the
number of products or services a company should sell to cover it's costs (particularly fixed cost).
Break even is that point where you not making profit or not making loss because it's a mid point
of profit and loss and it have been covered all costs. It is useful for studying the relation between
the fixed cost, variable cost and revenues. In general way if company have low fixed costs so
they have low break even point of sale. Key features to understand break even analysis are as
follows -
The break even analysis is not favorite analysis because frequently mistaken for payback
period, it takes time to recover an investment. Some peoples think they have wrong
because there are many variations on break even. So every one mostly use common
method but it is not possible.
It relies on fixed costs, because fixed costs continue to incur even if a company is having
zero production and sales. So, break even analysis provides a better view of spending on
variable costs.
In Beta Company break even analysis is used by the managers to evaluate the level when
company can absorb its costs from the sale of products.
Break even point in units:
Sales per unit 80
Variable costs VC = Invoice cost+ Sales commission 50
Contribution 30
Fixed costs 600000
BEP in units 20000
Interpretation - As per the above calculations it has been identified that break even point
in units is 20000 that are calculated as fixed cost divided by contribution and getting it.
Break even point in pound sterling:
Sales per unit 80
Variable costs VC = Invoice cost+ Sales commission 50
Contribution 30
Paraphrase This Document
Need a fresh take? Get an instant paraphrase of this document with our AI Paraphraser
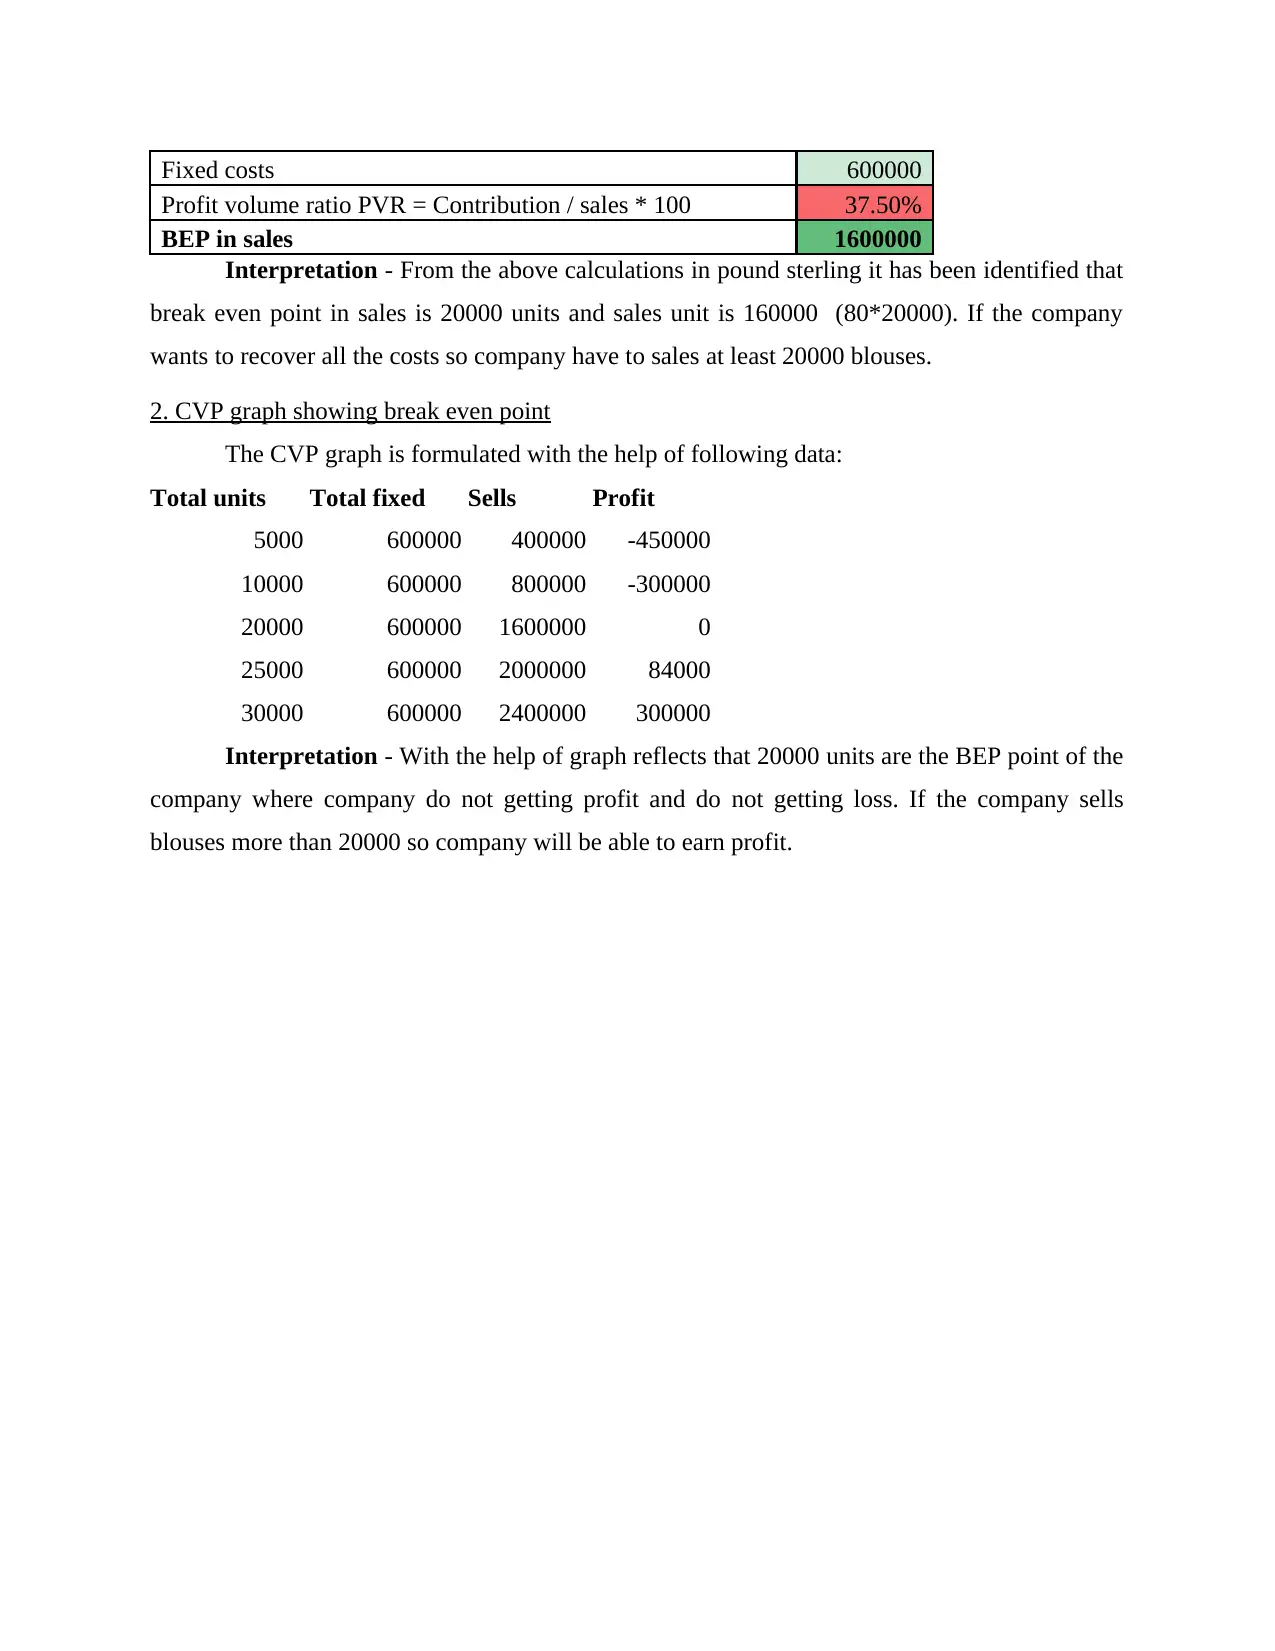
Fixed costs 600000
Profit volume ratio PVR = Contribution / sales * 100 37.50%
BEP in sales 1600000
Interpretation - From the above calculations in pound sterling it has been identified that
break even point in sales is 20000 units and sales unit is 160000 (80*20000). If the company
wants to recover all the costs so company have to sales at least 20000 blouses.
2. CVP graph showing break even point
The CVP graph is formulated with the help of following data:
Total units Total fixed Sells Profit
5000 600000 400000 -450000
10000 600000 800000 -300000
20000 600000 1600000 0
25000 600000 2000000 84000
30000 600000 2400000 300000
Interpretation - With the help of graph reflects that 20000 units are the BEP point of the
company where company do not getting profit and do not getting loss. If the company sells
blouses more than 20000 so company will be able to earn profit.
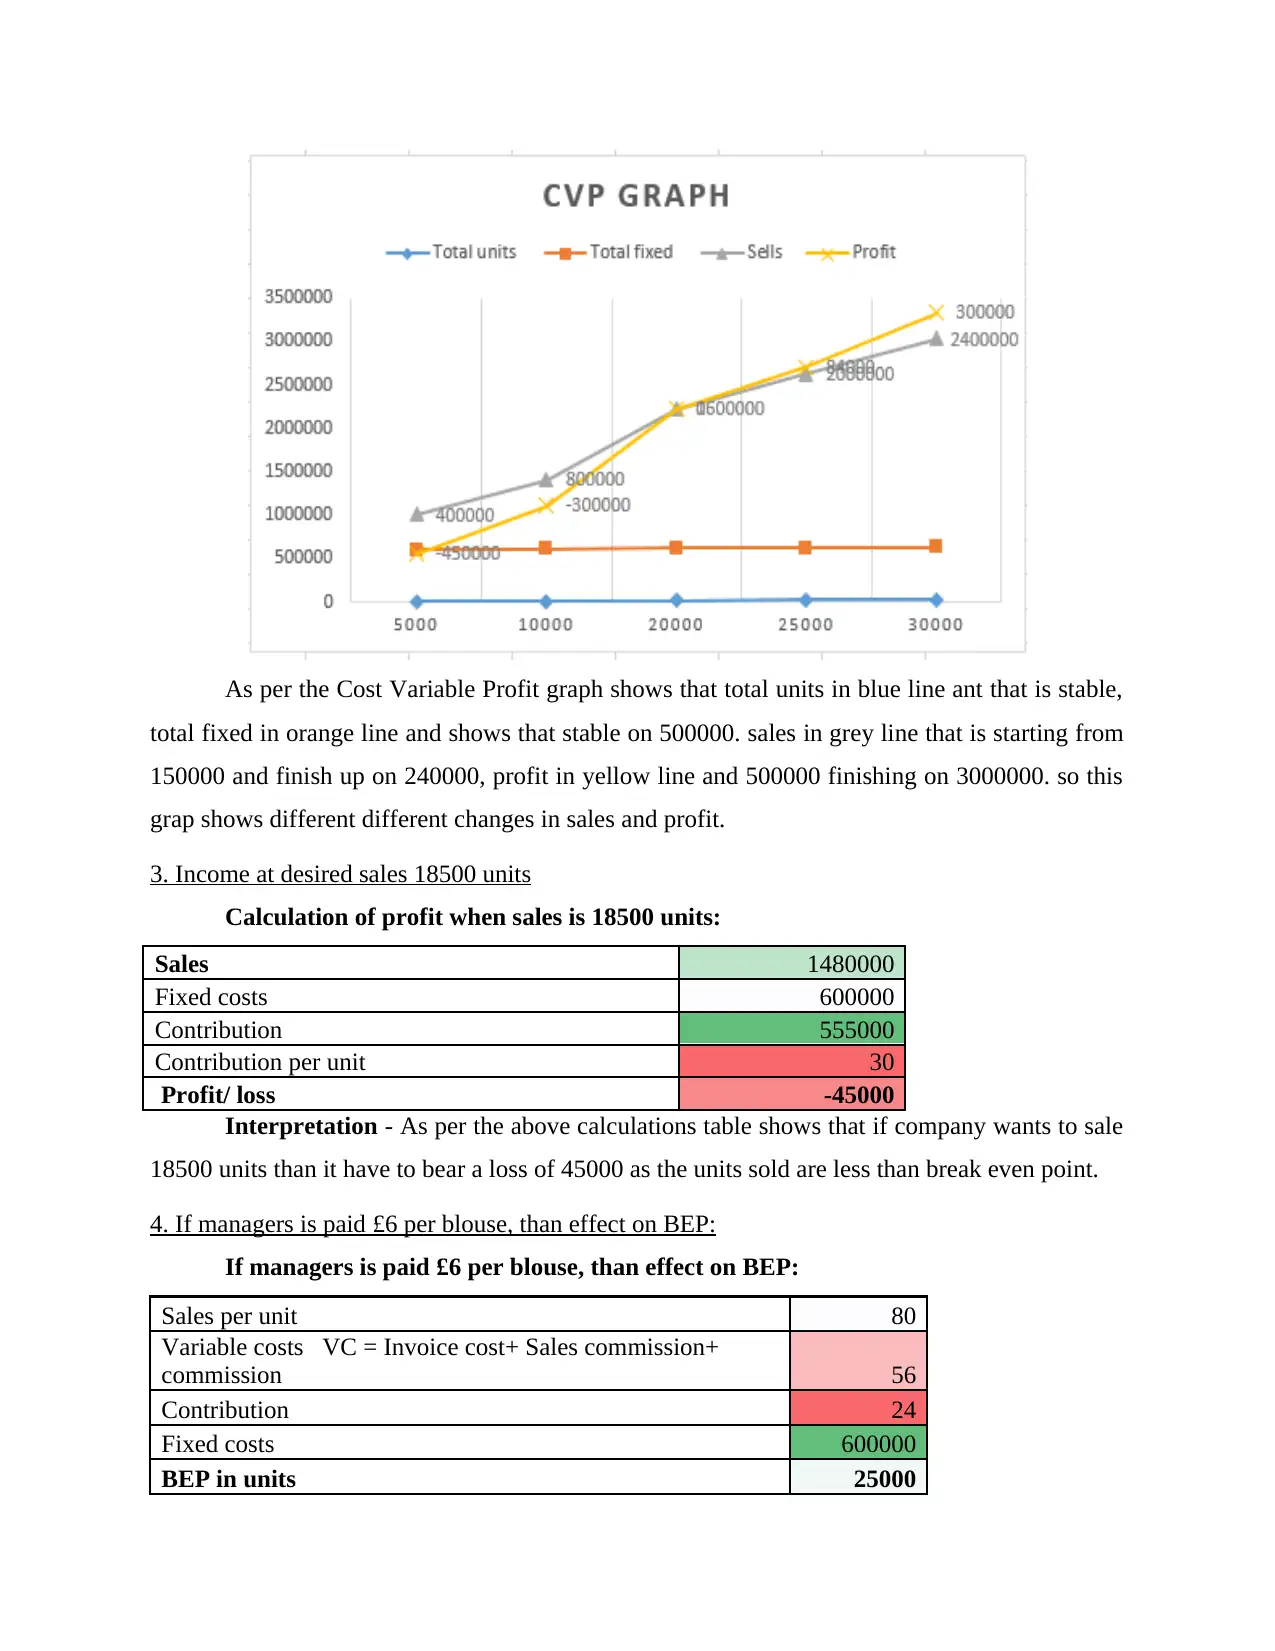
As per the Cost Variable Profit graph shows that total units in blue line ant that is stable,
total fixed in orange line and shows that stable on 500000. sales in grey line that is starting from
150000 and finish up on 240000, profit in yellow line and 500000 finishing on 3000000. so this
grap shows different different changes in sales and profit.
3. Income at desired sales 18500 units
Calculation of profit when sales is 18500 units:
Sales 1480000
Fixed costs 600000
Contribution 555000
Contribution per unit 30
Profit/ loss -45000
Interpretation - As per the above calculations table shows that if company wants to sale
18500 units than it have to bear a loss of 45000 as the units sold are less than break even point.
4. If managers is paid £6 per blouse, than effect on BEP:
If managers is paid £6 per blouse, than effect on BEP:
Sales per unit 80
Variable costs VC = Invoice cost+ Sales commission+
commission 56
Contribution 24
Fixed costs 600000
BEP in units 25000
⊘ This is a preview!⊘
Do you want full access?
Subscribe today to unlock all pages.
Trusted by 1+ million students worldwide
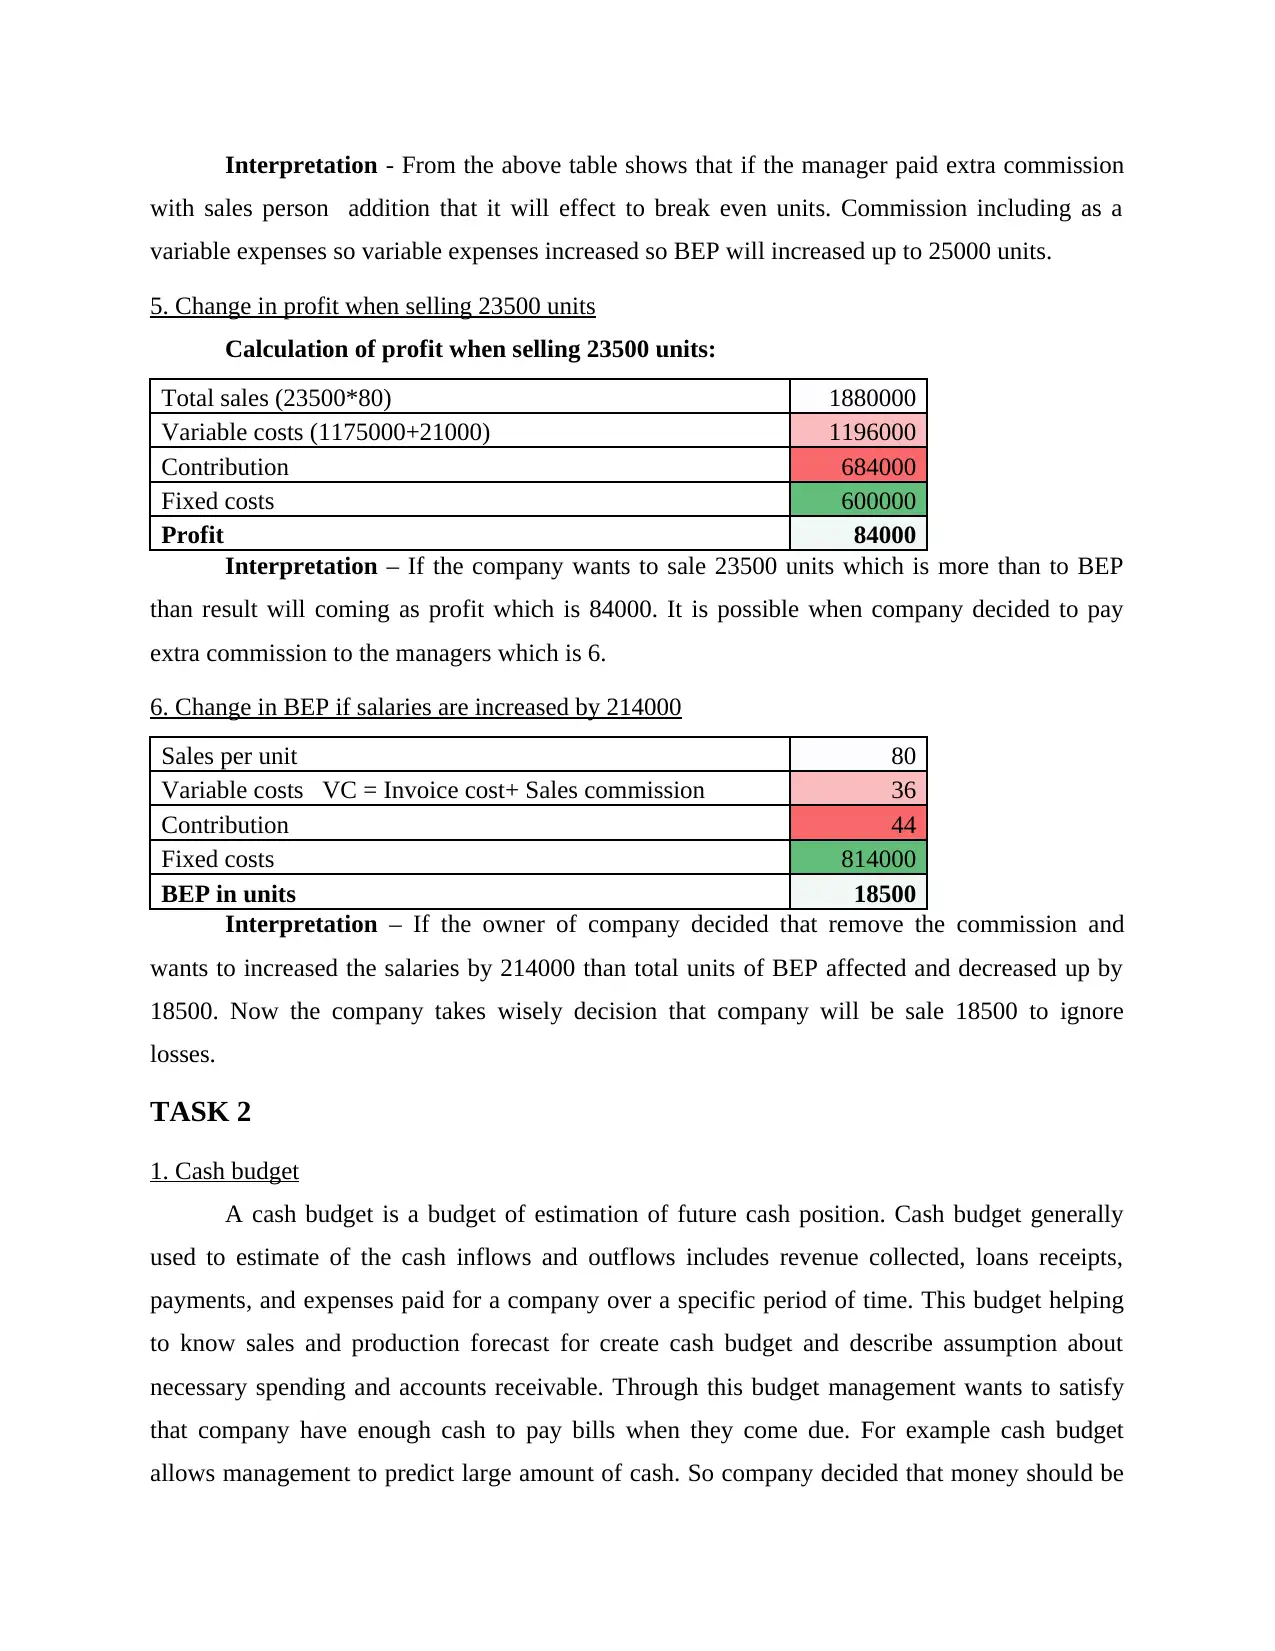
Interpretation - From the above table shows that if the manager paid extra commission
with sales person addition that it will effect to break even units. Commission including as a
variable expenses so variable expenses increased so BEP will increased up to 25000 units.
5. Change in profit when selling 23500 units
Calculation of profit when selling 23500 units:
Total sales (23500*80) 1880000
Variable costs (1175000+21000) 1196000
Contribution 684000
Fixed costs 600000
Profit 84000
Interpretation – If the company wants to sale 23500 units which is more than to BEP
than result will coming as profit which is 84000. It is possible when company decided to pay
extra commission to the managers which is 6.
6. Change in BEP if salaries are increased by 214000
Sales per unit 80
Variable costs VC = Invoice cost+ Sales commission 36
Contribution 44
Fixed costs 814000
BEP in units 18500
Interpretation – If the owner of company decided that remove the commission and
wants to increased the salaries by 214000 than total units of BEP affected and decreased up by
18500. Now the company takes wisely decision that company will be sale 18500 to ignore
losses.
TASK 2
1. Cash budget
A cash budget is a budget of estimation of future cash position. Cash budget generally
used to estimate of the cash inflows and outflows includes revenue collected, loans receipts,
payments, and expenses paid for a company over a specific period of time. This budget helping
to know sales and production forecast for create cash budget and describe assumption about
necessary spending and accounts receivable. Through this budget management wants to satisfy
that company have enough cash to pay bills when they come due. For example cash budget
allows management to predict large amount of cash. So company decided that money should be
Paraphrase This Document
Need a fresh take? Get an instant paraphrase of this document with our AI Paraphraser
invested to earn interest on this amount. Excess cash better used to expand and develop new
operations for company accounts. After that management predict to cash levels of the company.
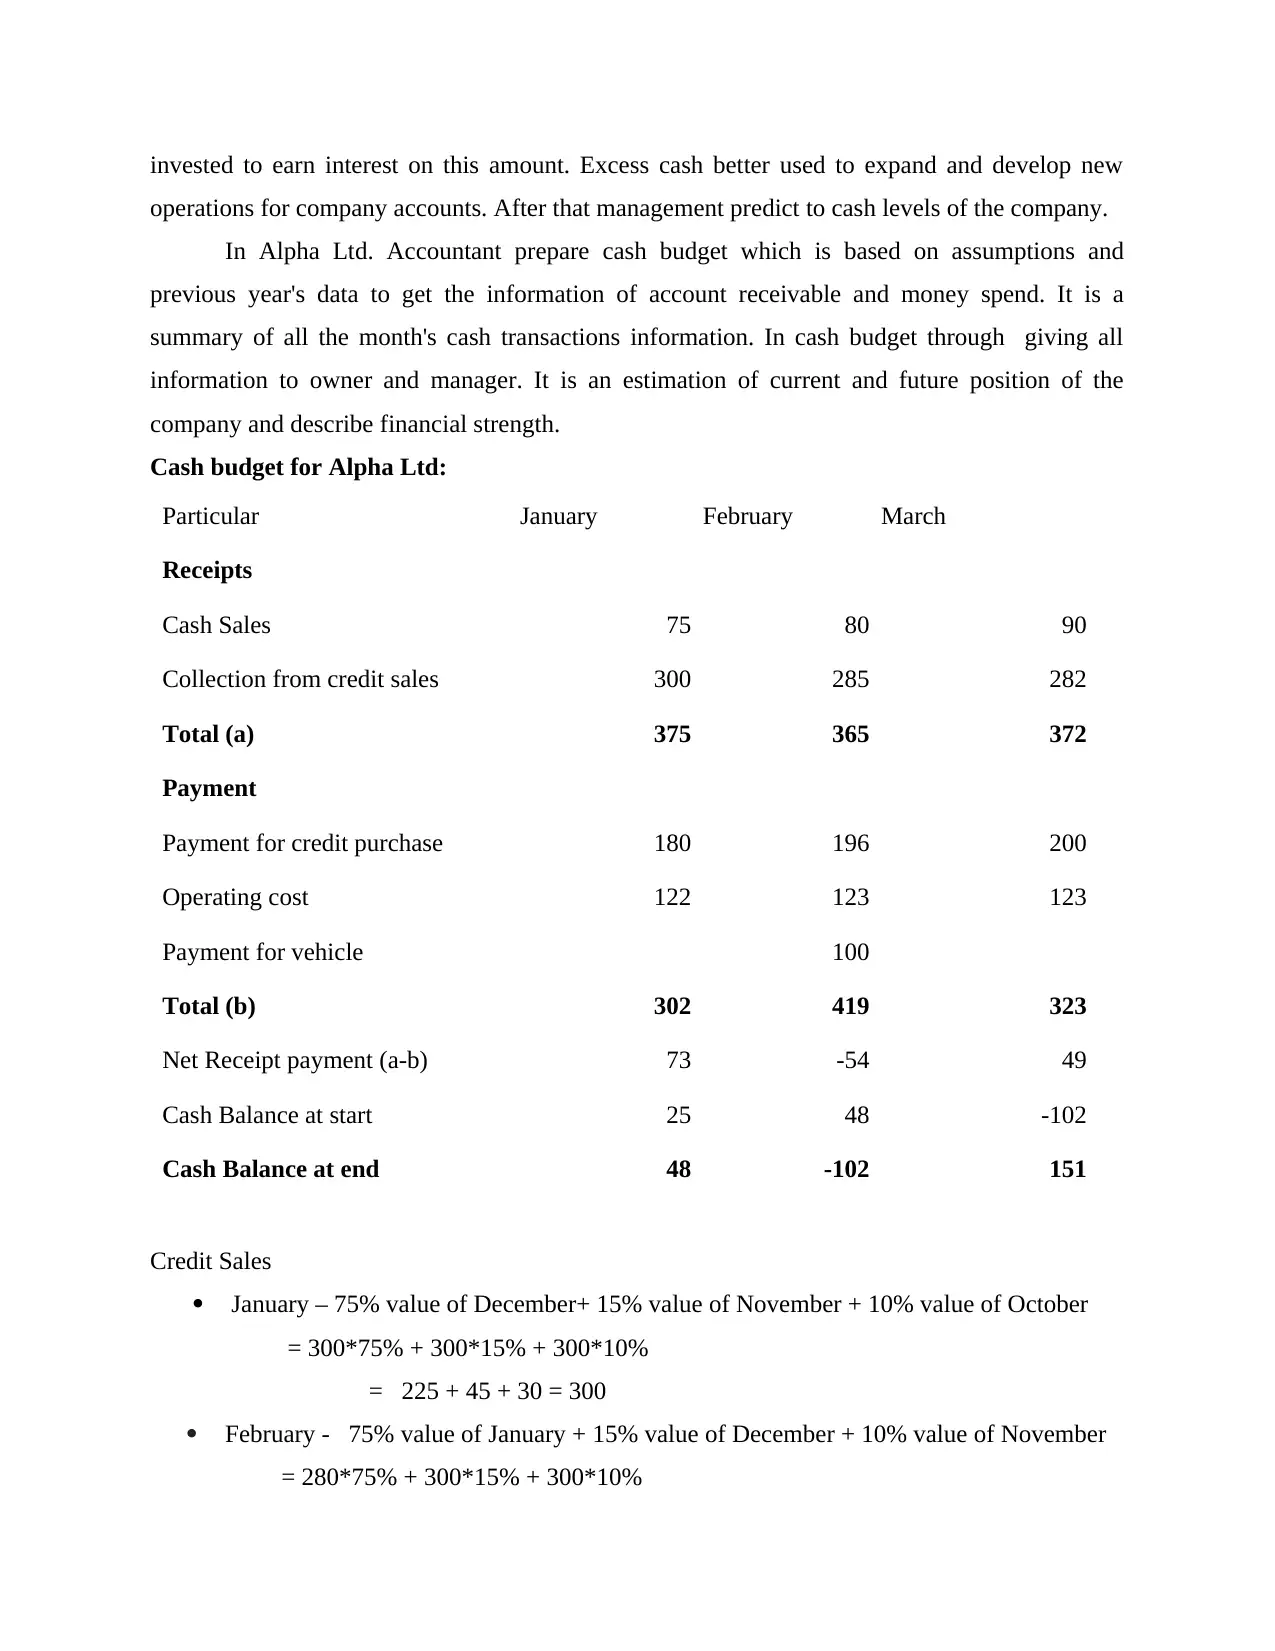
In Alpha Ltd. Accountant prepare cash budget which is based on assumptions and
previous year's data to get the information of account receivable and money spend. It is a
summary of all the month's cash transactions information. In cash budget through giving all
information to owner and manager. It is an estimation of current and future position of the
company and describe financial strength.
Cash budget for Alpha Ltd:
Particular January February March
Receipts
Cash Sales 75 80 90
Collection from credit sales 300 285 282
Total (a) 375 365 372
Payment
Payment for credit purchase 180 196 200
Operating cost 122 123 123
Payment for vehicle 100
Total (b) 302 419 323
Net Receipt payment (a-b) 73 -54 49
Cash Balance at start 25 48 -102
Cash Balance at end 48 -102 151
Credit Sales
January – 75% value of December+ 15% value of November + 10% value of October
= 300*75% + 300*15% + 300*10%
= 225 + 45 + 30 = 300
February - 75% value of January + 15% value of December + 10% value of November
= 280*75% + 300*15% + 300*10%
operations for company accounts. After that management predict to cash levels of the company.
In Alpha Ltd. Accountant prepare cash budget which is based on assumptions and
previous year's data to get the information of account receivable and money spend. It is a
summary of all the month's cash transactions information. In cash budget through giving all
information to owner and manager. It is an estimation of current and future position of the
company and describe financial strength.
Cash budget for Alpha Ltd:
Particular January February March
Receipts
Cash Sales 75 80 90
Collection from credit sales 300 285 282
Total (a) 375 365 372
Payment
Payment for credit purchase 180 196 200
Operating cost 122 123 123
Payment for vehicle 100
Total (b) 302 419 323
Net Receipt payment (a-b) 73 -54 49
Cash Balance at start 25 48 -102
Cash Balance at end 48 -102 151
Credit Sales
January – 75% value of December+ 15% value of November + 10% value of October
= 300*75% + 300*15% + 300*10%
= 225 + 45 + 30 = 300
February - 75% value of January + 15% value of December + 10% value of November
= 280*75% + 300*15% + 300*10%
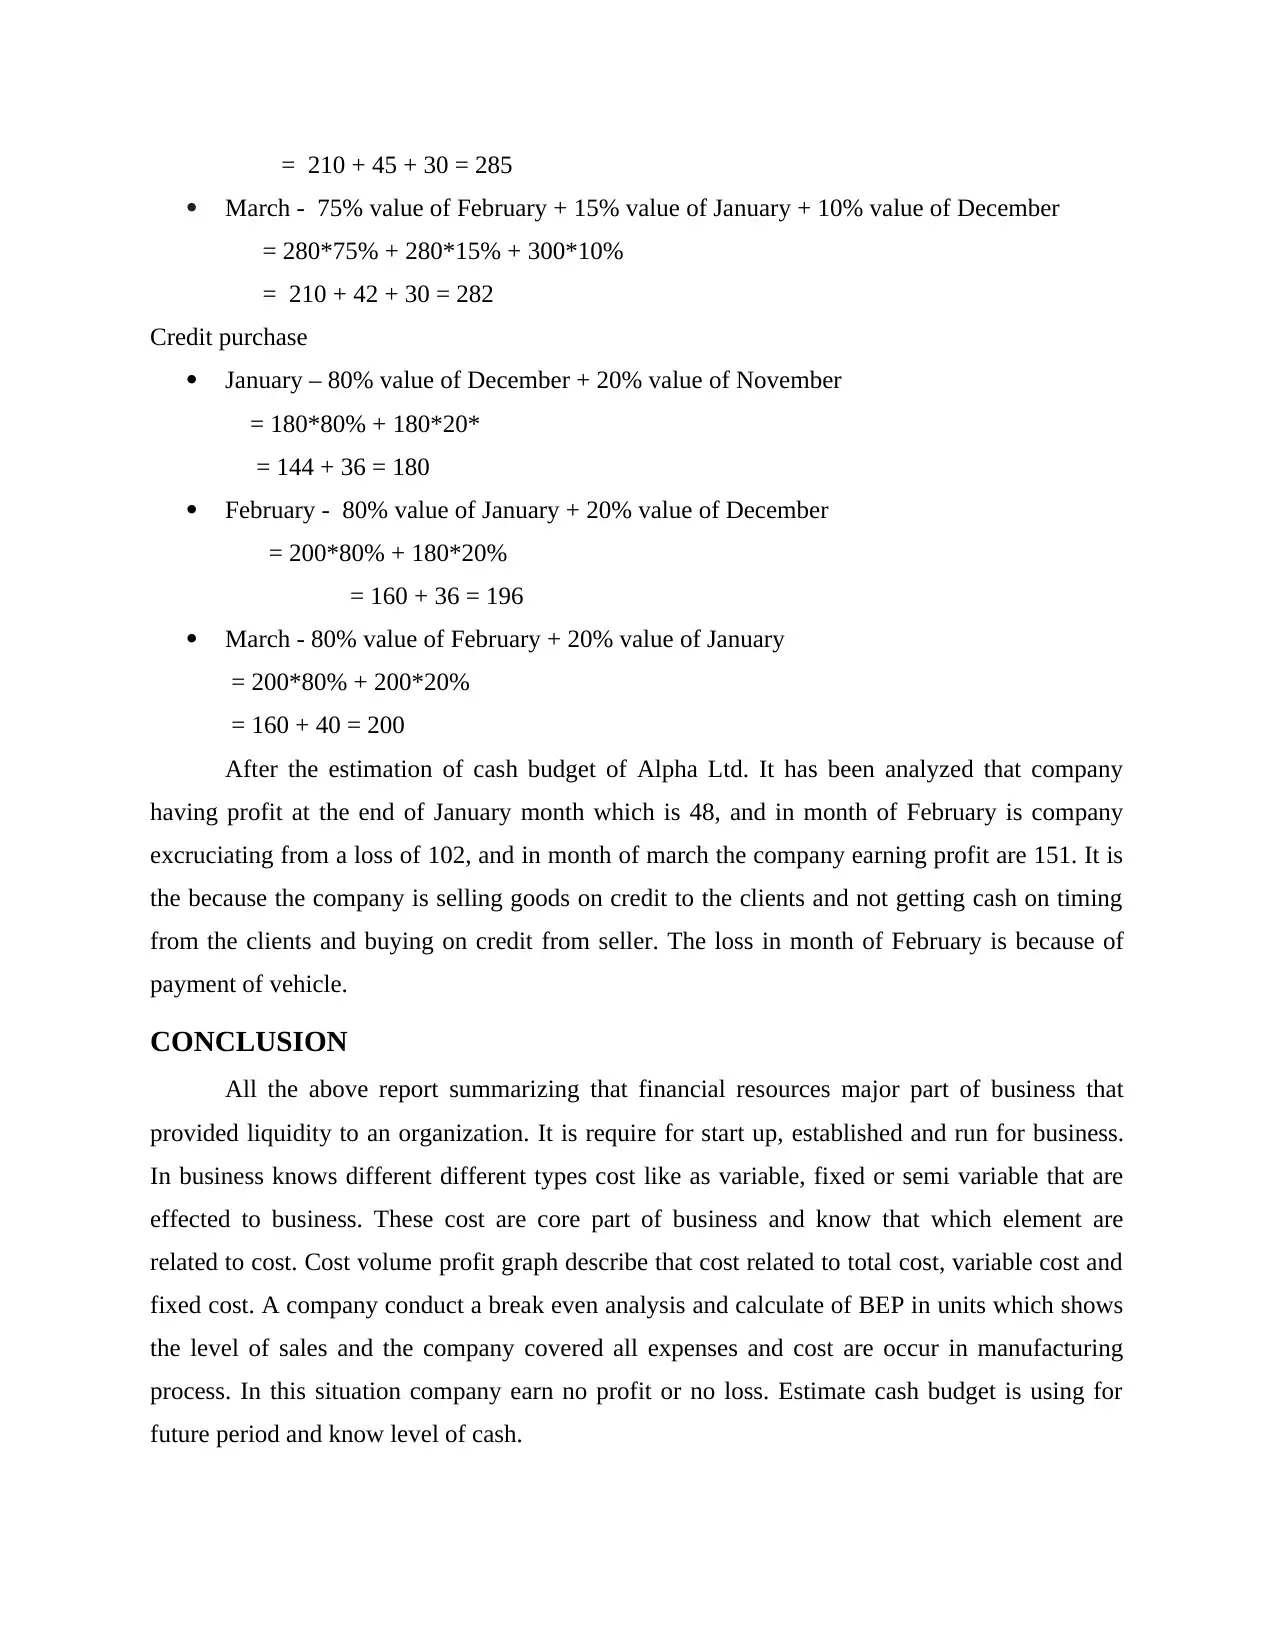
= 210 + 45 + 30 = 285
March - 75% value of February + 15% value of January + 10% value of December
= 280*75% + 280*15% + 300*10%
= 210 + 42 + 30 = 282
Credit purchase
January – 80% value of December + 20% value of November
= 180*80% + 180*20*
= 144 + 36 = 180
February - 80% value of January + 20% value of December
= 200*80% + 180*20%
= 160 + 36 = 196
March - 80% value of February + 20% value of January
= 200*80% + 200*20%
= 160 + 40 = 200
After the estimation of cash budget of Alpha Ltd. It has been analyzed that company
having profit at the end of January month which is 48, and in month of February is company
excruciating from a loss of 102, and in month of march the company earning profit are 151. It is
the because the company is selling goods on credit to the clients and not getting cash on timing
from the clients and buying on credit from seller. The loss in month of February is because of
payment of vehicle.
CONCLUSION
All the above report summarizing that financial resources major part of business that
provided liquidity to an organization. It is require for start up, established and run for business.
In business knows different different types cost like as variable, fixed or semi variable that are
effected to business. These cost are core part of business and know that which element are
related to cost. Cost volume profit graph describe that cost related to total cost, variable cost and
fixed cost. A company conduct a break even analysis and calculate of BEP in units which shows
the level of sales and the company covered all expenses and cost are occur in manufacturing
process. In this situation company earn no profit or no loss. Estimate cash budget is using for
future period and know level of cash.
⊘ This is a preview!⊘
Do you want full access?
Subscribe today to unlock all pages.
Trusted by 1+ million students worldwide
1 out of 13
Related Documents


Your All-in-One AI-Powered Toolkit for Academic Success.
+13062052269
info@desklib.com
Available 24*7 on WhatsApp / Email
![[object Object]](/_next/static/media/star-bottom.7253800d.svg)
Unlock your academic potential
Copyright © 2020–2026 A2Z Services. All Rights Reserved. Developed and managed by ZUCOL.