Fortune Trading Financial Performance: Resource Management Report

Verified

Added on  2023/06/10

|8
|1212
|386
Report
AI Summary
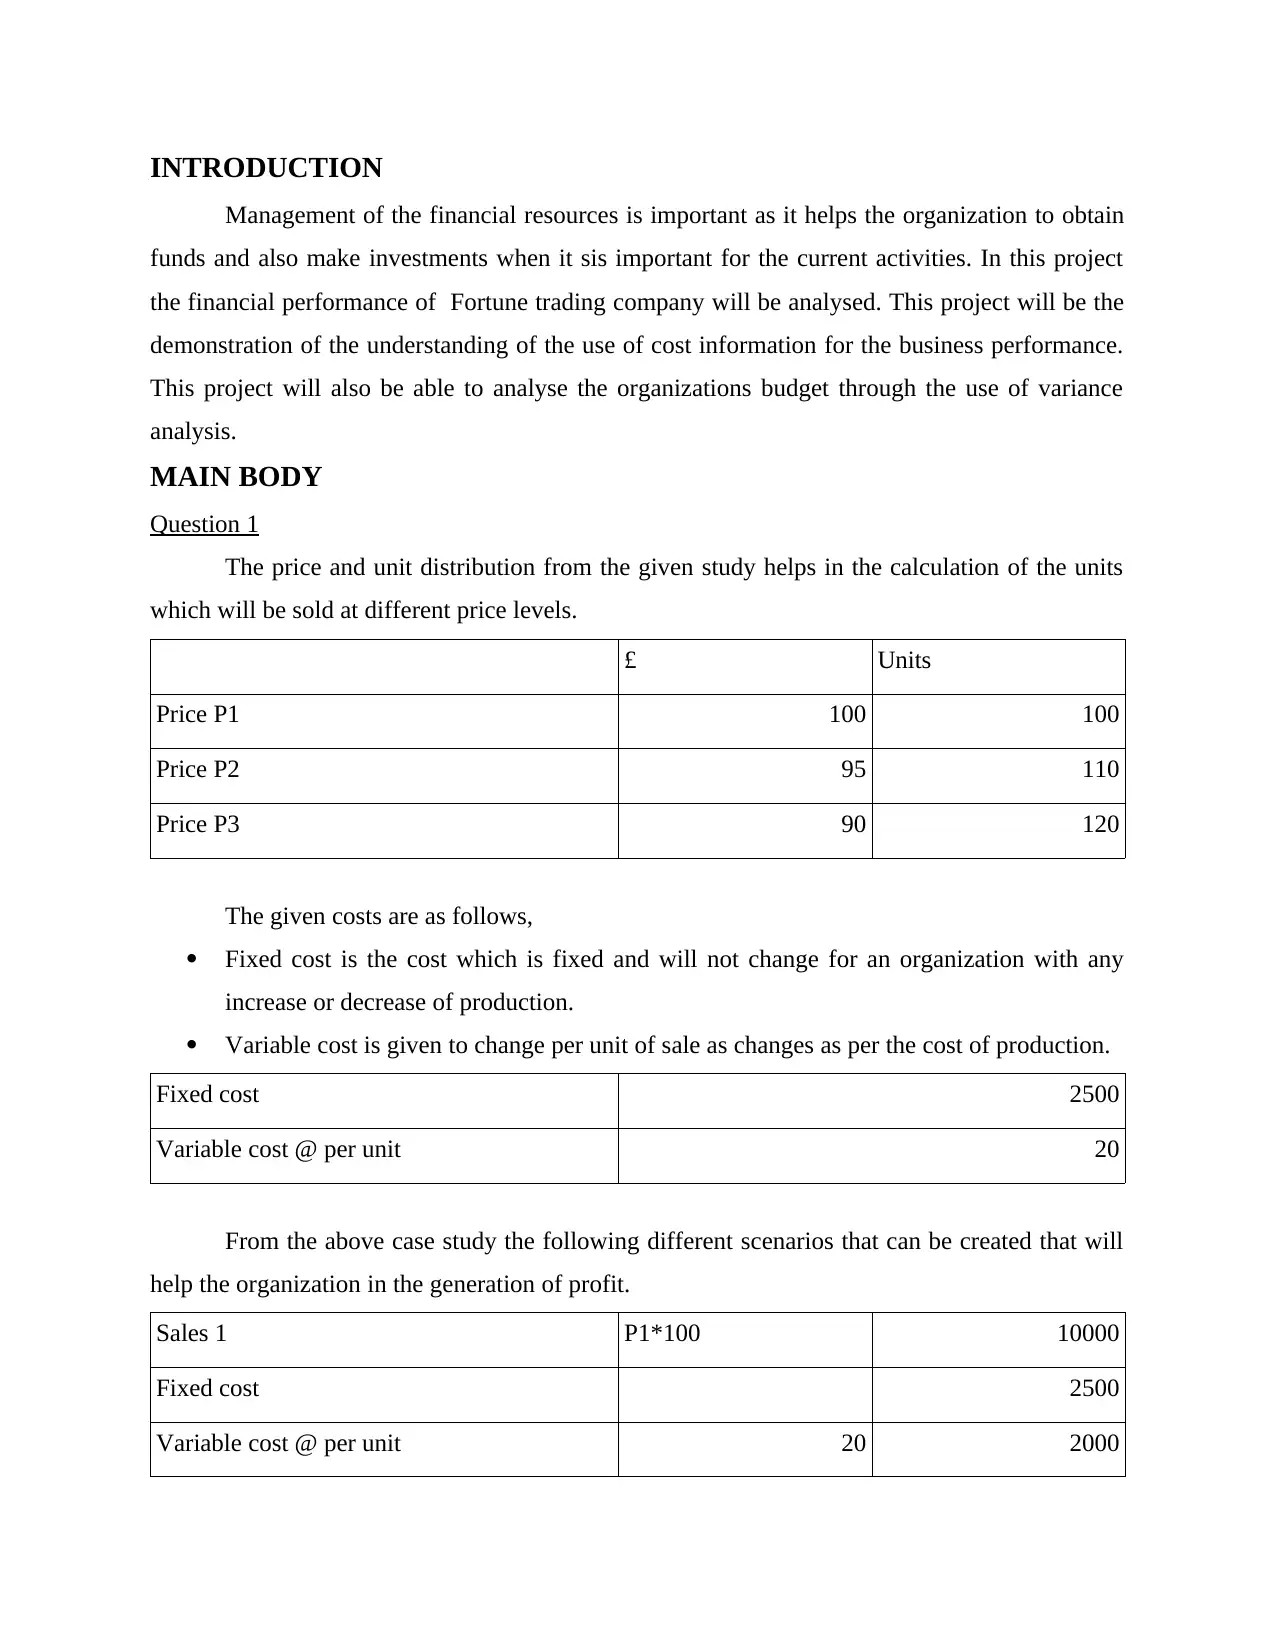
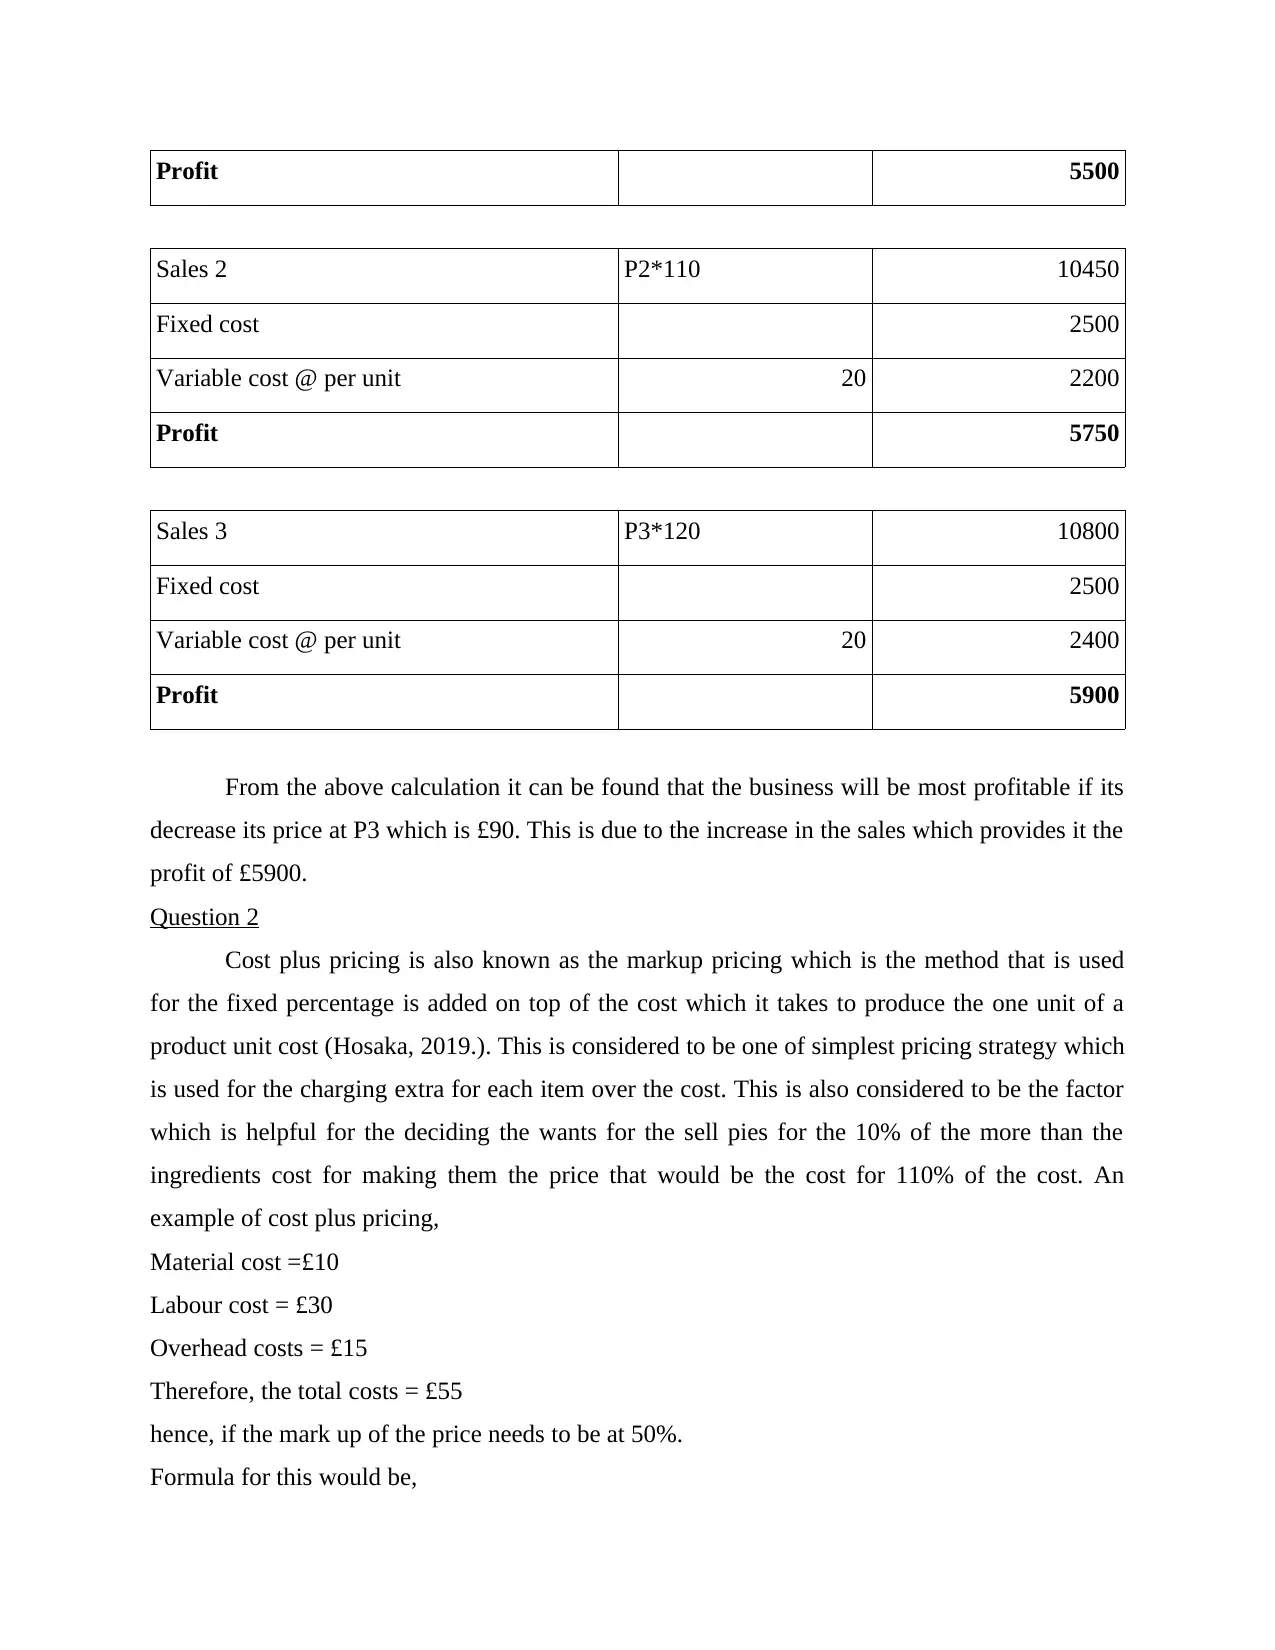
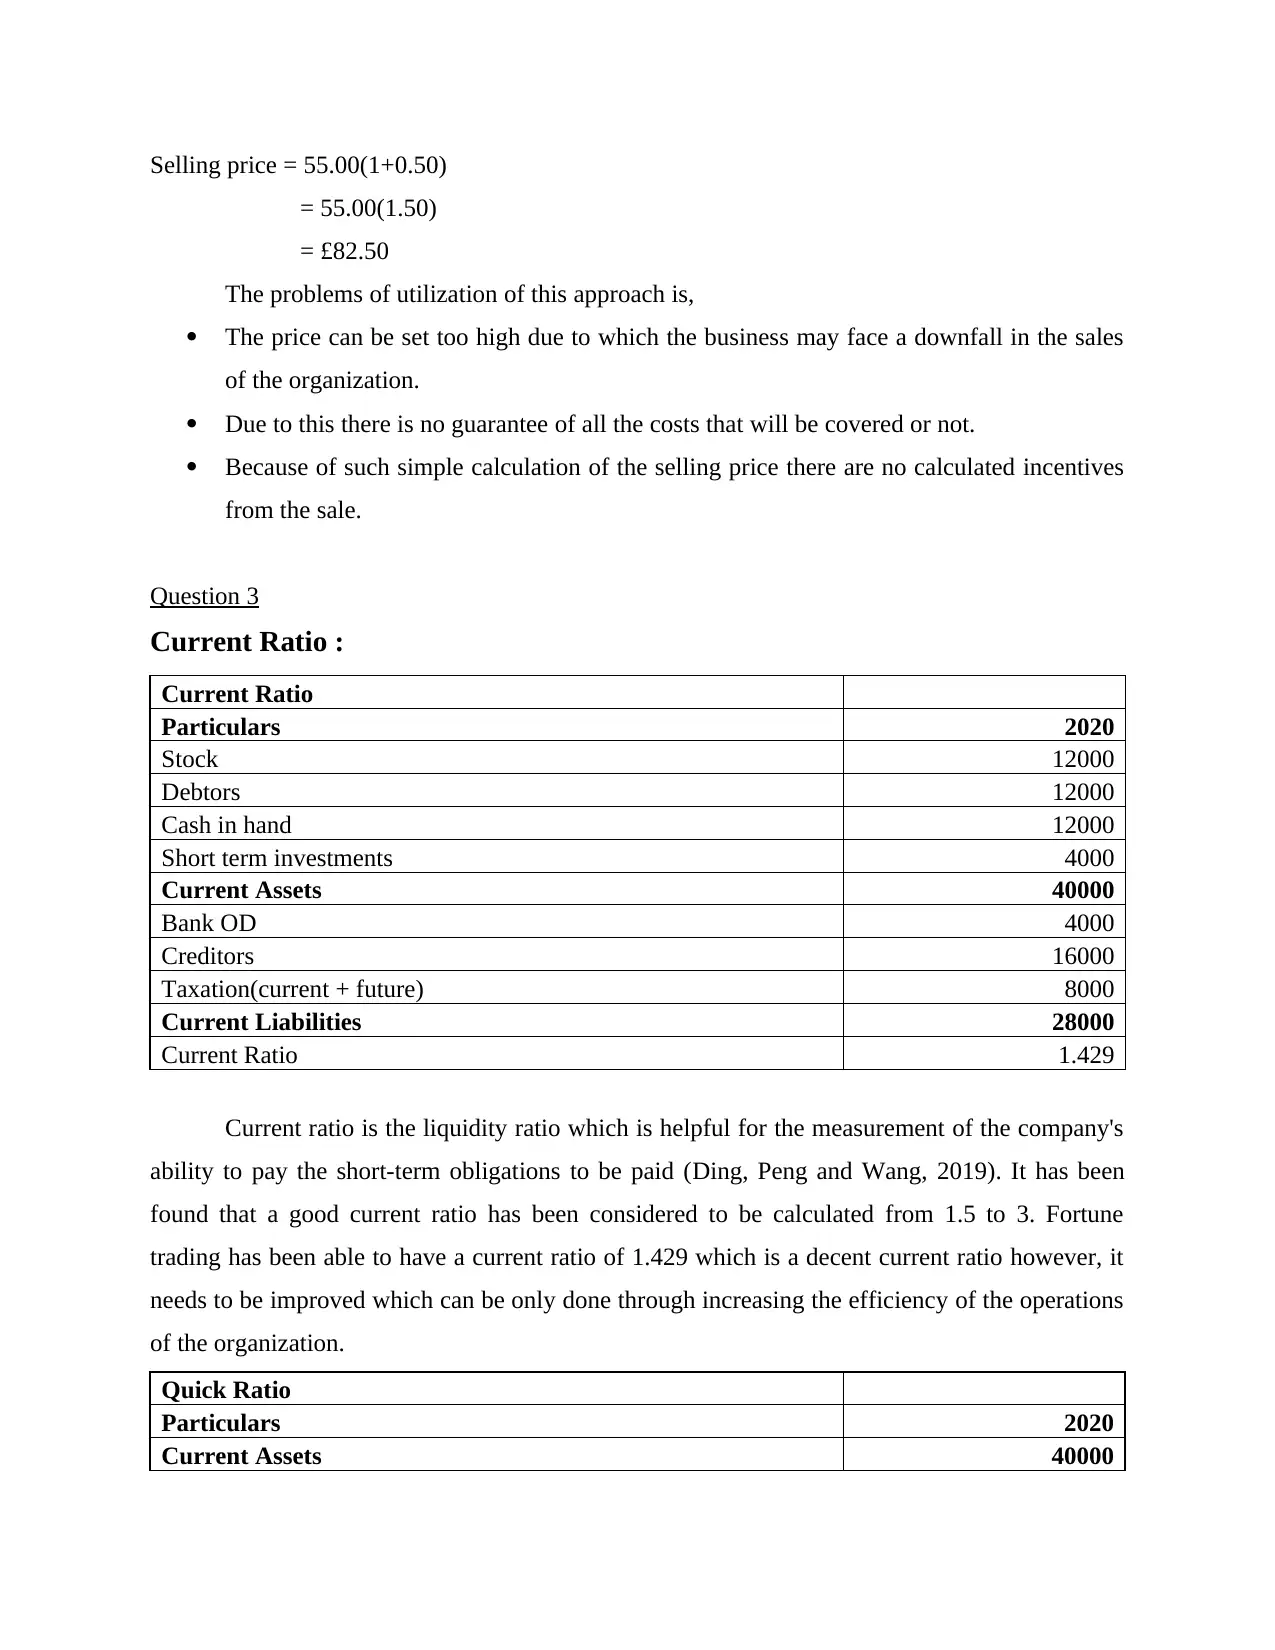
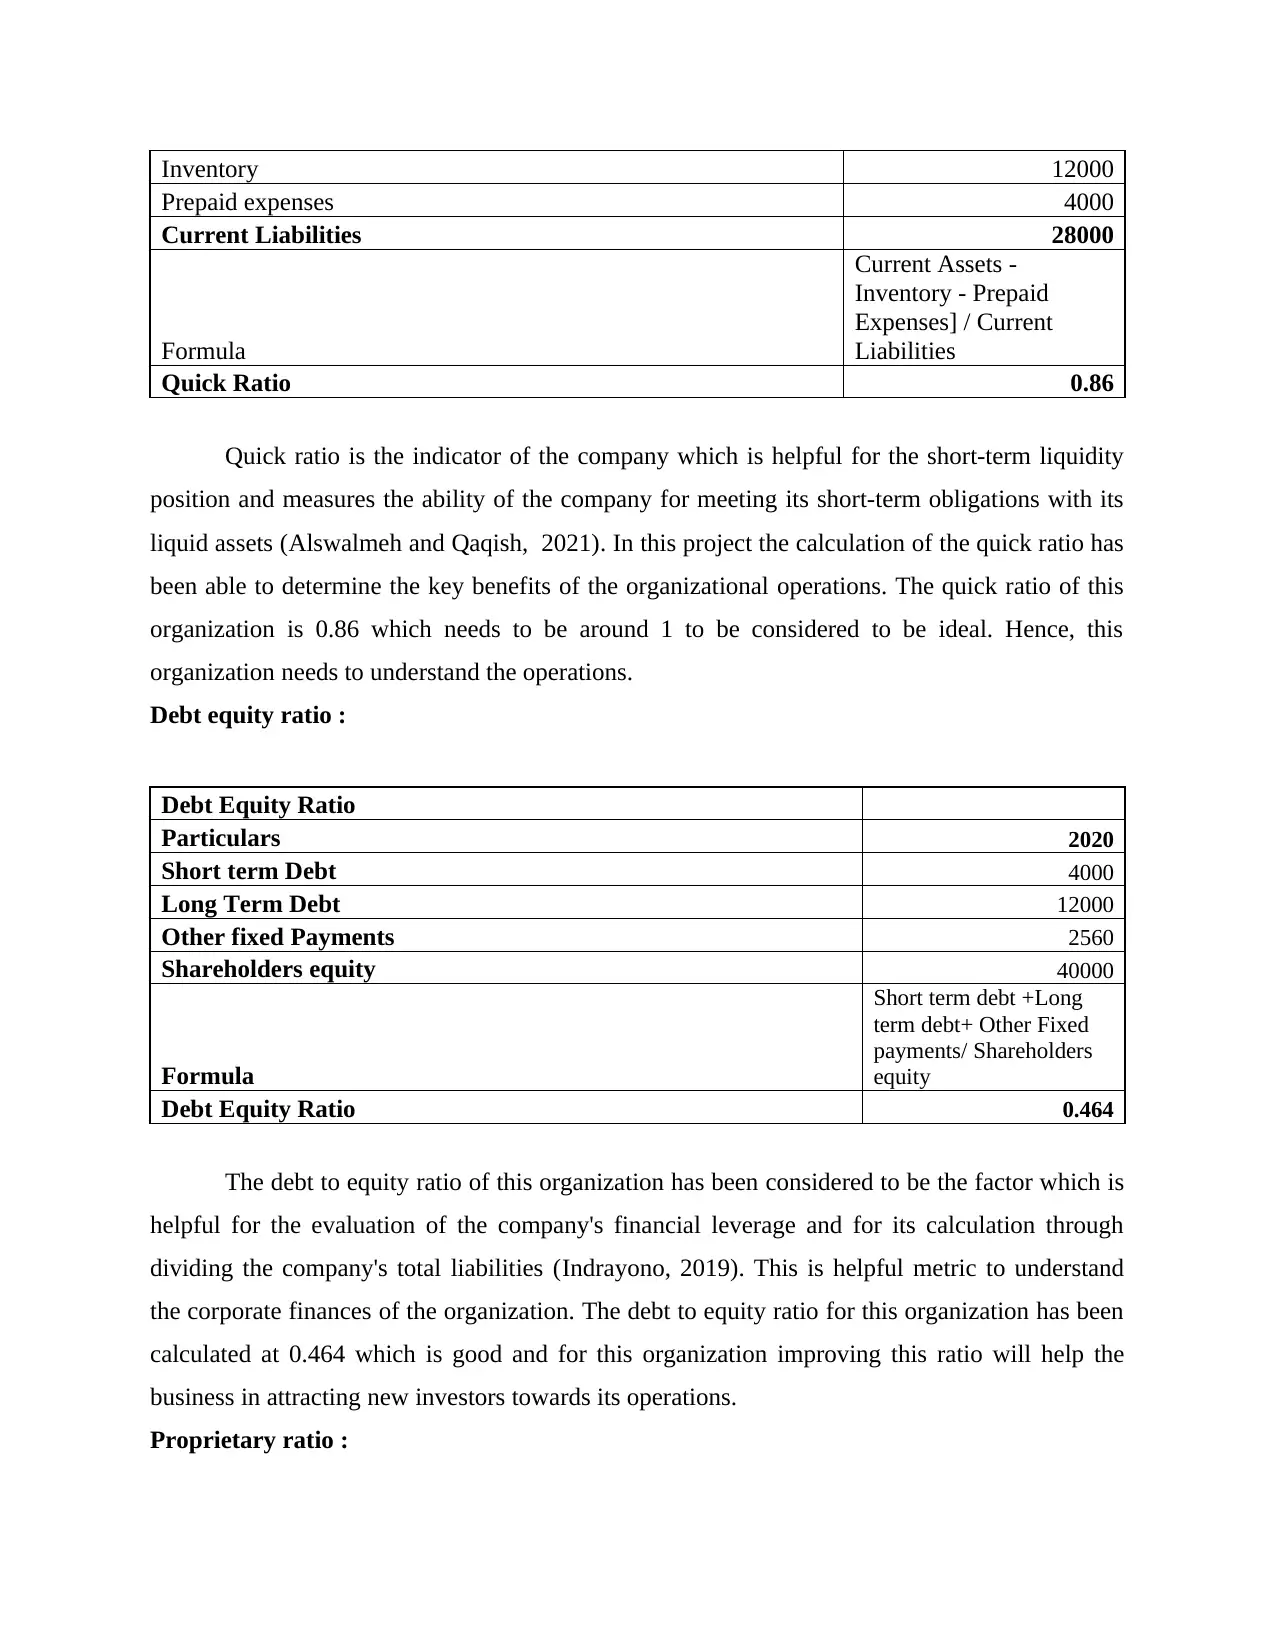
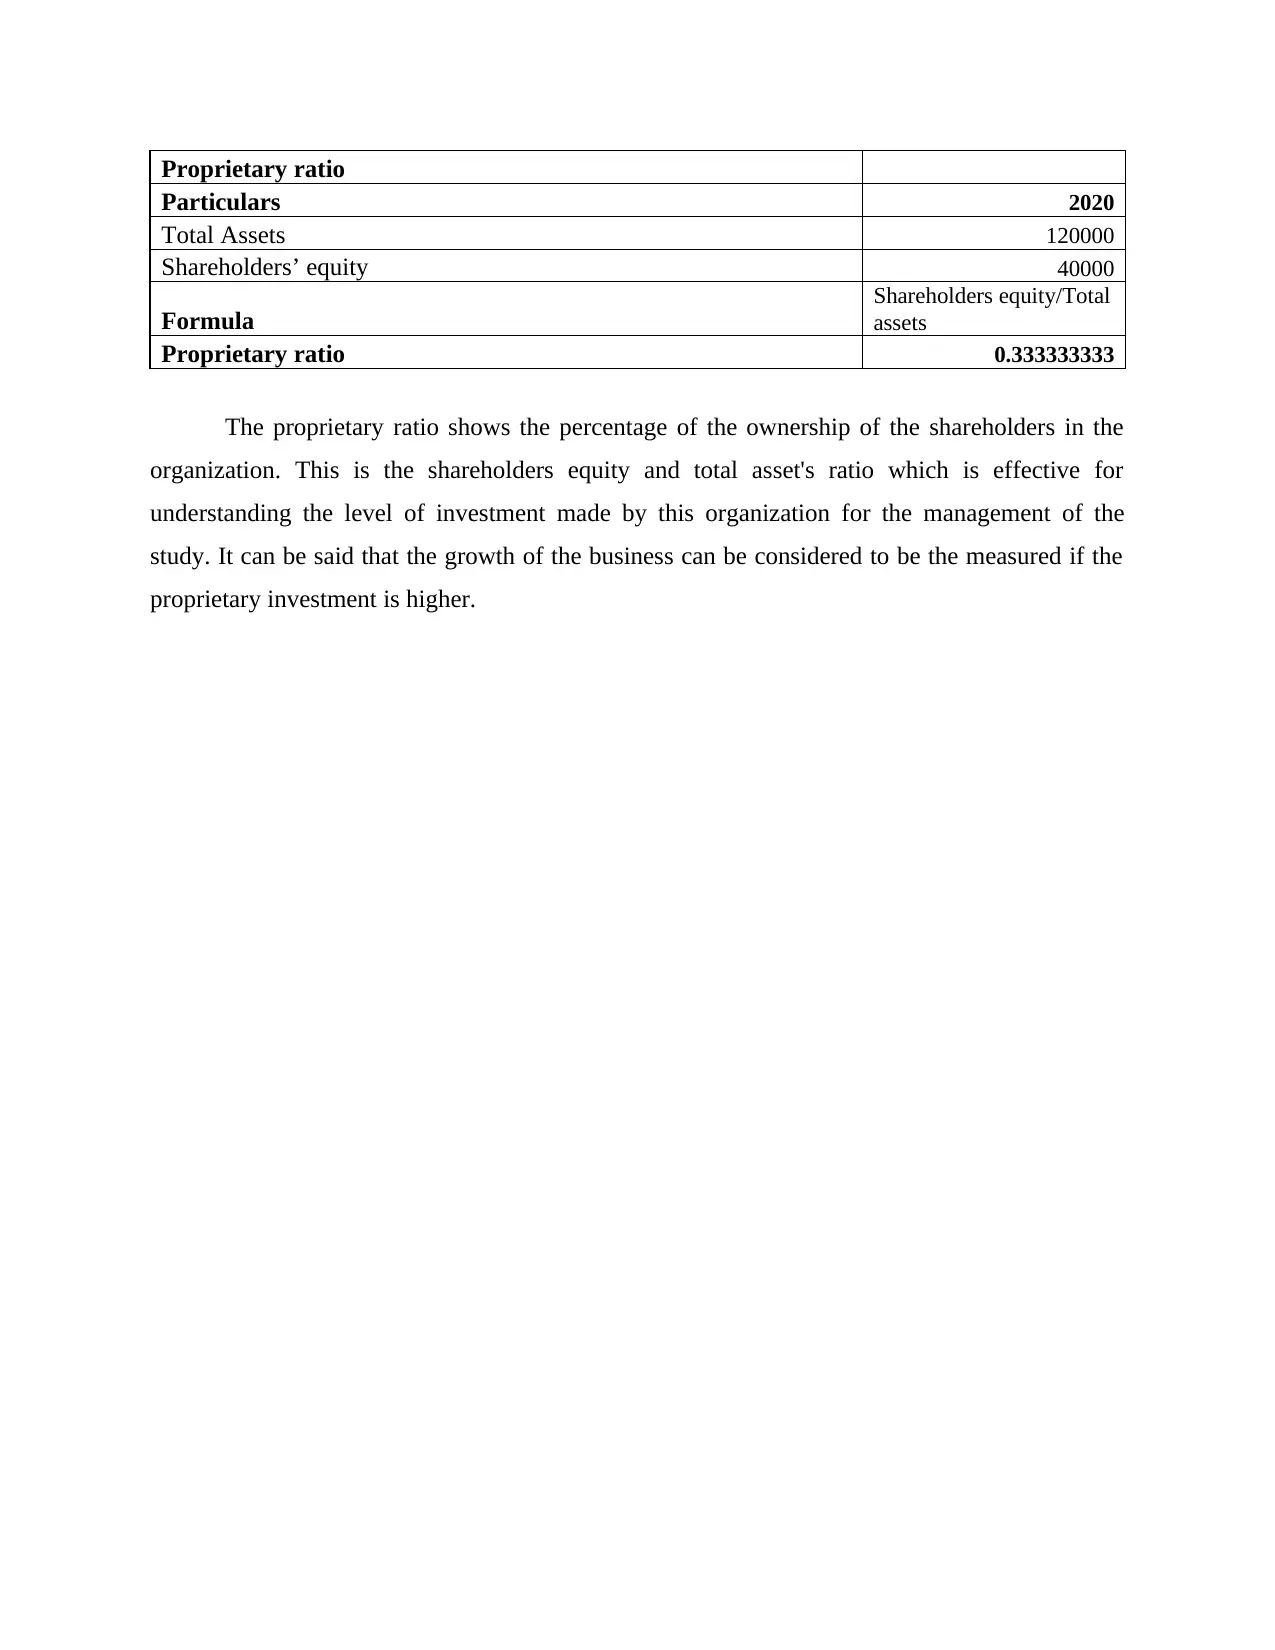
This report provides a financial analysis of Fortune Trading Company, focusing on the management of financial resources. It examines the company's profitability by analyzing different sales scenarios, considering fixed and variable costs. The report also discusses cost-plus pricing, highlighting its advantages and disadvantages. Furthermore, it evaluates Fortune Trading's financial health through ratio analysis, including current ratio, quick ratio, debt-equity ratio, and proprietary ratio, offering insights into the company's liquidity, leverage, and solvency. The analysis uses financial data from 2020 to assess the company's performance and identify areas for improvement. Desklib is a valuable platform to find similar solved assignments.
tabler-icon-diamond-filled.svg

Contribute Materials

Your contribution can guide someone’s learning journey. Share your documents today.
Document Page
Managing Financial
Resources
Assessment 2
tabler-icon-diamond-filled.svg

Secure Best Marks with AI Grader

Need help grading? Try our AI Grader for instant feedback on your assignments.
Document Page
TABLE OF CONTENTS
INTRODUCTION ..........................................................................................................................3
MAIN BODY...................................................................................................................................3
Question 1....................................................................................................................................3
Question 2....................................................................................................................................4
Question 3....................................................................................................................................5
Current Ratio :..................................................................................................................................5
REFERENCES................................................................................................................................8
Document Page
INTRODUCTION
Management of the financial resources is important as it helps the organization to obtain
funds and also make investments when it sis important for the current activities. In this project
the financial performance of Fortune trading company will be analysed. This project will be the
demonstration of the understanding of the use of cost information for the business performance.
This project will also be able to analyse the organizations budget through the use of variance
analysis.
MAIN BODY
Question 1
The price and unit distribution from the given study helps in the calculation of the units
which will be sold at different price levels.
£ Units
Price P1 100 100
Price P2 95 110
Price P3 90 120
The given costs are as follows,
Fixed cost is the cost which is fixed and will not change for an organization with any
increase or decrease of production.
Variable cost is given to change per unit of sale as changes as per the cost of production.
Fixed cost 2500
Variable cost @ per unit 20
From the above case study the following different scenarios that can be created that will
help the organization in the generation of profit.
Sales 1 P1*100 10000
Fixed cost 2500
Variable cost @ per unit 20 2000
Document Page
Profit 5500
Sales 2 P2*110 10450
Fixed cost 2500
Variable cost @ per unit 20 2200
Profit 5750
Sales 3 P3*120 10800
Fixed cost 2500
Variable cost @ per unit 20 2400
Profit 5900
From the above calculation it can be found that the business will be most profitable if its
decrease its price at P3 which is £90. This is due to the increase in the sales which provides it the
profit of £5900.
Question 2
Cost plus pricing is also known as the markup pricing which is the method that is used
for the fixed percentage is added on top of the cost which it takes to produce the one unit of a
product unit cost (Hosaka, 2019.). This is considered to be one of simplest pricing strategy which
is used for the charging extra for each item over the cost. This is also considered to be the factor
which is helpful for the deciding the wants for the sell pies for the 10% of the more than the
ingredients cost for making them the price that would be the cost for 110% of the cost. An
example of cost plus pricing,
Material cost =£10
Labour cost = £30
Overhead costs = £15
Therefore, the total costs = £55
hence, if the mark up of the price needs to be at 50%.
Formula for this would be,
tabler-icon-diamond-filled.svg

Secure Best Marks with AI Grader

Need help grading? Try our AI Grader for instant feedback on your assignments.
Document Page
Selling price = 55.00(1+0.50)
= 55.00(1.50)
= £82.50
The problems of utilization of this approach is,
The price can be set too high due to which the business may face a downfall in the sales
of the organization.
Due to this there is no guarantee of all the costs that will be covered or not.
Because of such simple calculation of the selling price there are no calculated incentives
from the sale.
Question 3
Current Ratio :
Current Ratio
Particulars 2020
Stock 12000
Debtors 12000
Cash in hand 12000
Short term investments 4000
Current Assets 40000
Bank OD 4000
Creditors 16000
Taxation(current + future) 8000
Current Liabilities 28000
Current Ratio 1.429
Current ratio is the liquidity ratio which is helpful for the measurement of the company's
ability to pay the short-term obligations to be paid (Ding, Peng and Wang, 2019). It has been
found that a good current ratio has been considered to be calculated from 1.5 to 3. Fortune
trading has been able to have a current ratio of 1.429 which is a decent current ratio however, it
needs to be improved which can be only done through increasing the efficiency of the operations
of the organization.
Quick Ratio
Particulars 2020
Current Assets 40000
Document Page
Inventory 12000
Prepaid expenses 4000
Current Liabilities 28000
Formula
Current Assets -
Inventory - Prepaid
Expenses] / Current
Liabilities
Quick Ratio 0.86
Quick ratio is the indicator of the company which is helpful for the short-term liquidity
position and measures the ability of the company for meeting its short-term obligations with its
liquid assets (Alswalmeh and Qaqish, 2021). In this project the calculation of the quick ratio has
been able to determine the key benefits of the organizational operations. The quick ratio of this
organization is 0.86 which needs to be around 1 to be considered to be ideal. Hence, this
organization needs to understand the operations.
Debt equity ratio :
Debt Equity Ratio
Particulars 2020
Short term Debt 4000
Long Term Debt 12000
Other fixed Payments 2560
Shareholders equity 40000
Formula
Short term debt +Long
term debt+ Other Fixed
payments/ Shareholders
equity
Debt Equity Ratio 0.464
The debt to equity ratio of this organization has been considered to be the factor which is
helpful for the evaluation of the company's financial leverage and for its calculation through
dividing the company's total liabilities (Indrayono, 2019). This is helpful metric to understand
the corporate finances of the organization. The debt to equity ratio for this organization has been
calculated at 0.464 which is good and for this organization improving this ratio will help the
business in attracting new investors towards its operations.
Proprietary ratio :
Document Page
Proprietary ratio
Particulars 2020
Total Assets 120000
Shareholders’ equity 40000
Formula
Shareholders equity/Total
assets
Proprietary ratio 0.333333333
The proprietary ratio shows the percentage of the ownership of the shareholders in the
organization. This is the shareholders equity and total asset's ratio which is effective for
understanding the level of investment made by this organization for the management of the
study. It can be said that the growth of the business can be considered to be the measured if the
proprietary investment is higher.
tabler-icon-diamond-filled.svg

Paraphrase This Document

Need a fresh take? Get an instant paraphrase of this document with our AI Paraphraser
Document Page
REFERENCES
Books and Journals
Hosaka, T., 2019. Bankruptcy prediction using imaged financial ratios and convolutional neural
networks. Expert systems with applications.117. pp.287-299..
Ding, K., Peng, X. and Wang, Y., 2019. A machine learning-based peer selection method with
financial ratios. Accounting Horizons. 33(3). pp.75-87.
Alswalmeh, A. and Qaqish, M., 2021. The Ability of Financial Ratios to Predict the Index of
Banking Sector in Amman Stock Exchange: An empirical study. International Journal
of Business Ethics and Governance. 4(1). pp.86-105.
Indrayono, Y., 2019. Predicting returns with financial ratios: Evidence from Indonesian Stock
Exchange. Management Science Letters. 9(11). pp.1908-1908.
chevron_up_icon
1 out of 8
circle_padding
hide_on_mobile
zoom_out_icon
logo.png

Your All-in-One AI-Powered Toolkit for Academic Success.

Available 24*7 on WhatsApp / Email

[object Object]