Analyzing Financial Statements and Managing Resources Report
VerifiedAdded on 2022/12/14
|15
|4272
|384
Report
AI Summary
This report provides a comprehensive analysis of financial resource management, covering key aspects such as financial statements, ratio analysis, and the identification of stakeholder needs. The report delves into the interpretation of financial ratios, including profitability, liquidity, and solvency ratios, to assess a company's performance. It also examines the financial information needs of different stakeholders, such as board members, shareholders, banks, customers, creditors, and competitors. Furthermore, the report explores the concept of cost-plus pricing, its implementation challenges, and its benefits. The analysis includes two assignments focusing on financial statement analysis, ratio interpretation, and the importance of resource management for overall business efficiency and decision-making. This report provides insights into how businesses can effectively manage their financial resources to improve profitability and achieve their strategic goals.

Managing financial
resources
resources
Paraphrase This Document
Need a fresh take? Get an instant paraphrase of this document with our AI Paraphraser
Contents
Contents...........................................................................................................................................2
Assignment 1...................................................................................................................................1
INTRODUCTION...........................................................................................................................1
MAIN BODY..................................................................................................................................1
Q1. Identifying the various financial statements and financial ratios.........................................1
Q2. Interpret the financial ratios of the company........................................................................3
Q3. Identifying the financial information needs of different stakeholders..................................5
CONCLUSION................................................................................................................................6
Assignment 2...................................................................................................................................7
INTRODUCTION...........................................................................................................................7
MAIN BODY..................................................................................................................................7
Question 2. Identifying the meaning of cost-plus pricing and problems using this approach.....7
Question 3. Identifying the financial ratios of the company.......................................................8
Question 4. Analysing the terms..................................................................................................9
Conclusion.....................................................................................................................................11
REFERENCES..............................................................................................................................12

⊘ This is a preview!⊘
Do you want full access?
Subscribe today to unlock all pages.
Trusted by 1+ million students worldwide
Assignment 1
INTRODUCTION
To ensure the organization's efficiency, resource management means effectively controlling
and tracking the various resources that are used (Zachosova, 2019). They contribute to
improving the company's working performance, which is done and accomplished by employees
and management. It is important to recognise the company's structure and requirements in order
to efficiently manage them, which can be achieved by examining the company's overall role. The
ability to successfully manage resources and other factors helps in assessing the firm's overall
effectiveness. This article looks at various financial ratios and income statements, and also the
financial data availability of different stakeholders. Aside from that, evaluating the sense of cost-
plus pricing and researching the problems with the strategy. This also involves the numerous
variances that help in determining the firm's effectiveness, which leads to a number of
management benefits aimed at increasing profitability.
MAIN BODY
Q1. Identifying the various financial statements and financial ratios
Financial statements are records that show a company's financial performance at the end of
the year in detail. It shows the official records of all required financial transactions that take
place in the company. They aid information users in assessing the financial health, liquidity, and
productivity of an organisation. This represents the company's financial implications of the deal.
Financial statements are used to calculate profits and are an essential part of an annual report of
the company. A list of financial statements is given below:
Income statements- This is the accounting information that many companies use to
reflect on their financial performance over time. The revenue and expense statements for
a particular year are also known as profit and loss statements. Any of the elements are as
follows:
Revenue- It refers to a company's sales of goods and services within a given accounting
period. This information can be gathered from both cash and credit transactions, and it can be
used to determine efficiency and reap a variety of benefits.
Paraphrase This Document
Need a fresh take? Get an instant paraphrase of this document with our AI Paraphraser
Profit and loss- Benefit or loss refers to the net profits received after deducting expenses
from revenue. Benefit will occur if revenue exceeds expenditures; if expenses surpass revenue, a
loss will result (Sansa, 2020).
Expenses- This is the day-to-day expense of doing business that a company incurs.
Operating expenses include things like salaries and depreciation.
Balance sheet- The asset, liability, and equity positions at the end of the accounting
period are depicted on the balance sheet, also known as the statements of financial
condition. This is an important feature of the financial report because it helps users of
financial statements who are looking for details about the company's financial status. This
assists in the assessment of the company's success and efficacy, and the execution of vital
strategic decisions.
Statements of cash flow- This is a compilation of financial statements that describes
both cash inflows and outflows from the company's ongoing operations and international
sources. It also provides all cash outflows for business activities and acquisitions over
time, as well as a rundown of all transactions for the investor. The cash flow has three
sections that can help an investor determine the stock of a business. The three types of
activities involved in this are operating activities, spending activities, and funding
activities. Each company has its own way of measuring efficiency and managing cash
flow.
Ratio analysis- It is the process of examining various pieces of financial data found in a
company's financial statements in order to evaluate the firm's effectiveness and profitability. This
is mainly used by the external analyst to evaluate various aspects of the firm, such as profitability
ratios, liquidity, and solvency. This is very useful for calculating cumulative outcomes of
different ratios. Some of the ratios are as follows:
Liquidity ratio- This calculates a company's capacity to complete an obligation using
existing assets when it is in financial trouble and unable to pay its debts and obligations.
It can quickly convert its assets into cash and use that money to pay off any debts it owes.
A few examples include the current ratio, quick ratio, and cash ratio (Kuisma, 2017).
Solvency ratio- To assess a company's long-term financial stability, this ratio compares
its debt levels to its assets and annual earnings. Related ratios include the debt to capital
ratio, debt ratio, interest coverage ratio, and equity multiplier. Governments, banks, staff,
and institutional investors mainly use these to determine a company's solvency, helping
them to make informed investment and other decisions.
Profitability ratio- This measure evaluates a company's ability to make profits as well as
the associated costs. A higher profit ratio means that an organization's activities are more
profitable and competitive. Investors and others use this ratio is used to evaluate a company's
performance and make educated decisions about next steps. Return on equity, return on asset,
operating margin, gross margin, and return on invested capital are all important profitability
indicators. They are crucial in precisely determining the company's outcomes.
Q2. Interpret the financial ratios of the company
Following are the interpretation of financial ratios of the organisation are as follows-
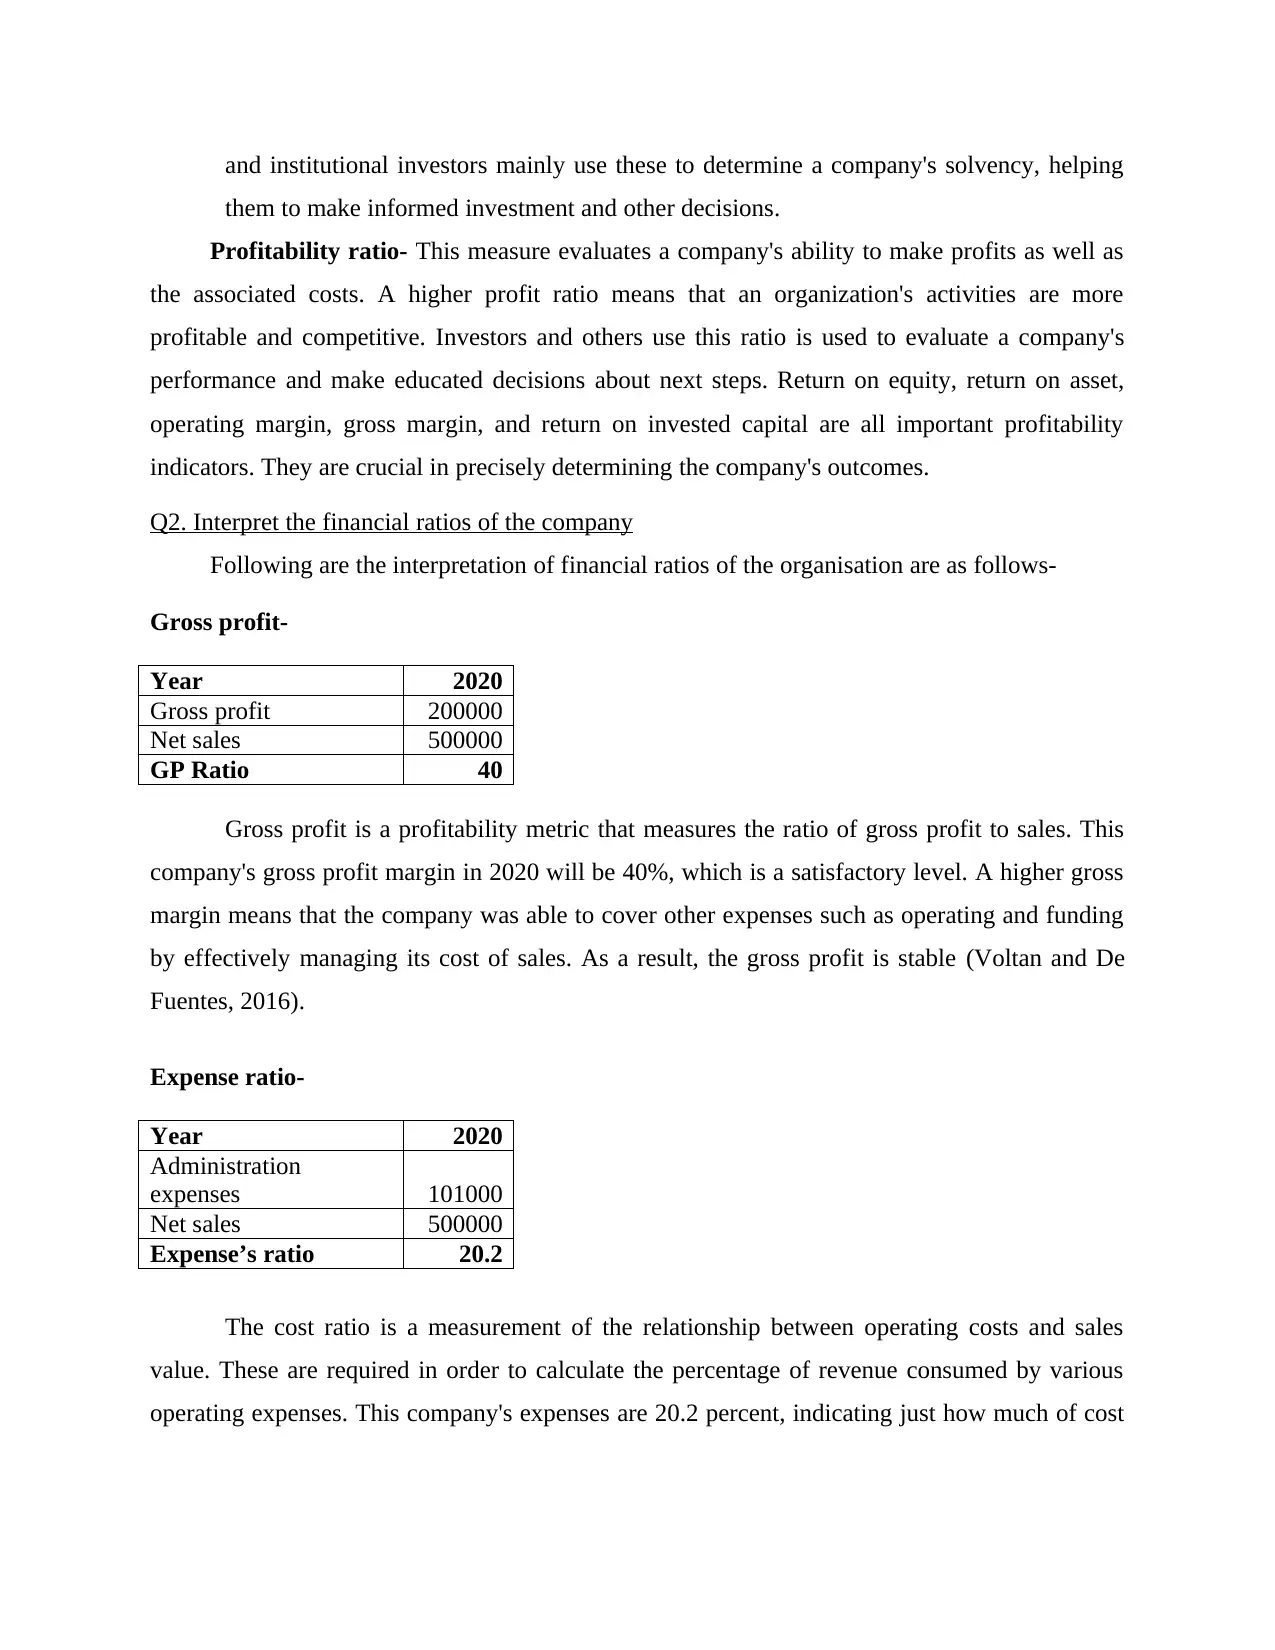
Gross profit-
Year 2020
Gross profit 200000
Net sales 500000
GP Ratio 40
Gross profit is a profitability metric that measures the ratio of gross profit to sales. This
company's gross profit margin in 2020 will be 40%, which is a satisfactory level. A higher gross
margin means that the company was able to cover other expenses such as operating and funding
by effectively managing its cost of sales. As a result, the gross profit is stable (Voltan and De
Fuentes, 2016).
Expense ratio-
Year 2020
Administration
expenses 101000
Net sales 500000
Expense’s ratio 20.2
The cost ratio is a measurement of the relationship between operating costs and sales
value. These are required in order to calculate the percentage of revenue consumed by various
operating expenses. This company's expenses are 20.2 percent, indicating just how much of cost
them to make informed investment and other decisions.
Profitability ratio- This measure evaluates a company's ability to make profits as well as
the associated costs. A higher profit ratio means that an organization's activities are more
profitable and competitive. Investors and others use this ratio is used to evaluate a company's
performance and make educated decisions about next steps. Return on equity, return on asset,
operating margin, gross margin, and return on invested capital are all important profitability
indicators. They are crucial in precisely determining the company's outcomes.
Q2. Interpret the financial ratios of the company
Following are the interpretation of financial ratios of the organisation are as follows-
Gross profit-
Year 2020
Gross profit 200000
Net sales 500000
GP Ratio 40
Gross profit is a profitability metric that measures the ratio of gross profit to sales. This
company's gross profit margin in 2020 will be 40%, which is a satisfactory level. A higher gross
margin means that the company was able to cover other expenses such as operating and funding
by effectively managing its cost of sales. As a result, the gross profit is stable (Voltan and De
Fuentes, 2016).
Expense ratio-
Year 2020
Administration
expenses 101000
Net sales 500000
Expense’s ratio 20.2
The cost ratio is a measurement of the relationship between operating costs and sales
value. These are required in order to calculate the percentage of revenue consumed by various
operating expenses. This company's expenses are 20.2 percent, indicating just how much of cost
⊘ This is a preview!⊘
Do you want full access?
Subscribe today to unlock all pages.
Trusted by 1+ million students worldwide
ratio is borne by revenue and how much of the expense and sales ratio is interrelated, as well as
the business's efficiency and effectiveness.
Net profit-
Year 2020
Net profit 84000
Net sales 500000
Net profit ratio 16.8
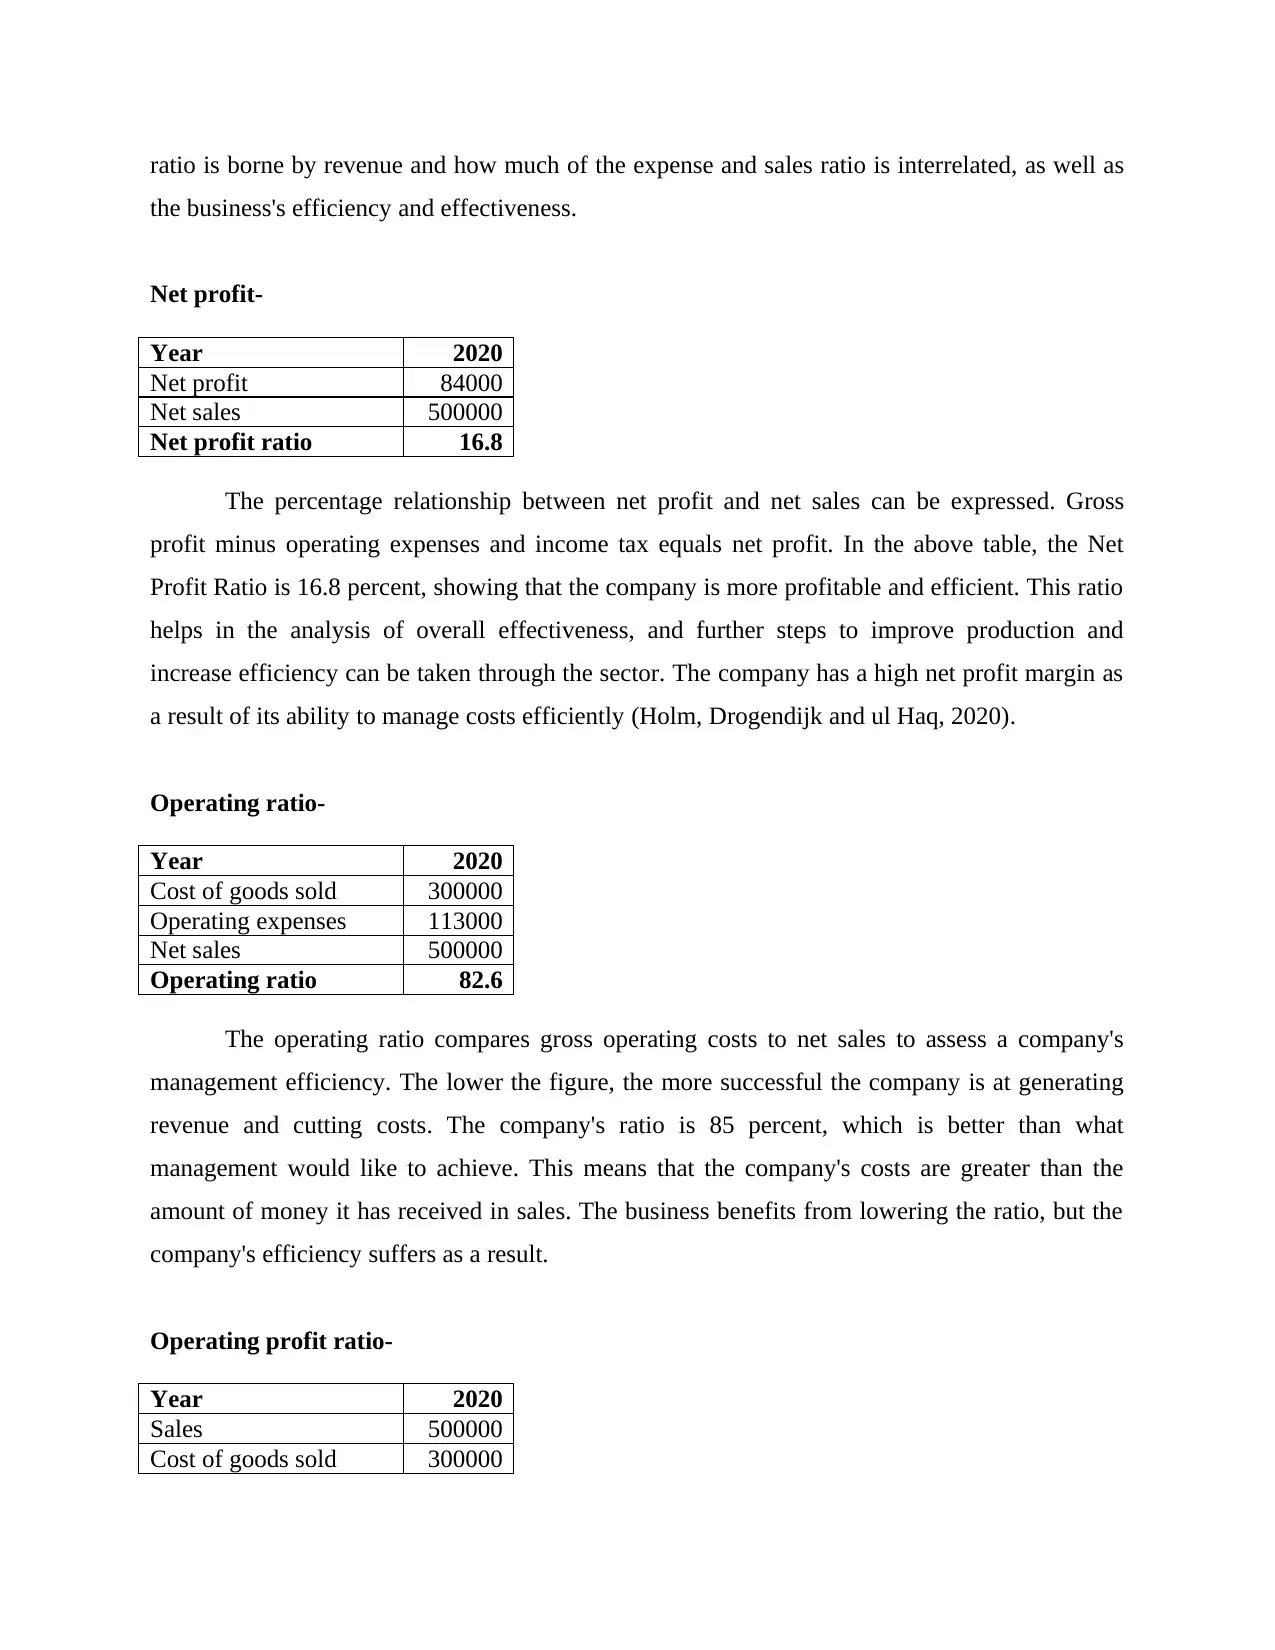
The percentage relationship between net profit and net sales can be expressed. Gross
profit minus operating expenses and income tax equals net profit. In the above table, the Net
Profit Ratio is 16.8 percent, showing that the company is more profitable and efficient. This ratio
helps in the analysis of overall effectiveness, and further steps to improve production and
increase efficiency can be taken through the sector. The company has a high net profit margin as
a result of its ability to manage costs efficiently (Holm, Drogendijk and ul Haq, 2020).
Operating ratio-
Year 2020
Cost of goods sold 300000
Operating expenses 113000
Net sales 500000
Operating ratio 82.6
The operating ratio compares gross operating costs to net sales to assess a company's
management efficiency. The lower the figure, the more successful the company is at generating
revenue and cutting costs. The company's ratio is 85 percent, which is better than what
management would like to achieve. This means that the company's costs are greater than the
amount of money it has received in sales. The business benefits from lowering the ratio, but the
company's efficiency suffers as a result.
Operating profit ratio-
Year 2020
Sales 500000
Cost of goods sold 300000
the business's efficiency and effectiveness.
Net profit-
Year 2020
Net profit 84000
Net sales 500000
Net profit ratio 16.8
The percentage relationship between net profit and net sales can be expressed. Gross
profit minus operating expenses and income tax equals net profit. In the above table, the Net
Profit Ratio is 16.8 percent, showing that the company is more profitable and efficient. This ratio
helps in the analysis of overall effectiveness, and further steps to improve production and
increase efficiency can be taken through the sector. The company has a high net profit margin as
a result of its ability to manage costs efficiently (Holm, Drogendijk and ul Haq, 2020).
Operating ratio-
Year 2020
Cost of goods sold 300000
Operating expenses 113000
Net sales 500000
Operating ratio 82.6
The operating ratio compares gross operating costs to net sales to assess a company's
management efficiency. The lower the figure, the more successful the company is at generating
revenue and cutting costs. The company's ratio is 85 percent, which is better than what
management would like to achieve. This means that the company's costs are greater than the
amount of money it has received in sales. The business benefits from lowering the ratio, but the
company's efficiency suffers as a result.
Operating profit ratio-
Year 2020
Sales 500000
Cost of goods sold 300000
Paraphrase This Document
Need a fresh take? Get an instant paraphrase of this document with our AI Paraphraser
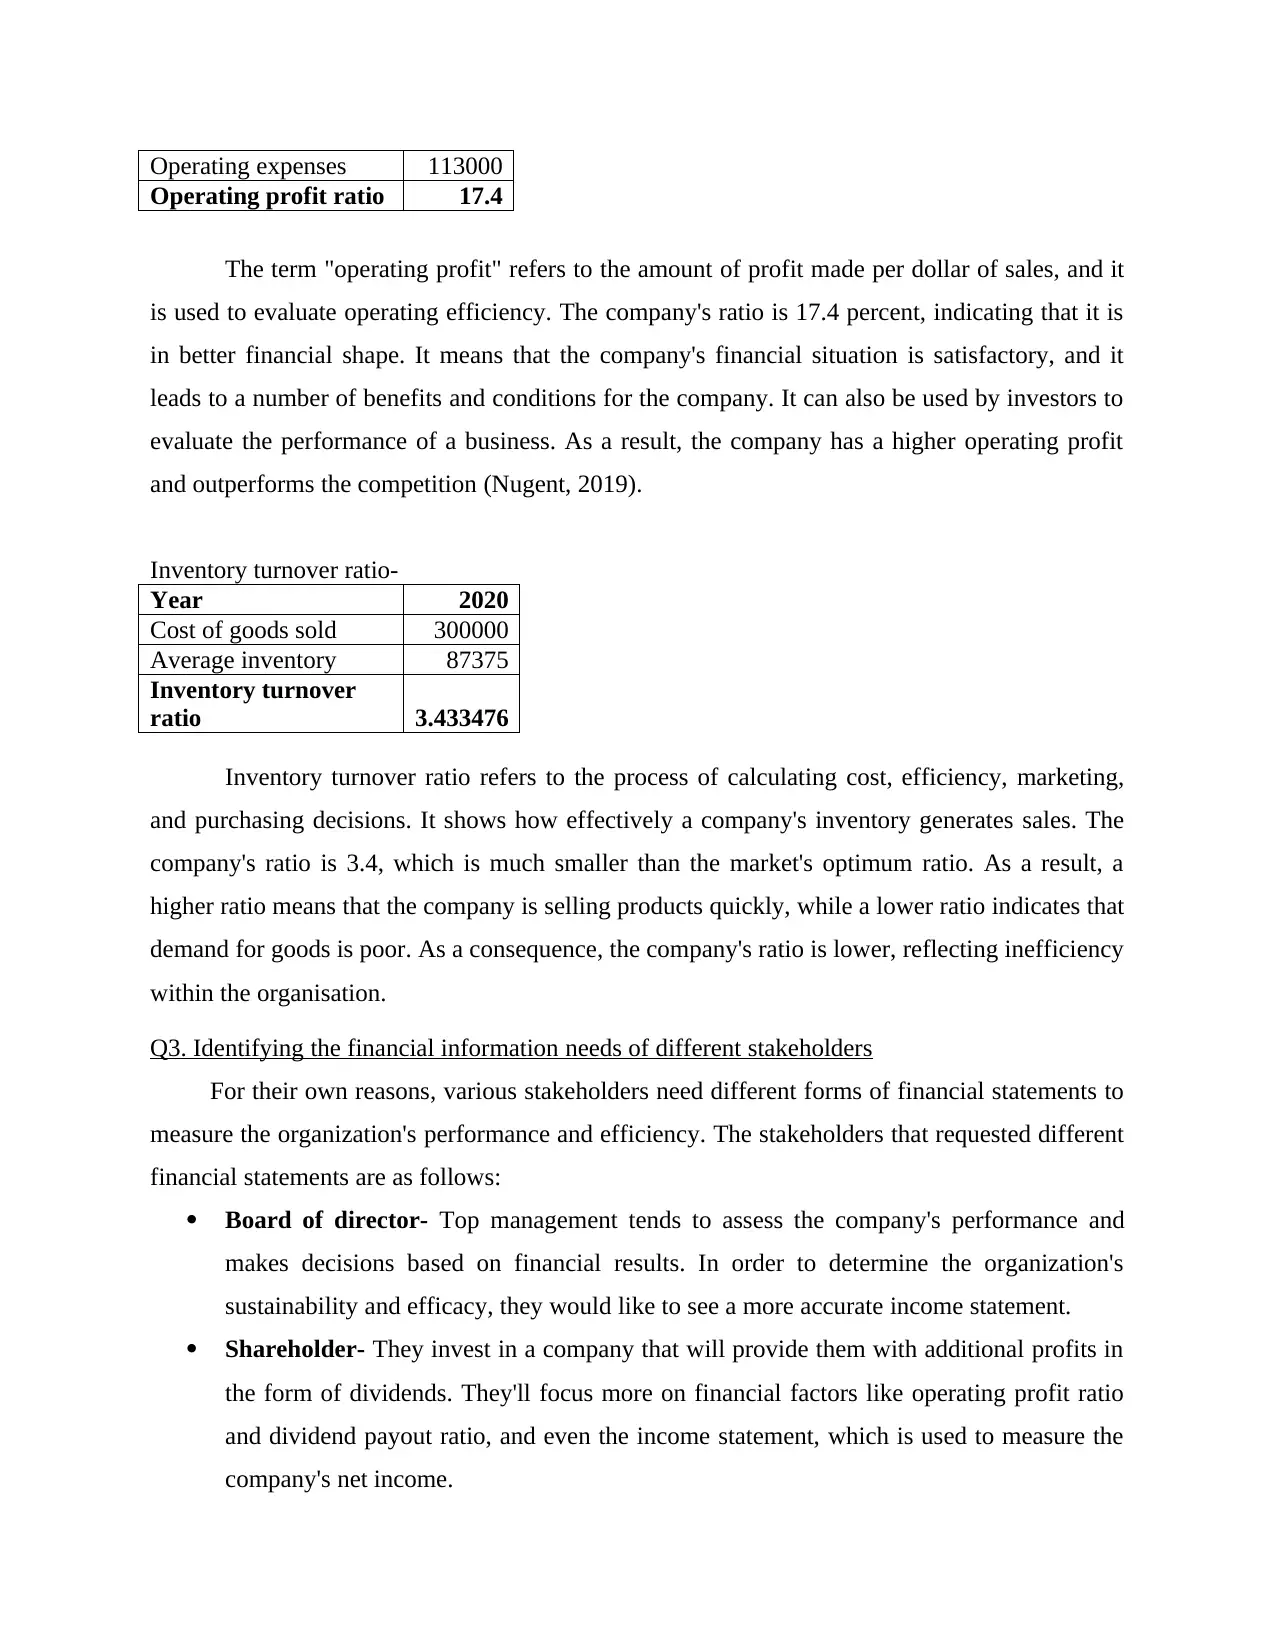
Operating expenses 113000
Operating profit ratio 17.4
The term "operating profit" refers to the amount of profit made per dollar of sales, and it
is used to evaluate operating efficiency. The company's ratio is 17.4 percent, indicating that it is
in better financial shape. It means that the company's financial situation is satisfactory, and it
leads to a number of benefits and conditions for the company. It can also be used by investors to
evaluate the performance of a business. As a result, the company has a higher operating profit
and outperforms the competition (Nugent, 2019).
Inventory turnover ratio-
Year 2020
Cost of goods sold 300000
Average inventory 87375
Inventory turnover
ratio 3.433476
Inventory turnover ratio refers to the process of calculating cost, efficiency, marketing,
and purchasing decisions. It shows how effectively a company's inventory generates sales. The
company's ratio is 3.4, which is much smaller than the market's optimum ratio. As a result, a
higher ratio means that the company is selling products quickly, while a lower ratio indicates that
demand for goods is poor. As a consequence, the company's ratio is lower, reflecting inefficiency
within the organisation.
Q3. Identifying the financial information needs of different stakeholders
For their own reasons, various stakeholders need different forms of financial statements to
measure the organization's performance and efficiency. The stakeholders that requested different
financial statements are as follows:
Board of director- Top management tends to assess the company's performance and
makes decisions based on financial results. In order to determine the organization's
sustainability and efficacy, they would like to see a more accurate income statement.
Shareholder- They invest in a company that will provide them with additional profits in
the form of dividends. They'll focus more on financial factors like operating profit ratio
and dividend payout ratio, and even the income statement, which is used to measure the
company's net income.
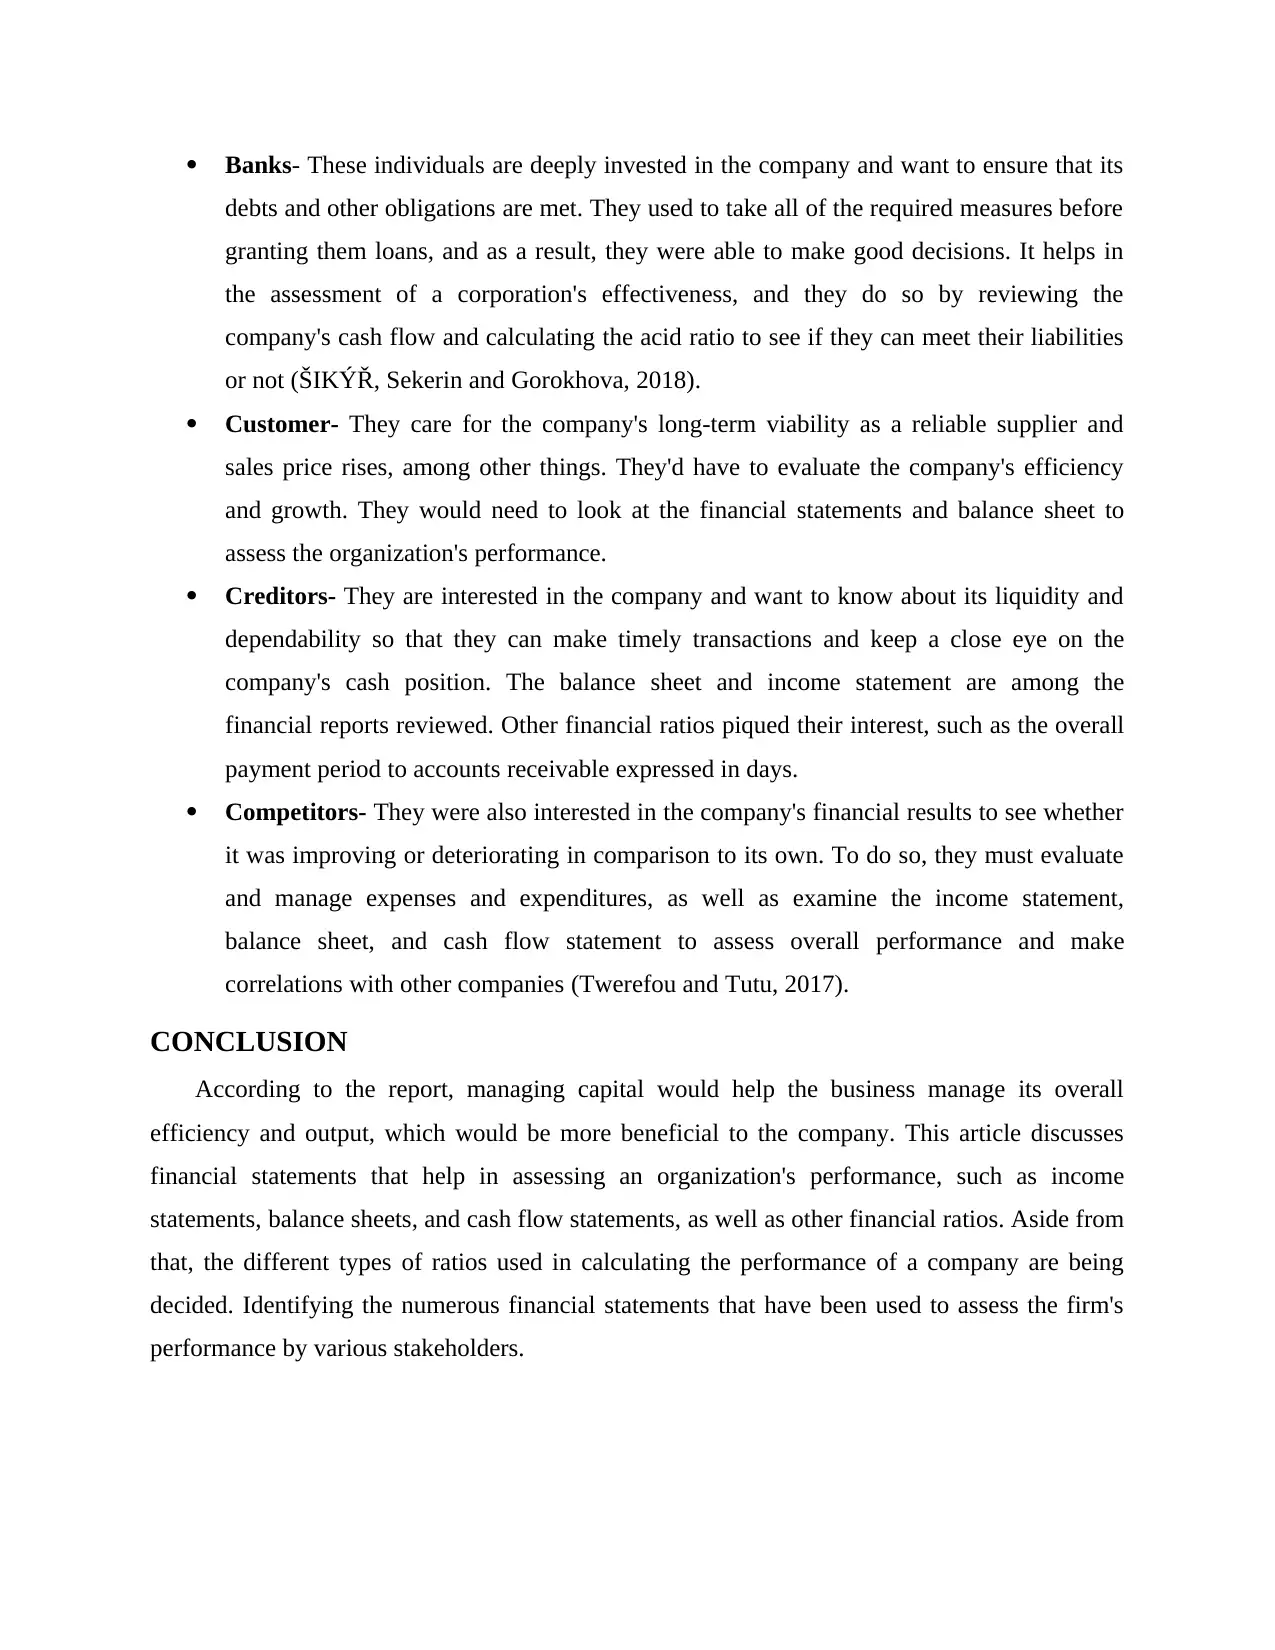
Banks- These individuals are deeply invested in the company and want to ensure that its
debts and other obligations are met. They used to take all of the required measures before
granting them loans, and as a result, they were able to make good decisions. It helps in
the assessment of a corporation's effectiveness, and they do so by reviewing the
company's cash flow and calculating the acid ratio to see if they can meet their liabilities
or not (ŠIKÝŘ, Sekerin and Gorokhova, 2018).
Customer- They care for the company's long-term viability as a reliable supplier and
sales price rises, among other things. They'd have to evaluate the company's efficiency
and growth. They would need to look at the financial statements and balance sheet to
assess the organization's performance.
Creditors- They are interested in the company and want to know about its liquidity and
dependability so that they can make timely transactions and keep a close eye on the
company's cash position. The balance sheet and income statement are among the
financial reports reviewed. Other financial ratios piqued their interest, such as the overall
payment period to accounts receivable expressed in days.
Competitors- They were also interested in the company's financial results to see whether
it was improving or deteriorating in comparison to its own. To do so, they must evaluate
and manage expenses and expenditures, as well as examine the income statement,
balance sheet, and cash flow statement to assess overall performance and make
correlations with other companies (Twerefou and Tutu, 2017).
CONCLUSION
According to the report, managing capital would help the business manage its overall
efficiency and output, which would be more beneficial to the company. This article discusses
financial statements that help in assessing an organization's performance, such as income
statements, balance sheets, and cash flow statements, as well as other financial ratios. Aside from
that, the different types of ratios used in calculating the performance of a company are being
decided. Identifying the numerous financial statements that have been used to assess the firm's
performance by various stakeholders.
⊘ This is a preview!⊘
Do you want full access?
Subscribe today to unlock all pages.
Trusted by 1+ million students worldwide
Assignment 2
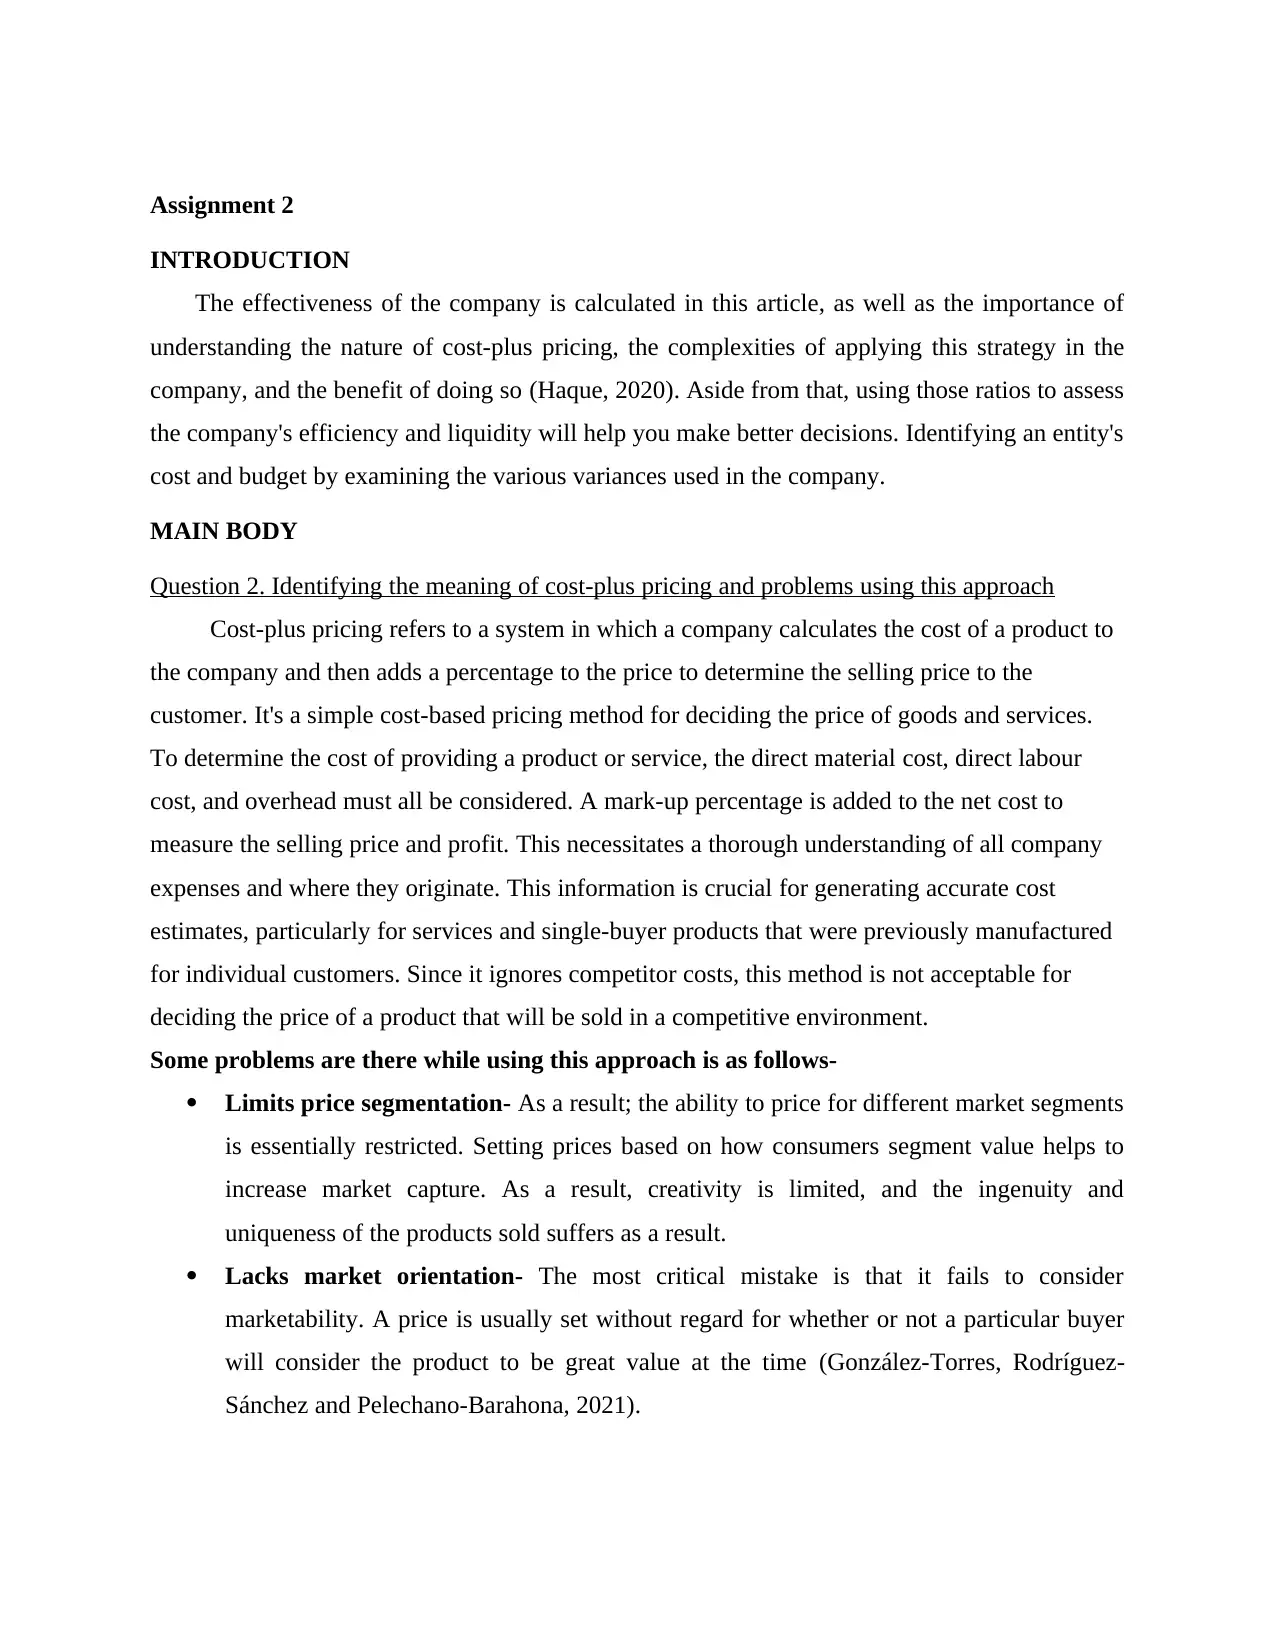
INTRODUCTION
The effectiveness of the company is calculated in this article, as well as the importance of
understanding the nature of cost-plus pricing, the complexities of applying this strategy in the
company, and the benefit of doing so (Haque, 2020). Aside from that, using those ratios to assess
the company's efficiency and liquidity will help you make better decisions. Identifying an entity's
cost and budget by examining the various variances used in the company.
MAIN BODY
Question 2. Identifying the meaning of cost-plus pricing and problems using this approach
Cost-plus pricing refers to a system in which a company calculates the cost of a product to
the company and then adds a percentage to the price to determine the selling price to the
customer. It's a simple cost-based pricing method for deciding the price of goods and services.
To determine the cost of providing a product or service, the direct material cost, direct labour
cost, and overhead must all be considered. A mark-up percentage is added to the net cost to
measure the selling price and profit. This necessitates a thorough understanding of all company
expenses and where they originate. This information is crucial for generating accurate cost
estimates, particularly for services and single-buyer products that were previously manufactured
for individual customers. Since it ignores competitor costs, this method is not acceptable for
deciding the price of a product that will be sold in a competitive environment.
Some problems are there while using this approach is as follows-
Limits price segmentation- As a result; the ability to price for different market segments
is essentially restricted. Setting prices based on how consumers segment value helps to
increase market capture. As a result, creativity is limited, and the ingenuity and
uniqueness of the products sold suffers as a result.
Lacks market orientation- The most critical mistake is that it fails to consider
marketability. A price is usually set without regard for whether or not a particular buyer
will consider the product to be great value at the time (González-Torres, Rodríguez-
Sánchez and Pelechano-Barahona, 2021).
Paraphrase This Document
Need a fresh take? Get an instant paraphrase of this document with our AI Paraphraser
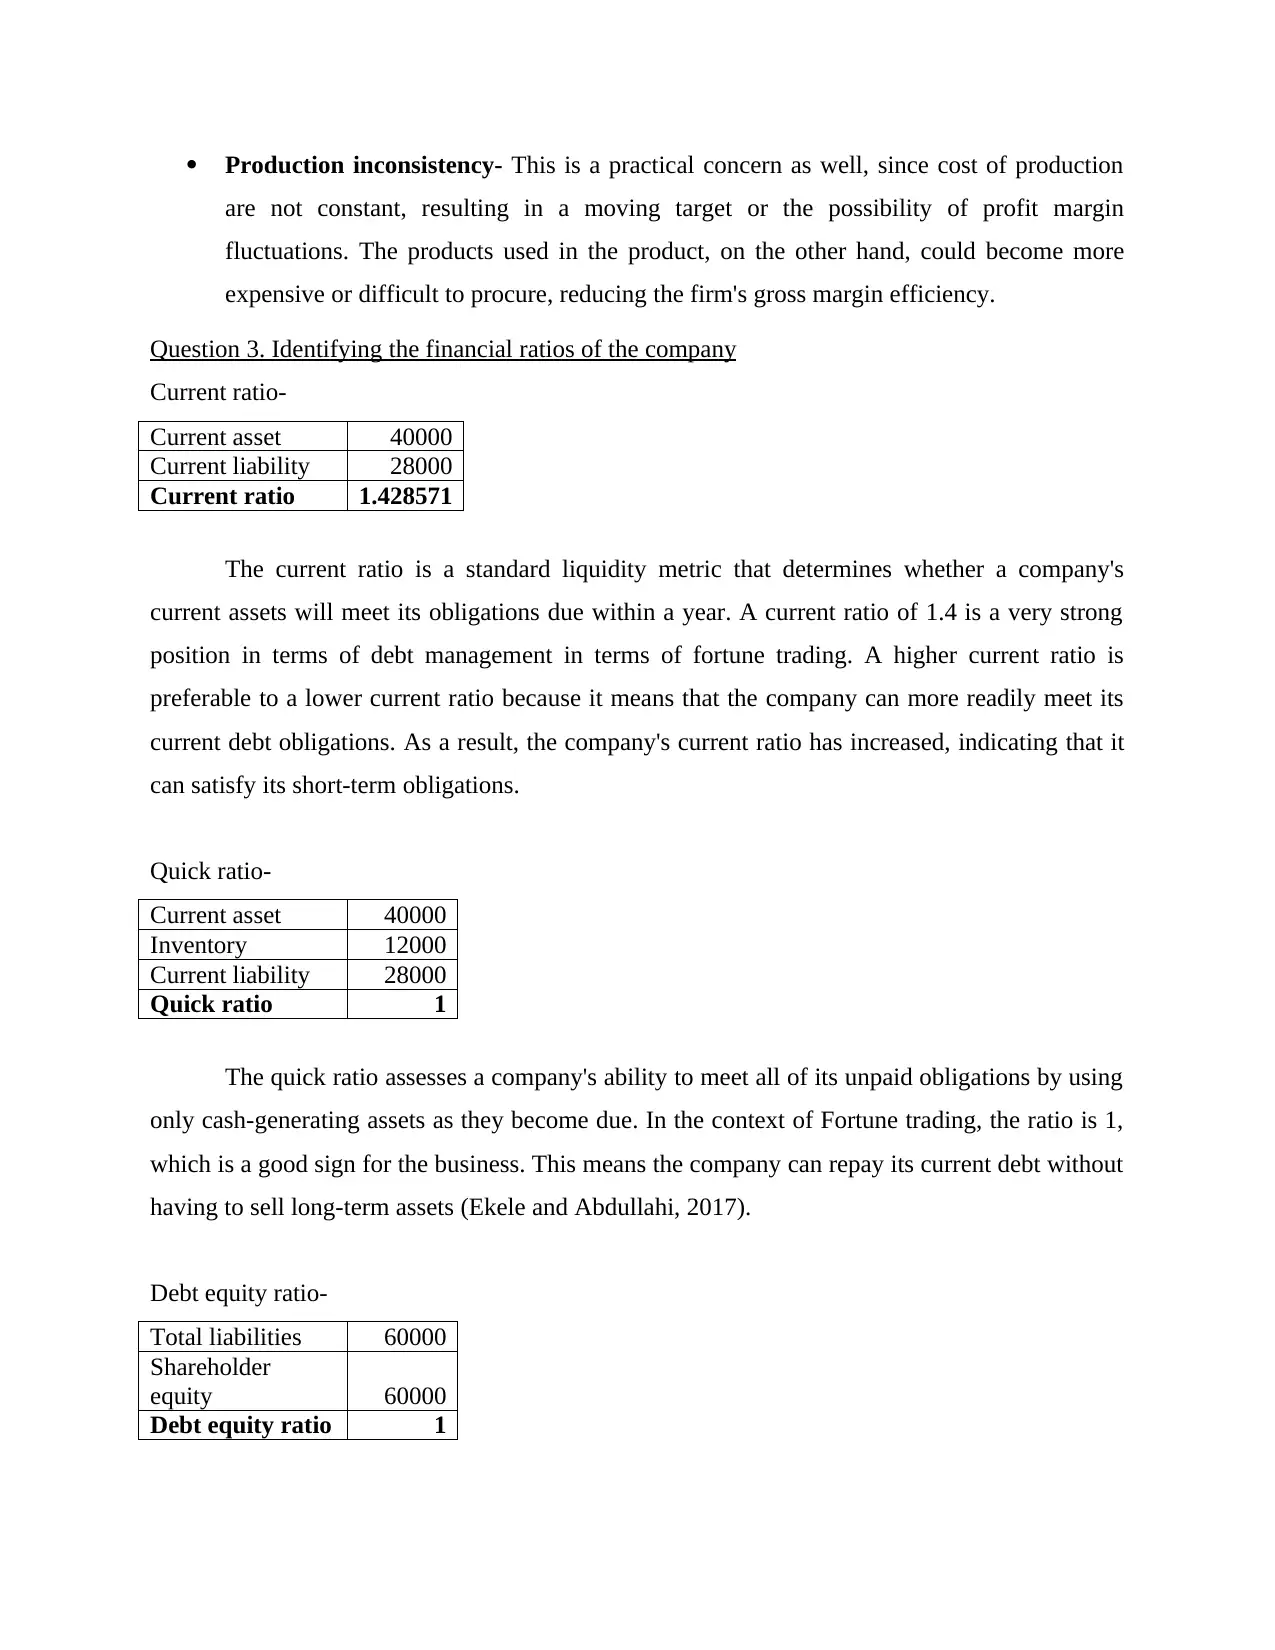
Production inconsistency- This is a practical concern as well, since cost of production
are not constant, resulting in a moving target or the possibility of profit margin
fluctuations. The products used in the product, on the other hand, could become more
expensive or difficult to procure, reducing the firm's gross margin efficiency.
Question 3. Identifying the financial ratios of the company
Current ratio-
Current asset 40000
Current liability 28000
Current ratio 1.428571
The current ratio is a standard liquidity metric that determines whether a company's
current assets will meet its obligations due within a year. A current ratio of 1.4 is a very strong
position in terms of debt management in terms of fortune trading. A higher current ratio is
preferable to a lower current ratio because it means that the company can more readily meet its
current debt obligations. As a result, the company's current ratio has increased, indicating that it
can satisfy its short-term obligations.
Quick ratio-
Current asset 40000
Inventory 12000
Current liability 28000
Quick ratio 1
The quick ratio assesses a company's ability to meet all of its unpaid obligations by using
only cash-generating assets as they become due. In the context of Fortune trading, the ratio is 1,
which is a good sign for the business. This means the company can repay its current debt without
having to sell long-term assets (Ekele and Abdullahi, 2017).
Debt equity ratio-
Total liabilities 60000
Shareholder
equity 60000
Debt equity ratio 1
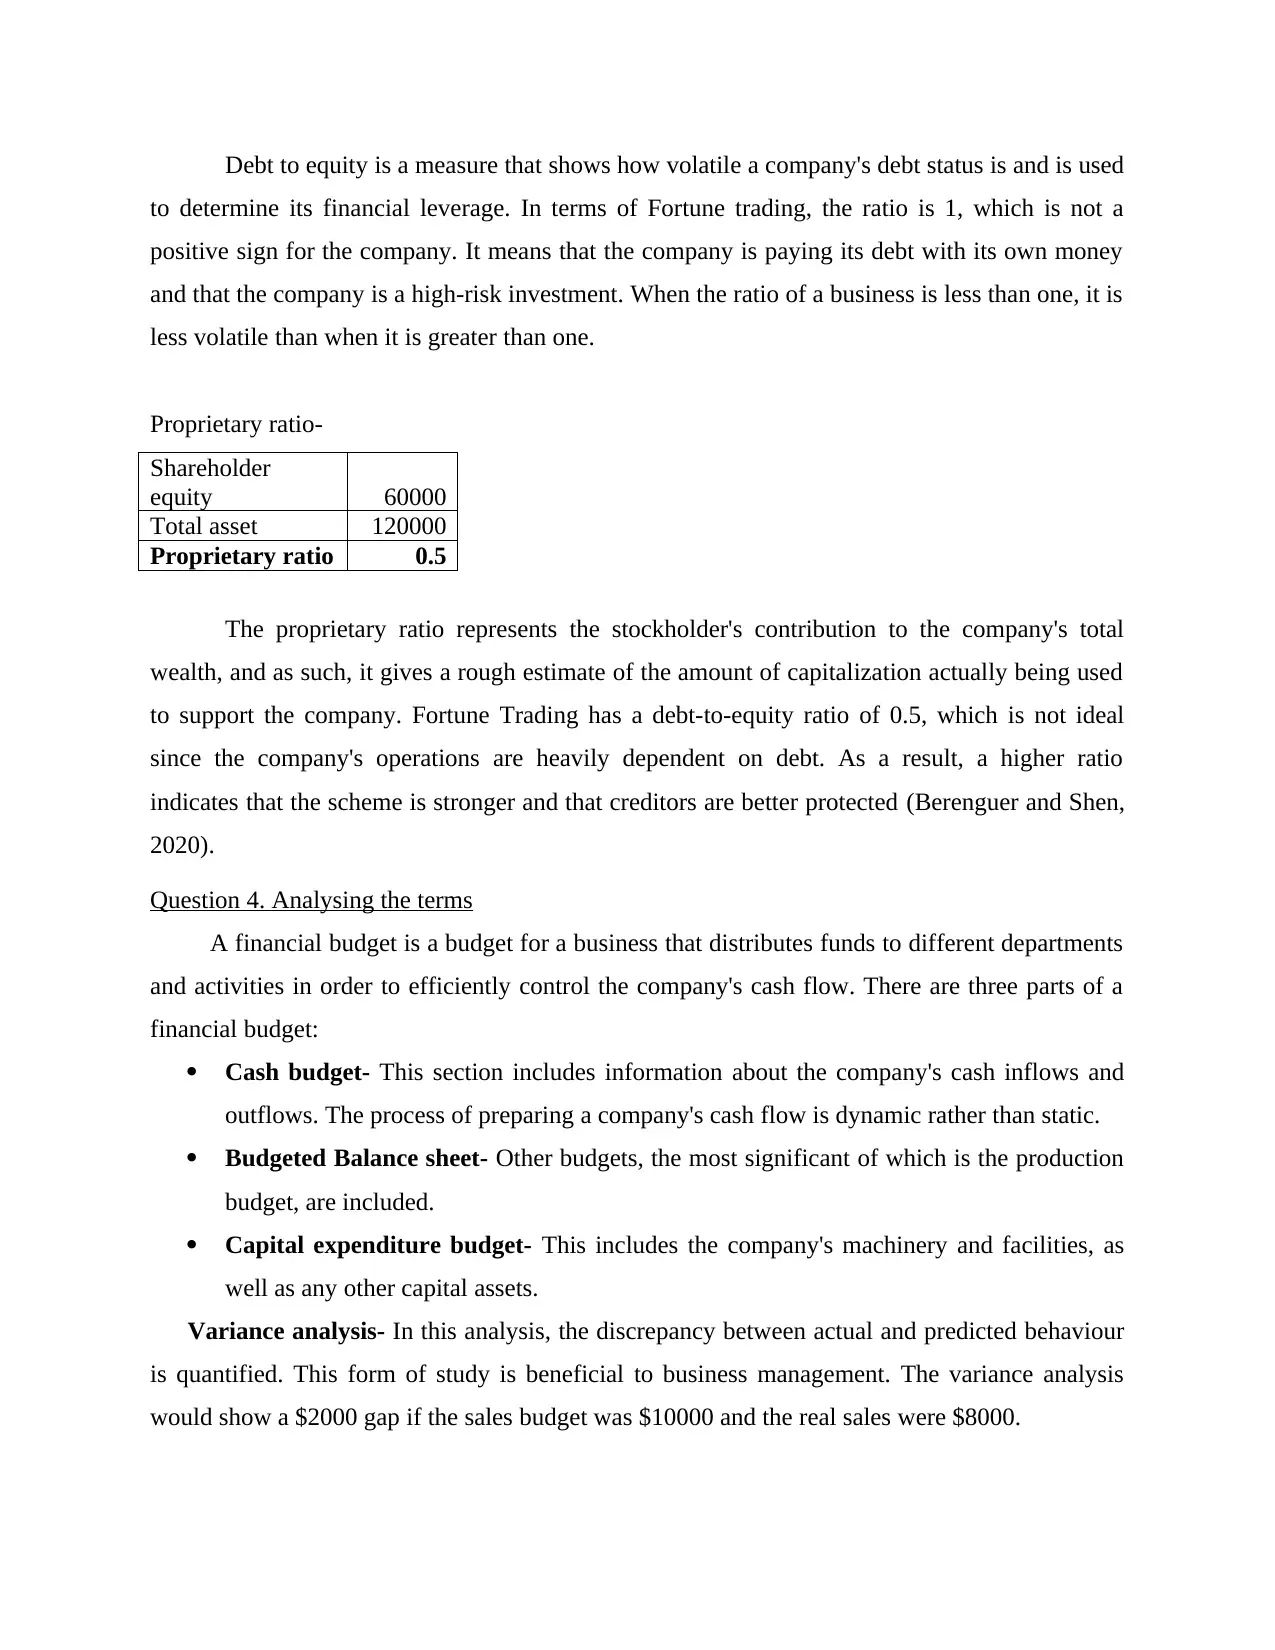
Debt to equity is a measure that shows how volatile a company's debt status is and is used
to determine its financial leverage. In terms of Fortune trading, the ratio is 1, which is not a
positive sign for the company. It means that the company is paying its debt with its own money
and that the company is a high-risk investment. When the ratio of a business is less than one, it is
less volatile than when it is greater than one.
Proprietary ratio-
Shareholder
equity 60000
Total asset 120000
Proprietary ratio 0.5
The proprietary ratio represents the stockholder's contribution to the company's total
wealth, and as such, it gives a rough estimate of the amount of capitalization actually being used
to support the company. Fortune Trading has a debt-to-equity ratio of 0.5, which is not ideal
since the company's operations are heavily dependent on debt. As a result, a higher ratio
indicates that the scheme is stronger and that creditors are better protected (Berenguer and Shen,
2020).
Question 4. Analysing the terms
A financial budget is a budget for a business that distributes funds to different departments
and activities in order to efficiently control the company's cash flow. There are three parts of a
financial budget:
Cash budget- This section includes information about the company's cash inflows and
outflows. The process of preparing a company's cash flow is dynamic rather than static.
Budgeted Balance sheet- Other budgets, the most significant of which is the production
budget, are included.
Capital expenditure budget- This includes the company's machinery and facilities, as
well as any other capital assets.
Variance analysis- In this analysis, the discrepancy between actual and predicted behaviour
is quantified. This form of study is beneficial to business management. The variance analysis
would show a $2000 gap if the sales budget was $10000 and the real sales were $8000.
⊘ This is a preview!⊘
Do you want full access?
Subscribe today to unlock all pages.
Trusted by 1+ million students worldwide
1 out of 15
Related Documents


Your All-in-One AI-Powered Toolkit for Academic Success.
+13062052269
info@desklib.com
Available 24*7 on WhatsApp / Email
![[object Object]](/_next/static/media/star-bottom.7253800d.svg)
Unlock your academic potential
Copyright © 2020–2026 A2Z Services. All Rights Reserved. Developed and managed by ZUCOL.