Financial Ratio Analysis and Investment Recommendations Report
VerifiedAdded on 2023/01/16
|11
|2313
|34
Report
AI Summary
This report presents a comprehensive financial analysis, evaluating the performance of two companies, Jones Ltd and Millet Ltd, through the computation and interpretation of various financial ratios. The analysis includes operating profit ratio, return on shareholders' funds, return on equity, inventory turnover, accounts receivables collection period, quick ratio, gearing ratio, interest cover ratio, dividend cover ratio, and dividend per share. The report then critically analyzes the limitations of financial ratios in decision-making, considering factors like historical data, aggregation, operational changes, accounting policies, company strategy, and inflation. Furthermore, the report delves into cost classification, including direct and indirect costs, functional classifications, and behavioral classifications (fixed, variable, and semi-variable costs). A job cost statement is framed, and the report concludes with a recommendation to the managers on whether to accept a quote, based on the financial analysis and profitability assessment. The report suggests accepting a quote of £7450.99 as it will generate sufficient profits.

Managing Financial Resources
Paraphrase This Document
Need a fresh take? Get an instant paraphrase of this document with our AI Paraphraser
Table of Contents
TASK 1............................................................................................................................................3
a. Computing ratios .....................................................................................................................3
b. Evaluating performance of both the organization and providing appropriate
recommendations within which Benns Ltd need to make investment ........................................4
c. Critically analysing limitation of the financial ratios in the process of decision making
within business enterprise ...........................................................................................................7
TASK 2............................................................................................................................................8
a. Determining several forms of the cost classification ..............................................................8
b. Framing a statement ................................................................................................................8
c. Advising the managers in relation to accept the quote or not ...............................................10
REFERENCES..............................................................................................................................11
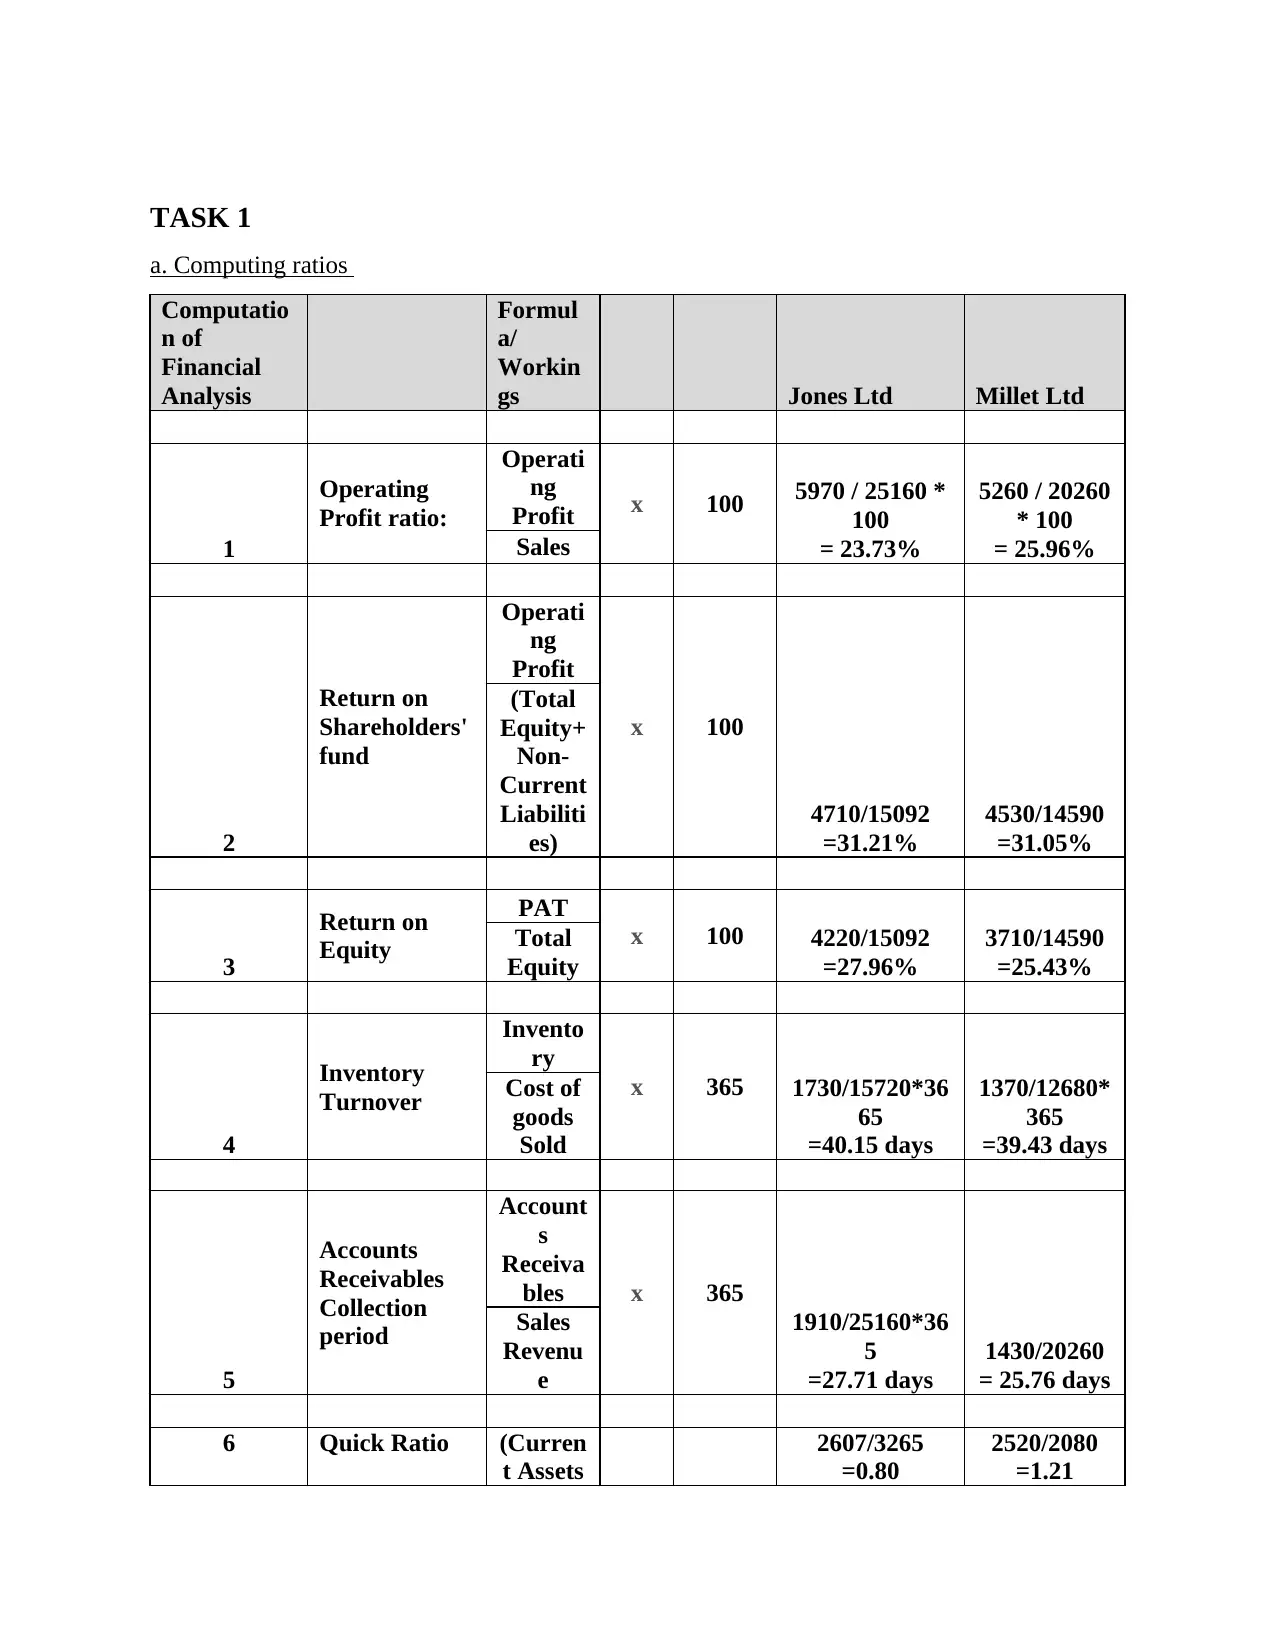
TASK 1
a. Computing ratios
Computatio
n of
Financial
Analysis
Formul
a/
Workin
gs Jones Ltd Millet Ltd
1
Operating
Profit ratio:
Operati
ng
Profit x 100 5970 / 25160 *
100
= 23.73%
5260 / 20260
* 100
= 25.96%Sales
2
Return on
Shareholders'
fund
Operati
ng
Profit
x 100
4710/15092
=31.21%
4530/14590
=31.05%
(Total
Equity+
Non-
Current
Liabiliti
es)
3
Return on
Equity
PAT
x 100 4220/15092
=27.96%
3710/14590
=25.43%
Total
Equity
4
Inventory
Turnover
Invento
ry
x 365 1730/15720*36
65
=40.15 days
1370/12680*
365
=39.43 days
Cost of
goods
Sold
5
Accounts
Receivables
Collection
period
Account
s
Receiva
bles x 365
1910/25160*36
5
=27.71 days
1430/20260
= 25.76 days
Sales
Revenu
e
6 Quick Ratio (Curren
t Assets
2607/3265
=0.80
2520/2080
=1.21
⊘ This is a preview!⊘
Do you want full access?
Subscribe today to unlock all pages.
Trusted by 1+ million students worldwide
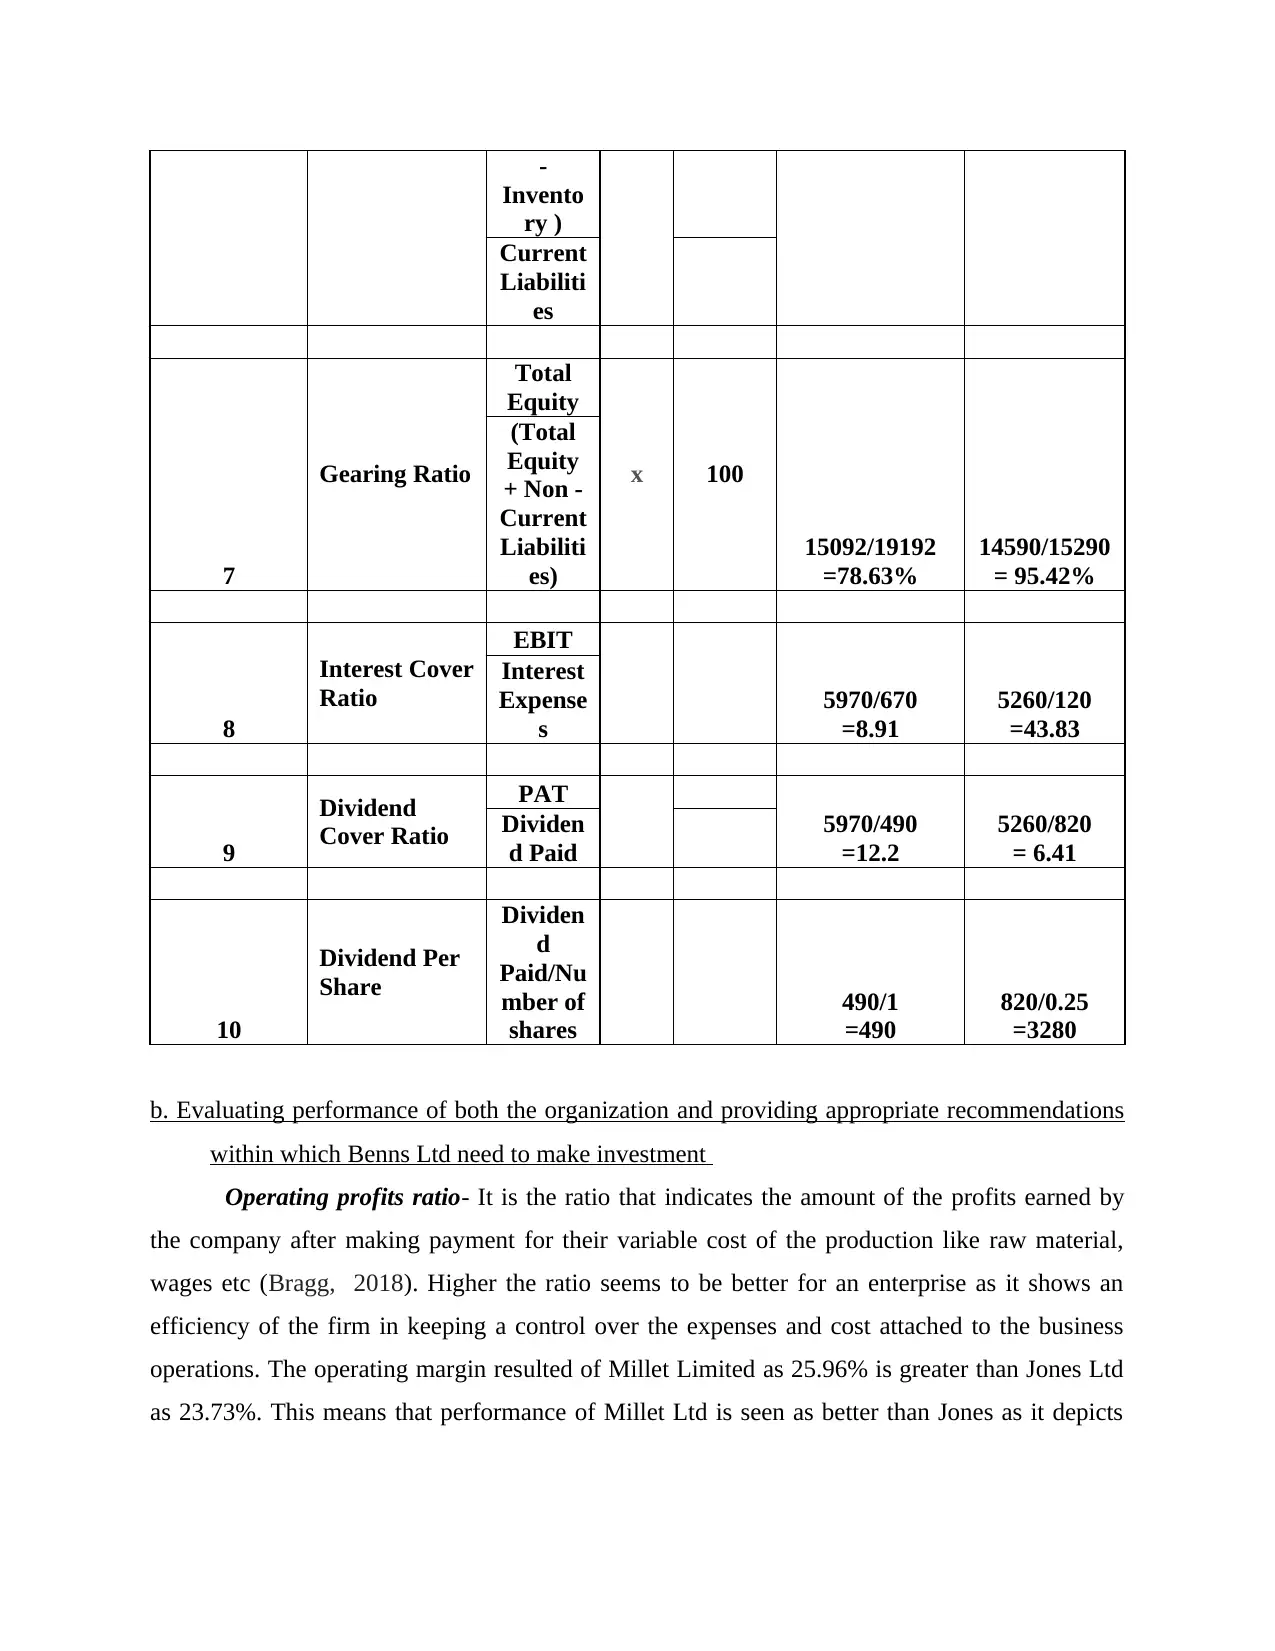
-
Invento
ry )
Current
Liabiliti
es
7
Gearing Ratio
Total
Equity
x 100
15092/19192
=78.63%
14590/15290
= 95.42%
(Total
Equity
+ Non -
Current
Liabiliti
es)
8
Interest Cover
Ratio
EBIT
5970/670
=8.91
5260/120
=43.83
Interest
Expense
s
9
Dividend
Cover Ratio
PAT
5970/490
=12.2
5260/820
= 6.41
Dividen
d Paid
10
Dividend Per
Share
Dividen
d
Paid/Nu
mber of
shares
490/1
=490
820/0.25
=3280
b. Evaluating performance of both the organization and providing appropriate recommendations
within which Benns Ltd need to make investment
Operating profits ratio- It is the ratio that indicates the amount of the profits earned by
the company after making payment for their variable cost of the production like raw material,
wages etc (Bragg, 2018). Higher the ratio seems to be better for an enterprise as it shows an
efficiency of the firm in keeping a control over the expenses and cost attached to the business
operations. The operating margin resulted of Millet Limited as 25.96% is greater than Jones Ltd
as 23.73%. This means that performance of Millet Ltd is seen as better than Jones as it depicts
Paraphrase This Document
Need a fresh take? Get an instant paraphrase of this document with our AI Paraphraser
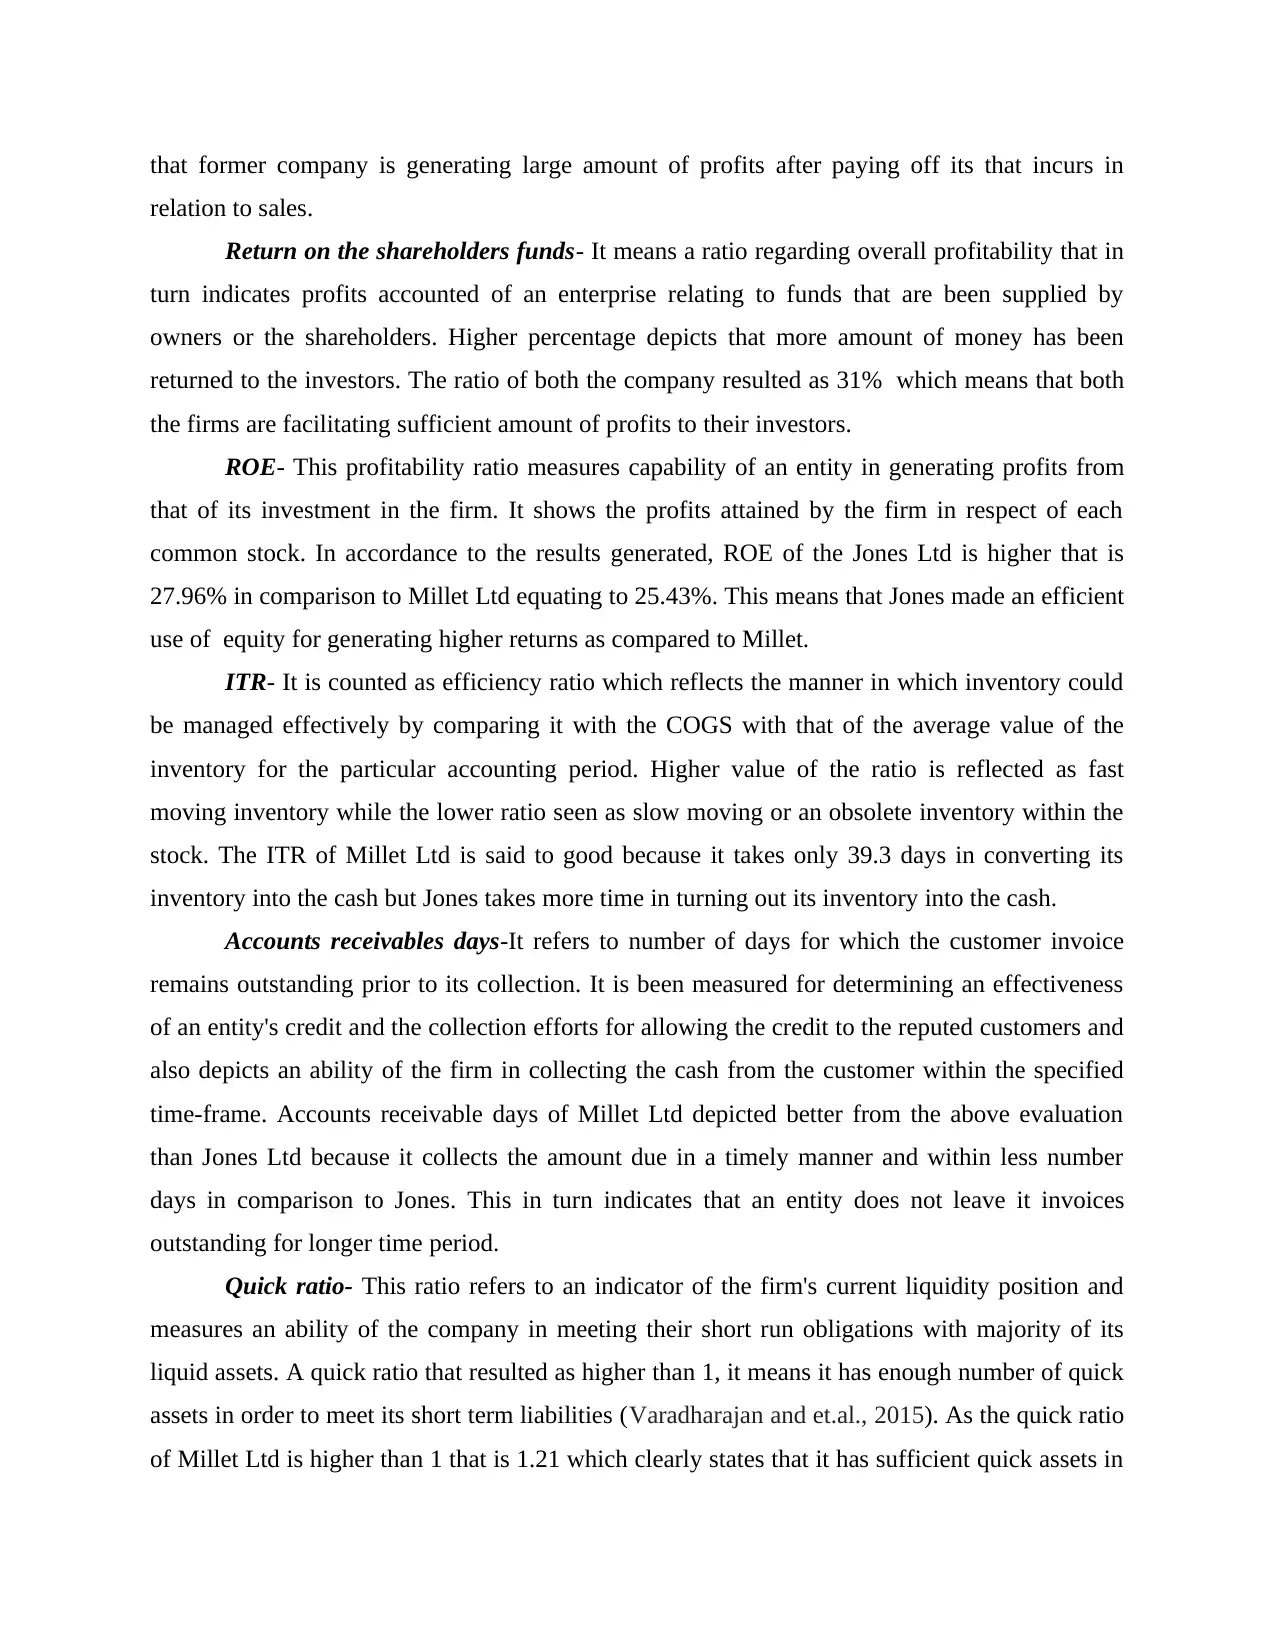
that former company is generating large amount of profits after paying off its that incurs in
relation to sales.
Return on the shareholders funds- It means a ratio regarding overall profitability that in
turn indicates profits accounted of an enterprise relating to funds that are been supplied by
owners or the shareholders. Higher percentage depicts that more amount of money has been
returned to the investors. The ratio of both the company resulted as 31% which means that both
the firms are facilitating sufficient amount of profits to their investors.
ROE- This profitability ratio measures capability of an entity in generating profits from
that of its investment in the firm. It shows the profits attained by the firm in respect of each
common stock. In accordance to the results generated, ROE of the Jones Ltd is higher that is
27.96% in comparison to Millet Ltd equating to 25.43%. This means that Jones made an efficient
use of equity for generating higher returns as compared to Millet.
ITR- It is counted as efficiency ratio which reflects the manner in which inventory could
be managed effectively by comparing it with the COGS with that of the average value of the
inventory for the particular accounting period. Higher value of the ratio is reflected as fast
moving inventory while the lower ratio seen as slow moving or an obsolete inventory within the
stock. The ITR of Millet Ltd is said to good because it takes only 39.3 days in converting its
inventory into the cash but Jones takes more time in turning out its inventory into the cash.
Accounts receivables days-It refers to number of days for which the customer invoice
remains outstanding prior to its collection. It is been measured for determining an effectiveness
of an entity's credit and the collection efforts for allowing the credit to the reputed customers and
also depicts an ability of the firm in collecting the cash from the customer within the specified
time-frame. Accounts receivable days of Millet Ltd depicted better from the above evaluation
than Jones Ltd because it collects the amount due in a timely manner and within less number
days in comparison to Jones. This in turn indicates that an entity does not leave it invoices
outstanding for longer time period.
Quick ratio- This ratio refers to an indicator of the firm's current liquidity position and
measures an ability of the company in meeting their short run obligations with majority of its
liquid assets. A quick ratio that resulted as higher than 1, it means it has enough number of quick
assets in order to meet its short term liabilities (Varadharajan and et.al., 2015). As the quick ratio
of Millet Ltd is higher than 1 that is 1.21 which clearly states that it has sufficient quick assets in
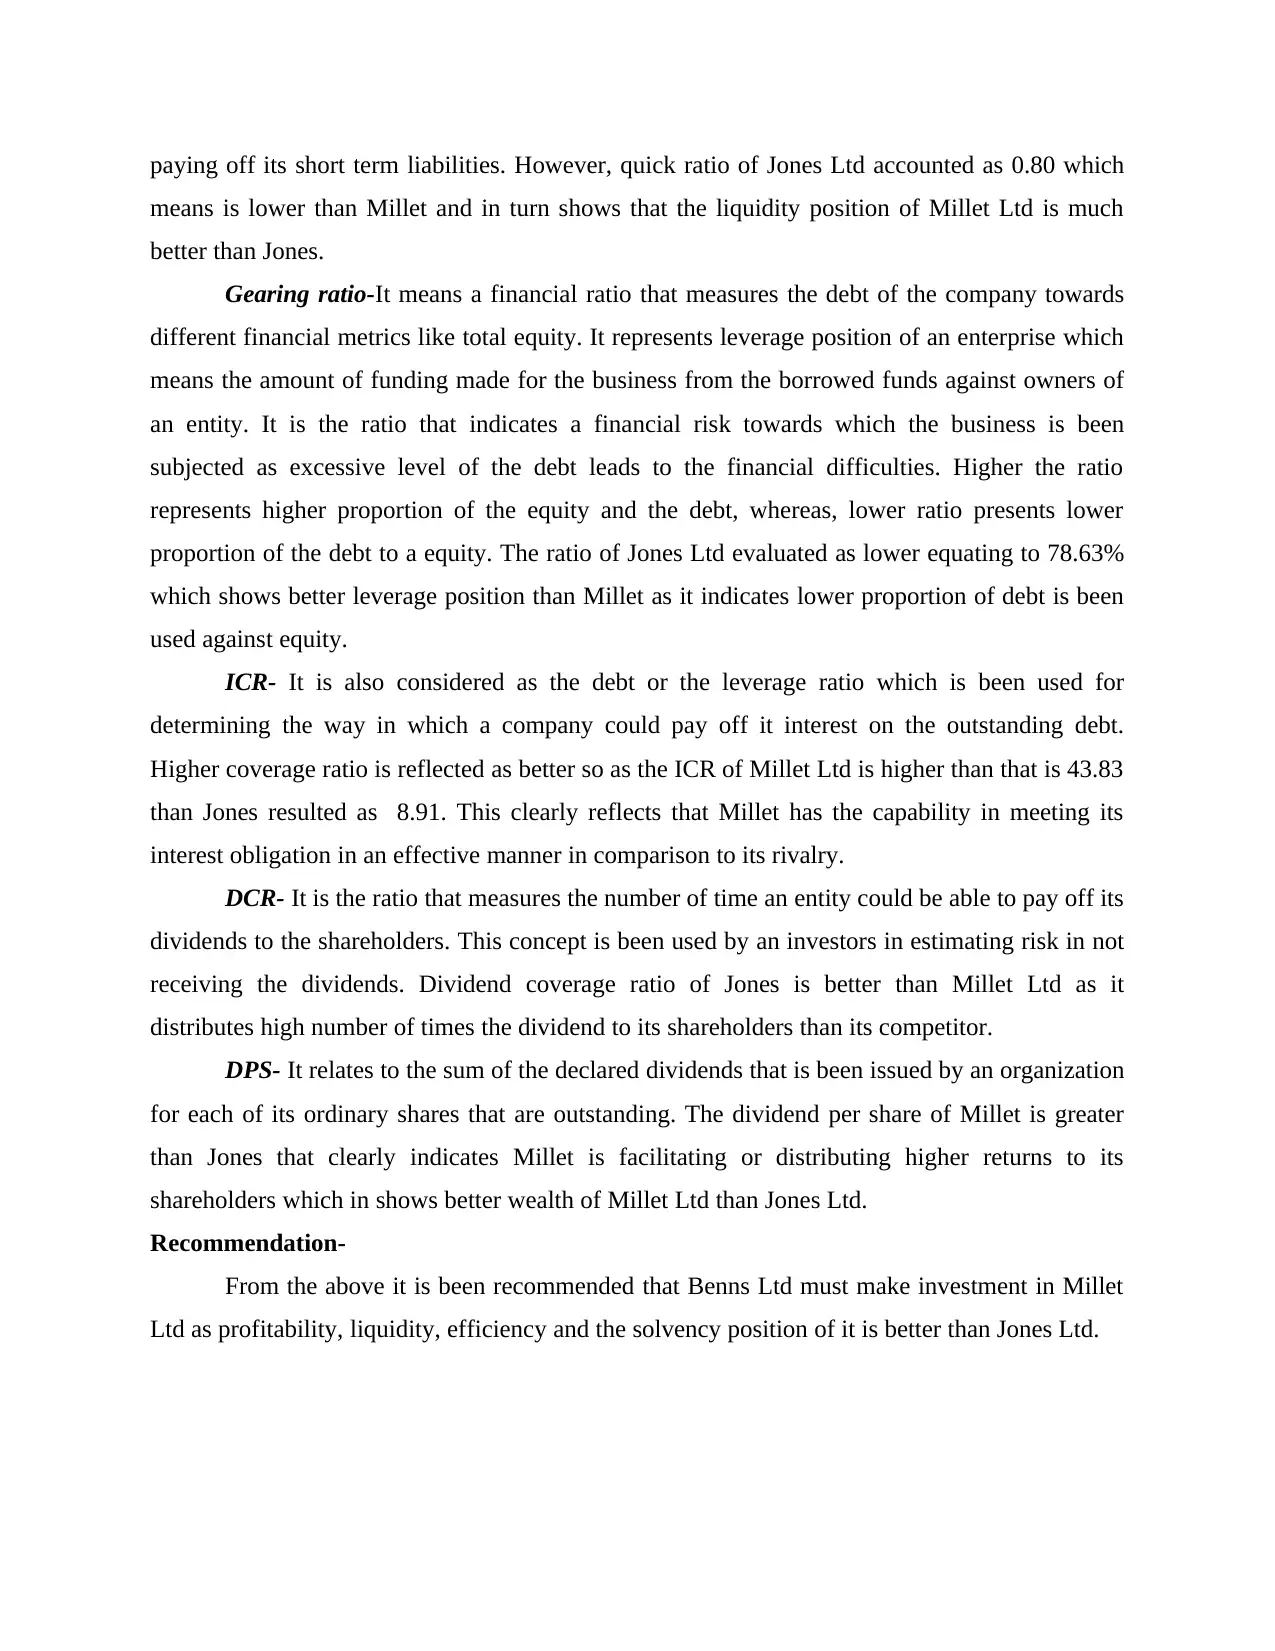
paying off its short term liabilities. However, quick ratio of Jones Ltd accounted as 0.80 which
means is lower than Millet and in turn shows that the liquidity position of Millet Ltd is much
better than Jones.
Gearing ratio-It means a financial ratio that measures the debt of the company towards
different financial metrics like total equity. It represents leverage position of an enterprise which
means the amount of funding made for the business from the borrowed funds against owners of
an entity. It is the ratio that indicates a financial risk towards which the business is been
subjected as excessive level of the debt leads to the financial difficulties. Higher the ratio
represents higher proportion of the equity and the debt, whereas, lower ratio presents lower
proportion of the debt to a equity. The ratio of Jones Ltd evaluated as lower equating to 78.63%
which shows better leverage position than Millet as it indicates lower proportion of debt is been
used against equity.
ICR- It is also considered as the debt or the leverage ratio which is been used for
determining the way in which a company could pay off it interest on the outstanding debt.
Higher coverage ratio is reflected as better so as the ICR of Millet Ltd is higher than that is 43.83
than Jones resulted as 8.91. This clearly reflects that Millet has the capability in meeting its
interest obligation in an effective manner in comparison to its rivalry.
DCR- It is the ratio that measures the number of time an entity could be able to pay off its
dividends to the shareholders. This concept is been used by an investors in estimating risk in not
receiving the dividends. Dividend coverage ratio of Jones is better than Millet Ltd as it
distributes high number of times the dividend to its shareholders than its competitor.
DPS- It relates to the sum of the declared dividends that is been issued by an organization
for each of its ordinary shares that are outstanding. The dividend per share of Millet is greater
than Jones that clearly indicates Millet is facilitating or distributing higher returns to its
shareholders which in shows better wealth of Millet Ltd than Jones Ltd.
Recommendation-
From the above it is been recommended that Benns Ltd must make investment in Millet
Ltd as profitability, liquidity, efficiency and the solvency position of it is better than Jones Ltd.
⊘ This is a preview!⊘
Do you want full access?
Subscribe today to unlock all pages.
Trusted by 1+ million students worldwide
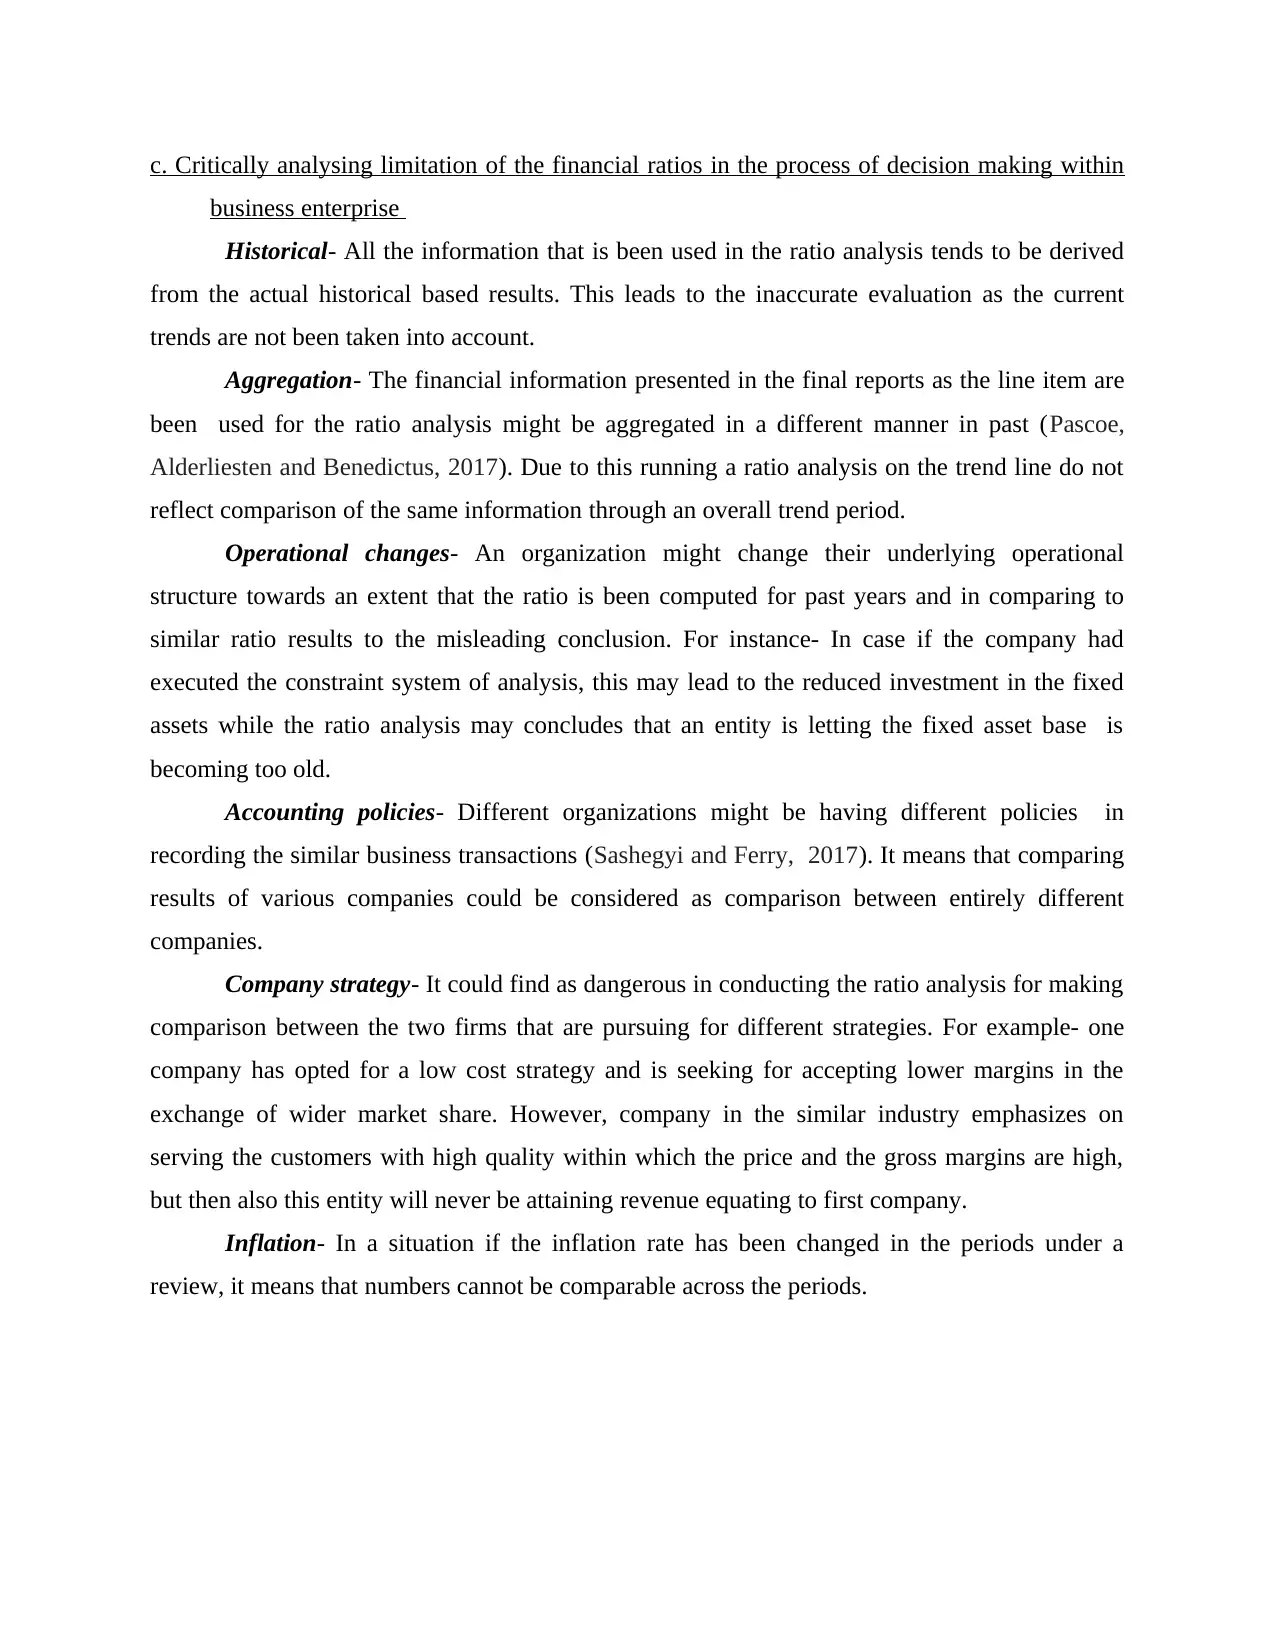
c. Critically analysing limitation of the financial ratios in the process of decision making within
business enterprise
Historical- All the information that is been used in the ratio analysis tends to be derived
from the actual historical based results. This leads to the inaccurate evaluation as the current
trends are not been taken into account.
Aggregation- The financial information presented in the final reports as the line item are
been used for the ratio analysis might be aggregated in a different manner in past (Pascoe,
Alderliesten and Benedictus, 2017). Due to this running a ratio analysis on the trend line do not
reflect comparison of the same information through an overall trend period.
Operational changes- An organization might change their underlying operational
structure towards an extent that the ratio is been computed for past years and in comparing to
similar ratio results to the misleading conclusion. For instance- In case if the company had
executed the constraint system of analysis, this may lead to the reduced investment in the fixed
assets while the ratio analysis may concludes that an entity is letting the fixed asset base is
becoming too old.
Accounting policies- Different organizations might be having different policies in
recording the similar business transactions (Sashegyi and Ferry, 2017). It means that comparing
results of various companies could be considered as comparison between entirely different
companies.
Company strategy- It could find as dangerous in conducting the ratio analysis for making
comparison between the two firms that are pursuing for different strategies. For example- one
company has opted for a low cost strategy and is seeking for accepting lower margins in the
exchange of wider market share. However, company in the similar industry emphasizes on
serving the customers with high quality within which the price and the gross margins are high,
but then also this entity will never be attaining revenue equating to first company.
Inflation- In a situation if the inflation rate has been changed in the periods under a
review, it means that numbers cannot be comparable across the periods.
Paraphrase This Document
Need a fresh take? Get an instant paraphrase of this document with our AI Paraphraser
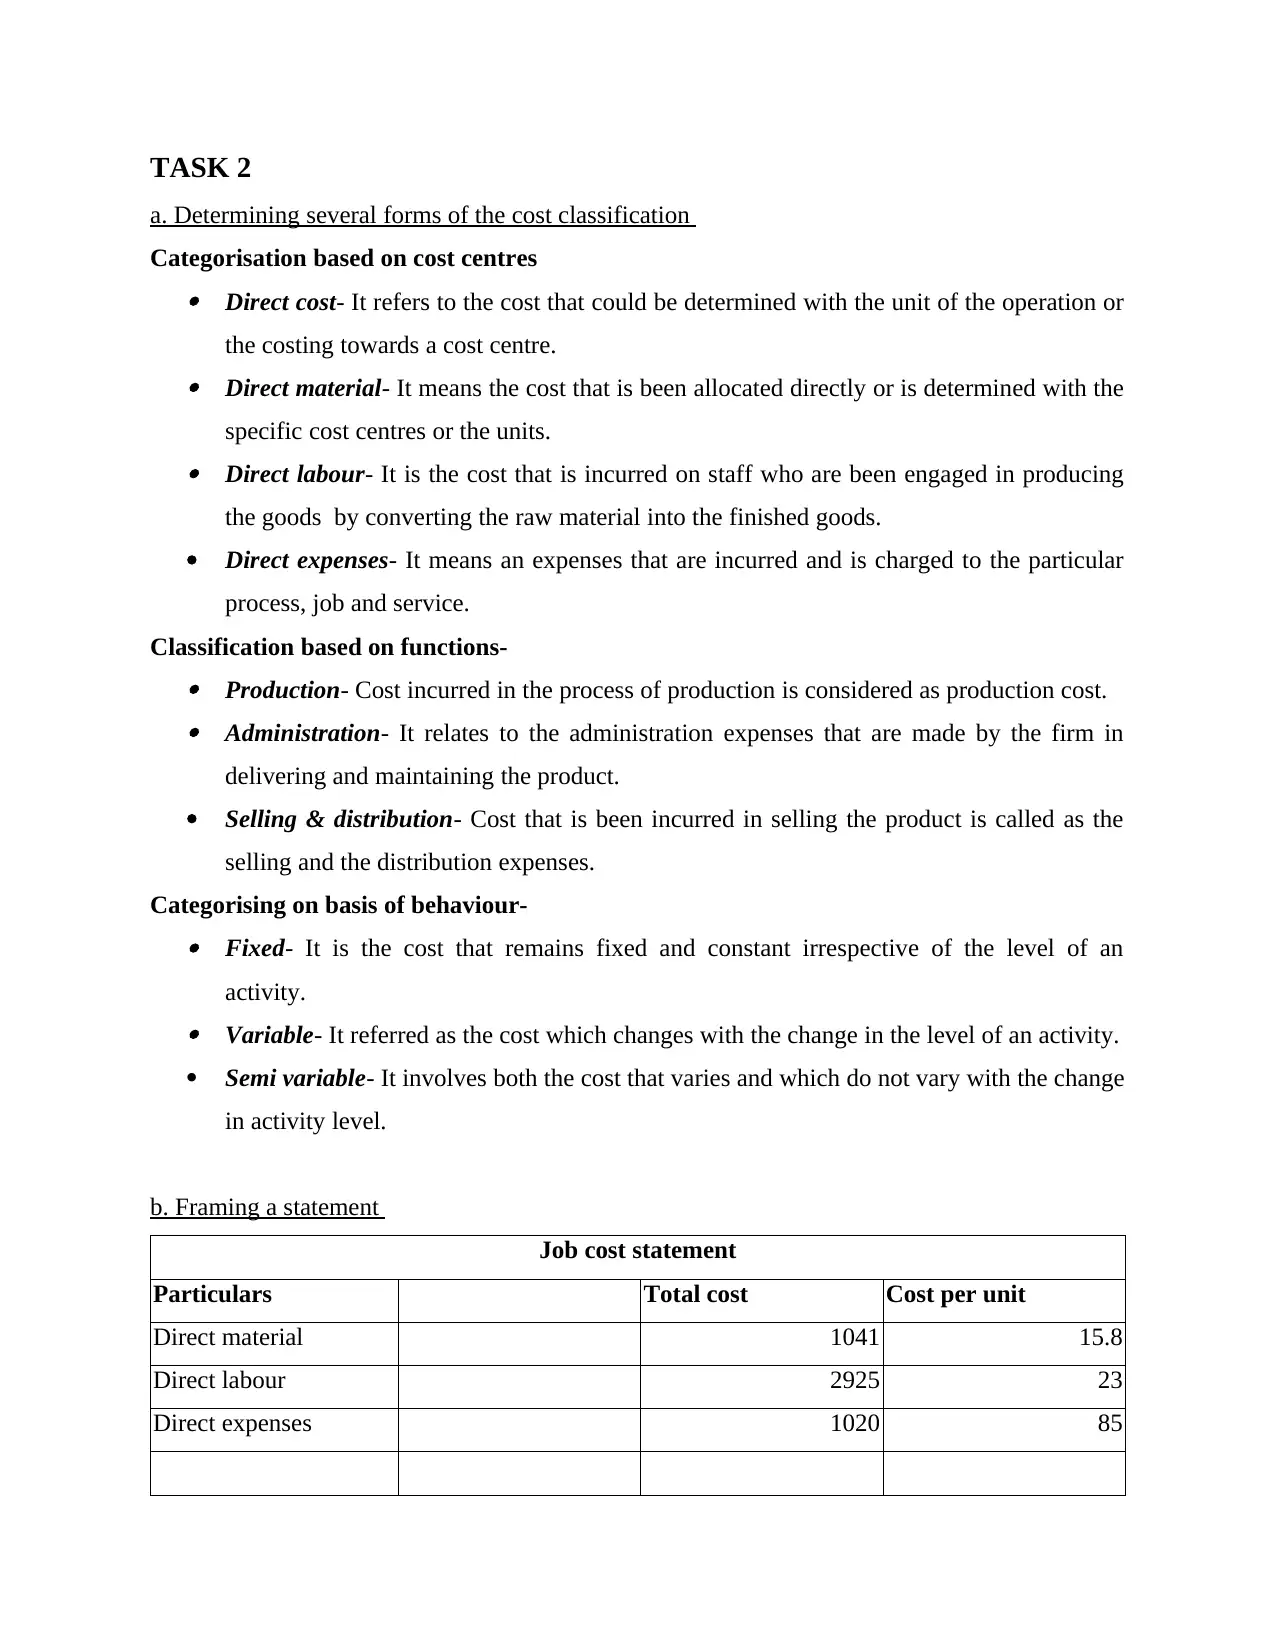
TASK 2
a. Determining several forms of the cost classification
Categorisation based on cost centres Direct cost- It refers to the cost that could be determined with the unit of the operation or
the costing towards a cost centre. Direct material- It means the cost that is been allocated directly or is determined with the
specific cost centres or the units. Direct labour- It is the cost that is incurred on staff who are been engaged in producing
the goods by converting the raw material into the finished goods.
Direct expenses- It means an expenses that are incurred and is charged to the particular
process, job and service.
Classification based on functions- Production- Cost incurred in the process of production is considered as production cost. Administration- It relates to the administration expenses that are made by the firm in
delivering and maintaining the product.
Selling & distribution- Cost that is been incurred in selling the product is called as the
selling and the distribution expenses.
Categorising on basis of behaviour- Fixed- It is the cost that remains fixed and constant irrespective of the level of an
activity. Variable- It referred as the cost which changes with the change in the level of an activity.
Semi variable- It involves both the cost that varies and which do not vary with the change
in activity level.
b. Framing a statement
Job cost statement
Particulars Total cost Cost per unit
Direct material 1041 15.8
Direct labour 2925 23
Direct expenses 1020 85
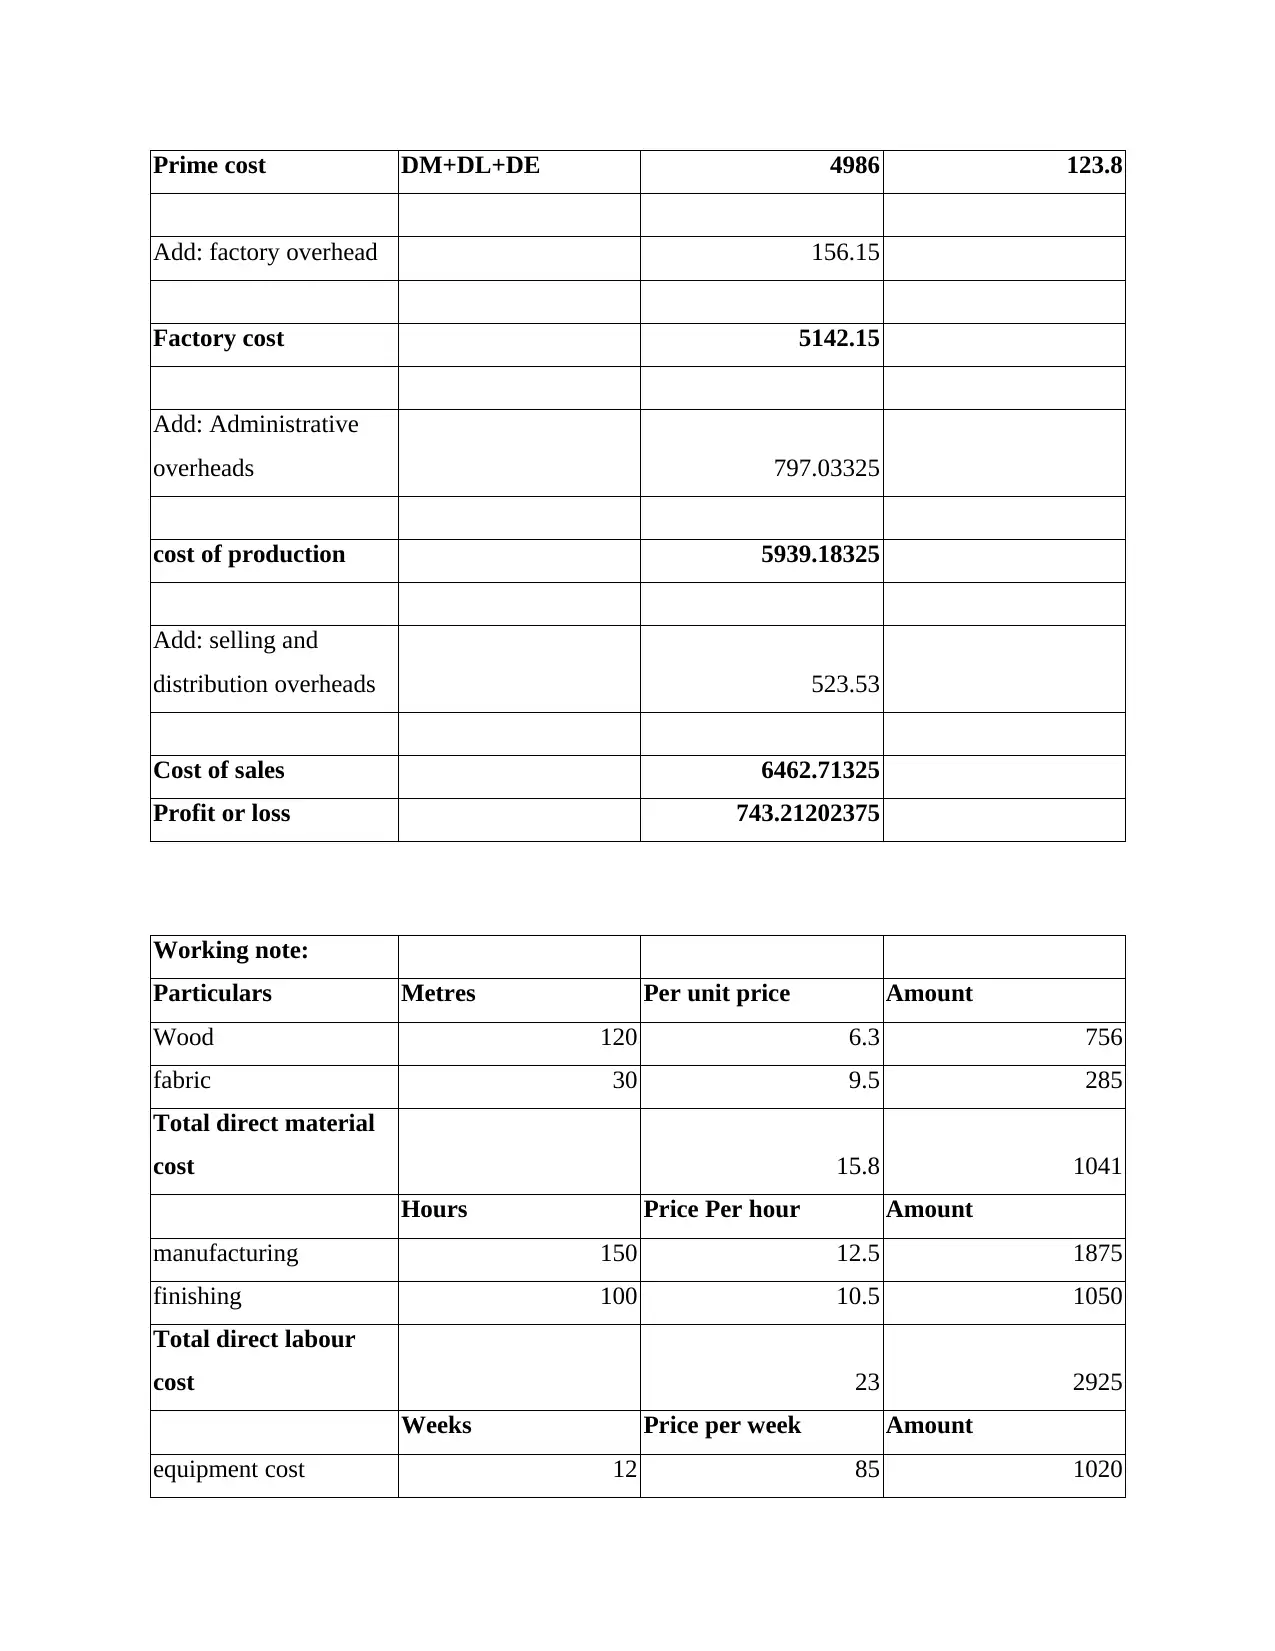
Prime cost DM+DL+DE 4986 123.8
Add: factory overhead 156.15
Factory cost 5142.15
Add: Administrative
overheads 797.03325
cost of production 5939.18325
Add: selling and
distribution overheads 523.53
Cost of sales 6462.71325
Profit or loss 743.21202375
Working note:
Particulars Metres Per unit price Amount
Wood 120 6.3 756
fabric 30 9.5 285
Total direct material
cost 15.8 1041
Hours Price Per hour Amount
manufacturing 150 12.5 1875
finishing 100 10.5 1050
Total direct labour
cost 23 2925
Weeks Price per week Amount
equipment cost 12 85 1020
⊘ This is a preview!⊘
Do you want full access?
Subscribe today to unlock all pages.
Trusted by 1+ million students worldwide
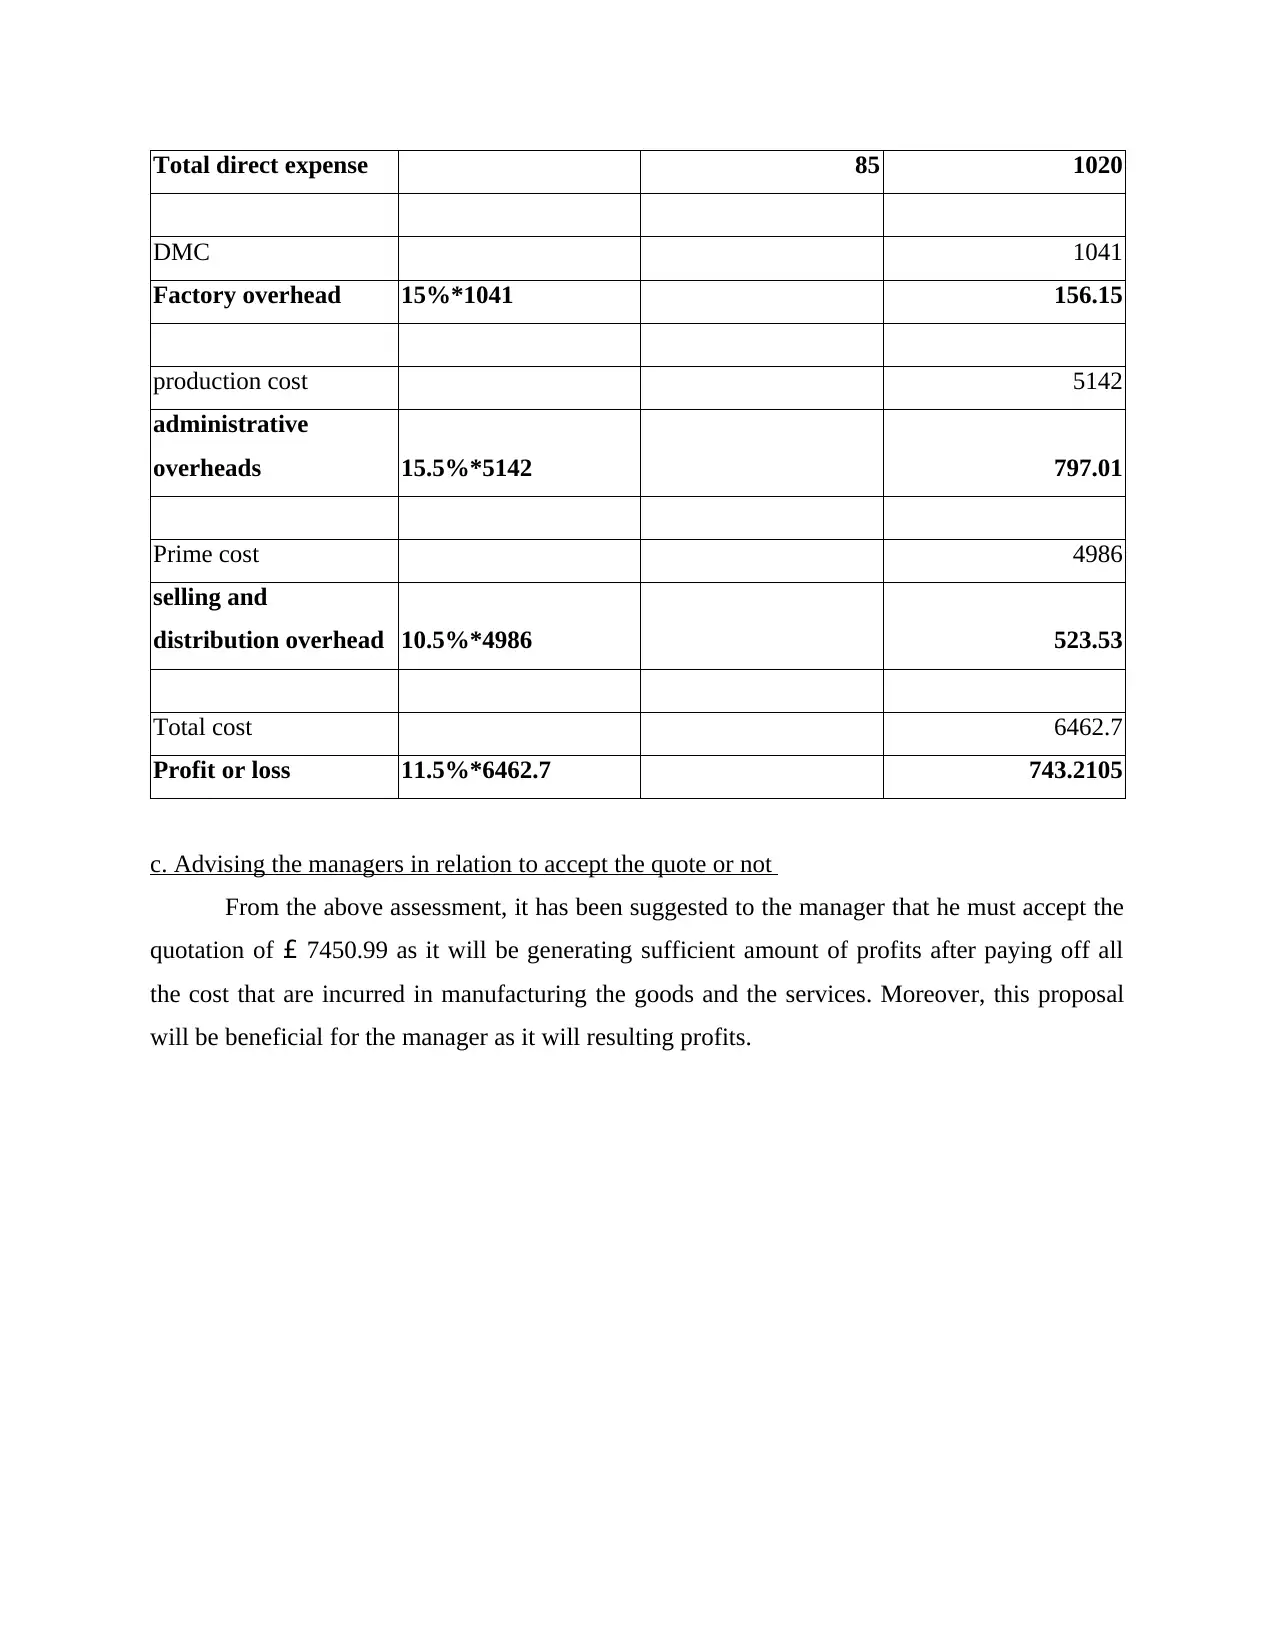
Total direct expense 85 1020
DMC 1041
Factory overhead 15%*1041 156.15
production cost 5142
administrative
overheads 15.5%*5142 797.01
Prime cost 4986
selling and
distribution overhead 10.5%*4986 523.53
Total cost 6462.7
Profit or loss 11.5%*6462.7 743.2105
c. Advising the managers in relation to accept the quote or not
From the above assessment, it has been suggested to the manager that he must accept the
quotation of £ 7450.99 as it will be generating sufficient amount of profits after paying off all
the cost that are incurred in manufacturing the goods and the services. Moreover, this proposal
will be beneficial for the manager as it will resulting profits.
Paraphrase This Document
Need a fresh take? Get an instant paraphrase of this document with our AI Paraphraser
REFERENCES
Books and journals
Bragg, S. M., 2018. The Interpretation of Financial Statements. AccountingTools, Incorporated.
Pascoe, J. A., Alderliesten, R. C. and Benedictus, R., 2017. On the physical interpretation of the
R-ratio effect and the LEFM parameters used for fatigue crack growth in adhesive
bonds. International Journal of Fatigue. 97. pp.162-176.
Sashegyi, A. and Ferry, D., 2017. On the interpretation of the hazard ratio and communication of
survival benefit. The oncologist. 22(4). pp.484-486.
Varadharajan, S. and et.al., 2015. Exploring in silico prediction of the unbound brain-to-plasma
drug concentration ratio: model validation, renewal, and interpretation. Journal of
pharmaceutical sciences. 104(3). pp.1197-1206.
1 out of 11


Your All-in-One AI-Powered Toolkit for Academic Success.
+13062052269
info@desklib.com
Available 24*7 on WhatsApp / Email
![[object Object]](/_next/static/media/star-bottom.7253800d.svg)
Unlock your academic potential
Copyright © 2020–2026 A2Z Services. All Rights Reserved. Developed and managed by ZUCOL.